 Multi-family
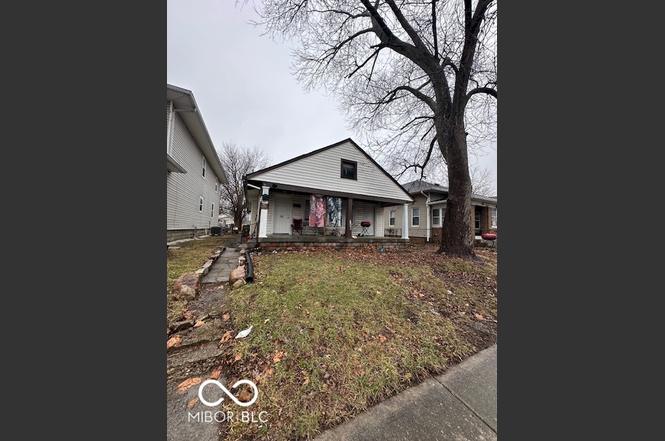
1344 N Gale St · Indianapolis city (balance), IN
Flood risk 1/10 · Minimal
- FEMA flood zone
- X (unshaded)
- Chance of flooding over 30 yrs
- 0.0%
- Est. flood insurance / yr
- $507 – $1,088
Fire risk 1/10 · Minimal
- Est. fire insurance / yr
- $717 – $1,331
Heat risk 3/10 · Minor
- Hot days now (above 102°F)
- 7 days/yr
- Hot days in 30 yrs
- 19 days/yr
Wind risk 2/10 · Minimal
- Chance of severe wind over 30 yrs
- 0.0%
Air-quality risk 4/10 · Minor
- Unhealthy air days now
- 5 days/yr
- Unhealthy air days in 30 yrs
- 7 days/yr
Risk factors via First Street. Map © Google.
Why this score? — see what drove the B- grade
The composite is a weighted blend of 9 inputs, each scored 0–100. Each bar is that input's sub-score; the figure is the points it added to the 100-point composite (weight × sub-score).
- Cash flow +30.0/30.0
- 1% rule +10.0/10.0
- DSCR +10.0/10.0
- ARV discount +7.5/15.0
- Rent growth +4.3/5.0
- Livability +2.5/5.0
- Condition / age +2.5/5.0
- Schools +1.4/10.0
- Appreciation +0.0/10.0
$69,900
🖨 Deal sheet 📄 Offer letter ✓ Due diligence
Multi-family units
County records classify this as Multi-Family (2-4 Unit). Listing-text estimate: 1 unit. estimate disagrees with records
Listing remarks
Great investment opportunity! Close to Brookside Park, The Oaks Academy, downtown Indy, shops & restaurants. Come check it out today!!
Key facts
- Downtown indy
- Brookside park
- Restaurants
Tags
Neighborhood map
What this means for you Summary
Snapshot
- This is a 2-bed/1344.0-bath multifamily listed at $70k.
Deal economics
- At list price, monthly cash flow is $1k ($16k/yr) — positive.
- The deal already cash-flows at list — no discount required.
- Meets the 1% rule at list price ($2k rent vs $70k).
- Recommended offer: $66k (6.0% below list) — sets the bar for market timing.
- Cap rate 29.4% vs local median 4.4% in Indianapolis city (balance) — top-decile yield for the area; either an underpriced asset or a hidden risk that comps aren't pricing in. Stress-test before assuming the spread holds.
Location & tenants
- Location reads: area grade B — affects rentability + tenant quality, not the cash-flow math above.
- Indianapolis Public Schools (urban): math 14% / reading 20% proficiency, ranked #286 of 301 in IN (top 95%) — low school quality limits family demand, transient renter base, plan for 1-2y turnover; 77% free/reduced lunch — lower-income household profile, screen leases tightly.
- Market conditions: Rents rising fast (+7.3%/yr); 480 active listings in the ZIP; 40 comparable units currently listed for rent nearby; rentals at typical pace (median 24d on market — plan ~3-4 weeks tenant-placement turnaround); 1,906 units permitted in Marion County in 2024 (621 in 5+ unit buildings).
- At $2,368/mo this rent would consume 58% of the median local household income ($49k/yr) (locally 1906% of renters already pay >50% of income on rent) — very limited rent-growth headroom before tenants either downsize or default.
Forward outlook
- Local home prices are declining (-3.0%/yr); year-one equity from $483 of loan paydown is wiped out by about $2k of value loss. Plan a longer hold.
- Marion County population projected at +18% by 2050 — long-run rental-demand tailwind backs the buy-and-hold thesis.
- At projected returns (-3.0% appreciation + 7.3% rent growth), your $20k cash investment doubles in ~2 years — after that, you're playing with house money.
Negotiation context
- It's been on market 73 days — a 6% lower offer ($66k) is reasonable based on typical stale-listing flexibility.
- 5 sale attempts since 24y ago; this cycle's ask has dropped $15k (18%) from the opening price — seller is motivated, your offer sets the floor, not the list.
- Current owner paid $8k; list at $70k implies a 752% gain — meaningful room to come down on a strong offer.
Risks & watch-outs
- Watch-outs: built in 1900 — expect roof / HVAC / electrical / plumbing capex.
Questions for the listing agent
- It's been on market 73 days. Have you received any prior offers? Is the seller open to a 6% concession, seller financing, or rate buy-down credit?
- Built in 1900 — when were the roof, HVAC, electrical panel, plumbing, and water heater last replaced?
- Why hasn't it sold? Are there any deal-killer items the seller is aware of (foundation, flood, title, zoning, code violations)?
- Is there a deadline driving the sale (1031 exchange, divorce, estate, relocation)? That informs how much negotiation room exists.
- What's the average days-on-market for RENTAL listings here right now (not sales)? A rising rental-DOM trend means longer vacancies and softer asking-rent achievability than the comps imply.
- What's the recent tenant-quality profile in this submarket — average credit score on applications, eviction rate, late-payment / NSF rate, and stable-employment percentage? A property-management company in the area should have these aggregated.
- How much new apartment / multifamily construction is in the pipeline within 1–3 miles? Heavy new supply (>2% of stock underway) typically softens rents 12–24 months out; light construction supports rent growth.
Investment metrics
- 1% rule
- 3.39% ✓
- Cap rate
- 29.38%
- Cash-on-cash
- 82.44%
- DSCR
- 4.67
- GRM
- 2.5
CMA / ARV
- ARV (on-the-fly)
- $164,956
- Comps found
- 2
Show comp detail 2 sales within ~0.75 mi
| Address | Dist | Beds/Ba | Sqft | Sold | Price | $/sf | Match |
|---|---|---|---|---|---|---|---|
| 3419 E 9th St | 0.47mi | 2/1.0 | 672 (+3%) | 24mo | $170,000 | $253 | 33 |
| 1522 N Tacoma Ave | 0.74mi | 2/1.0 | 660 (+1%) | 17mo | $130,000 | $197 | 29 |
Match score weights: distance 35% · size 25% · config 20% · recency 20%. Top-matched comps best support the ARV.
Projected returns pro-forma
-3.0% appreciation · 7.31% rent growth · sell at horizon
- IRR
- 87.7%
- Equity multiple
- 5.35×
- Total profit
- $85,085
- Equity at exit
- $10,422
- IRR
- 91.8%
- Equity multiple
- 12.89×
- Total profit
- $232,674
- Equity at exit
- $6,044
Cash invested: $19,572 (down + closing). Projections, not guarantees.
Landlord ↔ Tenant lean methodology
- Overall (STATE)
- 90 Strongly Landlord-Friendly
- State Indiana
- 90 Strongly Landlord-Friendly · R+11
- County
- — inherits STATE
- City
- — inherits STATE
ZIP-level market 46201
- Home prices YoY
- -33.9%
- Rents YoY
- 7.3%
- Active inventory
- 480
- Price-to-rent
- 4.9×
Monthly cashflow live
- Estimated rent
- $2,368 medium interval (Pro) →
- Mortgage (P&I)
- −$367
- Tax from tax record
- −$130 /mo · $1,566/yr
- Insurance
- −$29
- HOA
- −$0
- Vacancy / Maint / Mgmt
- −$497
- Net cashflow
- $1,345
Break-even live
2-unit breakdown (identical units grouped — click to expand)
| Units | Beds | Baths | Est. rent |
|---|---|---|---|
| 2× units | 3 | 1.5 | $2,368 |
| #1 | 3 | 1.5 | $1,184 |
| #2 | 3 | 1.5 | $1,184 |
| Total (2 units) | $2,368 | ||
UW: 25.0% down · 7.5% · 30yr · 1.5% tax · 5.0% vac · 8.0% maint · 8.0% mgmt
Financing live
Cash to close
- Down payment
- $17,475
- Closing costs
- $2,097
- Reserves months
- —
- Total cash needed
- —
Loan-product check · same deal, 3 products live
Conventional
25% down · 7.5% · 30yr
- Down + closing
- —
- Monthly P&I
- —
- Monthly cashflow
- —
- DSCR
- —
- Eligible?
- —
Personal DTI + credit; lowest rate.
DSCR
20% down · 8.5% · 30yr
- Down + closing
- —
- Monthly P&I
- —
- Monthly cashflow
- —
- DSCR
- —
- Eligible?
- —
No personal income docs; deal must DSCR.
Hard money
10% down · 12.0% · 12mo
- Down + closing
- —
- Monthly P&I
- —
- Monthly cashflow
- —
- DSCR
- —
- Eligible?
- —
Short-term bridge; refi at stabilization.
Rent comps 40 comps
| Address | Beds | Baths | Sqft | Rent | $/sqft | DOM | Units | Dist |
|---|---|---|---|---|---|---|---|---|
| 1358 N Gale St Indianapolis, IN | 1.0 | 1.0 | 550 | $890 | $1.62 | 16d | 1 | 0.02mi |
| 1301 N Olney St Unit 1303 Indianapolis, IN | 2.0 | 1.0 | 750 | $1,100 | $1.47 | 44d | 1 | 0.10mi |
| 1106 N Gale St Unit 1 Indianapolis, IN | 2.0 | 1.0 | 750 | $895 | $1.19 | 44d | 1 | 0.22mi |
| 3709 Brookside Parkway South Dr Indianapolis, IN | 1.0 | 1.0 | 742 | $825 | $1.11 | 23d | 1 | 0.22mi |
| 1028 N Olney St Unit 1030 Indianapolis, IN | 1.0 | 1.0 | 700 | $800 | $1.14 | 23d | 1 | 0.27mi |
| 1036 N Tuxedo St Indianapolis, IN | 1.0 | 1.0 | 646 | $750 | $1.16 | 4d | 1 | 0.28mi |
| 1306 N Chester Ave Indianapolis, IN | 1.0 | 1.0 | 600 | $800 | $1.33 | 20d | 1 | 0.35mi |
| 1114 N Dearborn St Indianapolis, IN | 1.0 | 1.0 | 646 | $795 | $1.23 | 44d | 1 | 0.35mi |
| 1518 N Chester Ave Indianapolis, IN | 2.0 | 1.0 | 672 | $700 | $1.04 | 7d | 1 | 0.36mi |
| 1327 N Chester Ave Indianapolis, IN | 1.0 | 1.0 | 600 | $795 | $1.32 | 14d | 1 | 0.37mi |
| 1538 N Grant Ave Indianapolis, IN | 1.0 | 1.0 | 375 | $700 | $1.87 | 44d | 1 | 0.43mi |
| 1531 N Grant Ave Indianapolis, IN | 1.0 | 1.0 | 611 | $875 | $1.43 | 23d | 1 | 0.45mi |
| 1450 N Gladstone Ave Indianapolis, IN | 1.0 | 1.0 | 588 | $799 | $1.36 | 44d | 1 | 0.47mi |
| 1510 N Gladstone Ave Indianapolis, IN | 1.0 | 1.0 | 570 | $765 | $1.34 | 44d | 1 | 0.48mi |
| 1512 N Gladstone Ave Unit 1510 1510 Indianapolis, IN | 1.0 | 1.0 | 570 | $830 | $1.46 | 14d | 1 | 0.48mi |
| 3058 Brookside Parkway North Dr Indianapolis, IN | 1.0 | 1.0 | 700 | $875 | $1.25 | 12d | 1 | 0.51mi |
| 1432 N Colorado Ave Indianapolis, IN | 1.0 | 1.0 | 584 | $875 | $1.50 | 23d | 1 | 0.53mi |
| 1315 N Rural St Indianapolis, IN | 1.0 | 1.0 | 700 | $1,000 | $1.43 | 4d | 1 | 0.55mi |
| 927 N Chester Ave Indianapolis, IN | 1.0 | 1.0 | 596 | $750 | $1.26 | 44d | 1 | 0.58mi |
| 821 N Bradley Ave Indianapolis, IN | 1.0 | 1.0 | 663 | $850 | $1.28 | 4d | 1 | 0.60mi |
| 2827 E 18th St Indianapolis, IN | 2.0 | 1.0 | 726 | $1,300 | $1.79 | 23d | 1 | 0.61mi |
| 896 N Gladstone Ave Indianapolis, IN | 1.0 | 1.0 | 580 | $775 | $1.34 | 44d | 1 | 0.65mi |
| 1931 N Oxford St Indianapolis, IN | 1.0 | 1.0 | 616 | $875 | $1.42 | 4d | 1 | 0.66mi |
| 833 N Gladstone Ave Indianapolis, IN | 1.0 | 1.0 | 687 | $825 | $1.20 | 23d | 1 | 0.74mi |
| 628 N Oxford St Indianapolis, IN | 1.0 | 1.0 | 536 | $775 | $1.45 | 23d | 1 | 0.80mi |
| 2030 N Colorado Ave Indianapolis, IN | 2.0 | 1.0 | 728 | $1,150 | $1.58 | 23d | 1 | 0.83mi |
| 810 N Euclid Ave Indianapolis, IN | 3.0 | 1.0 | 574 | $1,550 | $2.70 | 20d | 1 | 0.85mi |
| 412 N Bradley Ave Unit 3 Indianapolis, IN | 2.0 | 1.0 | 700 | $950 | $1.36 | 23d | 1 | 0.89mi |
| 415 N Oxford St Indianapolis, IN | 1.0 | 1.0 | 580 | $650 | $1.12 | 23d | 1 | 0.98mi |
| 1951 N Bosart Ave Indianapolis, IN | 2.0 | 1.0 | 728 | $1,000 | $1.37 | 4d | 1 | 1.01mi |
| 1824 N Riley Ave Indianapolis, IN | 2.0 | 1.0 | 720 | $1,150 | $1.60 | 44d | 1 | 1.14mi |
| 2422 Adams St Unit 2 Indianapolis, IN | 1.0 | 1.0 | 700 | $850 | $1.21 | 44d | 1 | 1.18mi |
| 621 Tecumseh St Indianapolis, IN | 2.0 | 1.0 | 726 | $1,025 | $1.41 | 44d | 1 | 1.23mi |
| 2449 Wheeler St Indianapolis, IN | 1.0 | 1.0 | 600 | $950 | $1.58 | 23d | 1 | 1.24mi |
| 37 S Sherman Dr Indianapolis, IN | 1.0 | 1.0 | 700 | $800 | $1.14 | 23d | 1 | 1.25mi |
| 679 Woodruff Place East Dr Indianapolis, IN | 1.0 | 1.0 | 600 | $895 | $1.49 | 23d | 1 | 1.26mi |
| 830 N Emerson Ave Indianapolis, IN | 1.0 | 1.0 | 560 | $850 | $1.52 | 44d | 1 | 1.27mi |
| 3011 Oxford Ln Indianapolis, IN | 1.0 | 1.0 | 640 | $800 | $1.25 | 44d | 1 | 1.29mi |
| 831 N Emerson Ave Indianapolis, IN | 1.0 | 1.0 | 647 | $1,000 | $1.55 | 23d | 1 | 1.30mi |
| 784 Woodruff Place Middle Dr Indianapolis, IN | 1.0 | 1.0 | 750 | $1,300 | $1.73 | 44d | 1 | 1.33mi |
Listing history 26 events
-
2026-06-18days on market $69,900 Active 73 DOM
-
2026-06-17days on market $69,900 Active 72 DOM
-
2026-06-16days on market $69,900 Active 71 DOM
-
2026-06-15days on market $69,900 Active 70 DOM
-
2026-06-13days on market $69,900 Active 68 DOM
-
2026-06-13pricedays on market $69,900 Active 67 DOM
-
2026-06-09days on market $79,900 Active 64 DOM
-
2026-06-08days on market $79,900 Active 63 DOM
-
2026-06-07days on market $79,900 Active 62 DOM
-
2026-06-03days on market $79,900 Active 58 DOM
-
2026-06-02days on market $79,900 Active 57 DOM
-
2026-06-01days on market $79,900 Active 56 DOM
-
2026-06-01status $79,900 Active 55 DOM
-
2026-04-27status Pending
-
2026-04-22price $79,900
-
2026-04-08price $84,000
-
2026-03-27price $84,500
-
2026-03-03$84,900 Active
-
2006-02-28historical
-
2006-02-28historical
-
2005-09-24$49,900
-
2005-09-24$49,900
-
2004-12-28soldstatus $8,200
-
2004-10-18$9,900
-
2002-04-30historical
-
2002-01-31$9,900
ⓘ Source: listings_history table (triggers on properties + properties_extension) + one-shot
backfill from property_details.listing_events for pre-trigger history.
Tax reassessment forecast IN · Partial reset (capped growth)
- Current annual tax
- $1,566 · $130/mo
- Projected year-2 tax
- $1,566 · $130/mo
- Expected delta
- $0/yr ($0/mo · 0.0%)
ⓘ Screening estimate from a state-policy table — verify with the county assessor before closing.
Climate risk First Street
- Flood 1/10 Low FEMA zone X (unshaded) · 0% chance over 30 yrs
- Wildfire 1/10 Low
- Heat 3/10 Moderate 7 d/yr ≥102°F today · 19 d/yr by 30 yrs out
- Wind 2/10 Low 0% chance of damaging wind over 30 yrs
- Air quality 4/10 Moderate 5 unhealthy d/yr today · 7 by 30 yrs out
Nearby sold comps map
Loading sold comps map…
Walkable amenities ~0.75 mi
Loading nearby amenities…
Taxation est. · year 1
- Rental income
- $28,416
- − Mortgage interest
- −$3,915
- − Property taxes
- −$1,566
- − Insurance
- −$350
- − Repairs & maintenance
- −$2,273
- − Management
- −$2,273
- − Depreciation
- −$2,033
- Taxable income
- $16,005
- Est. tax owed @ 24.0%
- −$3,841
- After-tax cash flow
- $12,293/yr
For passive investors: Depreciation is non-cash, so a rental often shows a tax loss while cash-flowing — sheltering income. Rental losses are passive: they offset passive income freely, and up to $25,000/yr can offset ordinary (W-2) income if you actively participate and your MAGI is under $100k (phasing out to $0 by $150k); unused losses carry forward. On sale, claimed depreciation is recaptured at up to 25%, and gains may owe capital-gains tax (a 1031 exchange can defer both). Figures are a year-1 estimate at your 24.0% rate — not tax advice; consult a CPA.
Schools (NCES district)
- District
- Indianapolis Public Schools
- NCES district ID
- 1804770
- Math proficiency
- 14% ▼ -7.00%
- Reading proficiency
- 20% ▼ -3.00%
- Median HH income
- $32,034
- Composite
- 13.69/100
- National rank
- #9499
- State rank
- #286 of 301 in IN
Livability — Indianapolis city (balance)
No livability data for this city. (Only ~50 U.S. cities are tracked.)
Census & demographics
- Census place
- Indianapolis city (balance), IN
- County
- Marion County · 998,460 people
- City population
- 881,119
- Metro
- Indianapolis-Carmel-Anderson, IN
- Population (ZIP)
- 30,335
- Household income
- $49,195
- Rent vs Own
- Severe rent burden
- 1906.0
Population outlook (Marion County) Hauer SSP2
- Today (2025)
- 1,025,572 people
- By 2030
- 1,065,727 · +3.9%
- By 2040
- 1,141,577 · +11.3%
- By 2050
- 1,208,920 · +17.9%
- By 2075
- 1,367,288 · +33.3%
- By 2100
- 1,438,201 · +40.2%
Race, ethnicity, and origin ACS 2023
- Neighborhood character
- Diverse neighborhood (Simpson 0.63)
- Race & ethnicity
- White 53% Hispanic / Latino 23% Black 18% Two or more races 9%
- Hispanic origin (detail)
- Mexican 14% Puerto Rican 2%
- Common ancestry
- Slovak 2% Lithuanian 2% Italian 1%
- Foreign-born
- 9% · Canada
- Languages at home
- 81% English-only · Spanish 17%
Political lean MEDSL · Marion
- 2024 margin
- Strong D (+27.7) · D 63.0% · R 35.3% · Other 1.7%
- 2008→2024 swing
- -0.7pp no change · 2008: 28.4pp · 2024: 27.7pp
- All cycles
- 2024: D+27.7 2020: D+29.1 2016: D+22.8 2012: D+22.2 2008: D+28.4
Not yet ingested
- Civics
- —
Market trends
- HPI YoY
- ▼ -192.51%
- Current HPI
- 375.0969
- Rent YoY
- ▲ 7.31%
- Metro
- Indianapolis-Carmel-Anderson, IN
- State GDP YoY
- ▲ 2.90%
- F500 in state
- 18
Industry mix (Fortune 500 HQ in IN)
| Industry | F500 HQs | Revenue |
|---|---|---|
| Industrial Machinery | 2 | $37B |
|
||
| Healthcare | 1 | $177B |
|
||
| Pharmaceuticals | 1 | $45B |
|
||
| Metals / Steel | 1 | $18B |
|
||
| Agriculture | 1 | $17B |
|
||
| Packaging | 1 | $12B |
|
||
Price history
+707.1% since first listed13 events — show timeline
- 2026-04-27 Pending — MIBOR as Distributed by MLS Grid
- 2026-04-22 Price Changed $79,900 MIBOR as Distributed by MLS Grid
- 2026-04-08 Price Changed $84,000 MIBOR as Distributed by MLS Grid
- 2026-03-27 Price Changed $84,500 MIBOR as Distributed by MLS Grid
- 2026-03-03 Listed $84,900 MIBOR as Distributed by MLS Grid
- 2006-02-28 Listing Removed — MIBOR as Distributed by MLS Grid
- 2006-02-28 Listing Removed — MIBOR as Distributed by MLS Grid
- 2005-09-24 Listed $49,900 MIBOR as Distributed by MLS Grid
- 2005-09-24 Listed $49,900 MIBOR as Distributed by MLS Grid
- 2004-12-28 Sold (MLS) $8,200 MIBOR as Distributed by MLS Grid
- 2004-10-18 Listed $9,900 MIBOR as Distributed by MLS Grid
- 2002-04-30 Listing Removed — MIBOR as Distributed by MLS Grid
- 2002-01-31 Listed $9,900 MIBOR as Distributed by MLS Grid
Property tax history
+9.7%/yrLatest (2025): $1,566 · +10.1% YoY. Source: county tax records.
Cash-flow waterfall
monthlySold comps — $/sqft
last 12 mo · ≤1 miLoading sold comps…