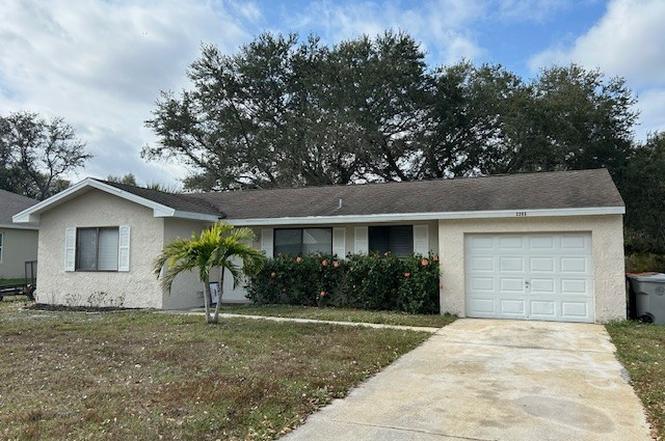
2205 17th Ave SW · Florida Ridge, FL
Flood risk 1/10 · Minimal
- FEMA flood zone
- X (unshaded)
- Chance of flooding over 30 yrs
- 0.0%
- Est. flood insurance / yr
- $507 – $1,088
Fire risk 2/10 · Minimal
- Est. fire insurance / yr
- $947 – $1,759
Heat risk 10/10 · Severe
- Hot days now (above 107°F)
- 7 days/yr
- Hot days in 30 yrs
- 24 days/yr
Wind risk 10/10 · Severe
- Chance of severe wind over 30 yrs
- 99.0%
Air-quality risk 1/10 · Minimal
- Unhealthy air days now
- 0 days/yr
- Unhealthy air days in 30 yrs
- 0 days/yr
Risk factors via First Street. Map © Google.
Why this score? — see what drove the D grade
The composite is a weighted blend of 9 inputs, each scored 0–100. Each bar is that input's sub-score; the figure is the points it added to the 100-point composite (weight × sub-score).
- Cash flow +11.7/30.0
- ARV discount +9.1/15.0
- Schools +4.2/10.0
- Livability +3.6/5.0
- Rent growth +3.5/5.0
- DSCR +3.4/10.0
- 1% rule +3.3/10.0
- Condition / age +2.5/5.0
- Appreciation +0.0/10.0
$205,000
🖨 Deal sheet 📄 Offer letter ✓ Due diligence
Listing remarks
Turnkey investment opportunity! This well-maintained home features a tenant already in place, providing immediate income. Located in a desirable Vero Beach mainland neighborhood with strong rental demand, close to shopping, schools, dining, parks, beaches, and major roadways. Ideal for long-term hold in a stable Treasure Coast market. Unique portfolio opportunity: Seller is offering 2 additional properties in very close proximity with identical floorplans, tenants in place, allowing for a potential 3-home package purchase. HOA includes 2 pools, clubhouse, pickleball, tennis and more!
Key facts
- Close to parks
- Strong rental demand
- Close to schools
Tags
Property features AI
Finance
- Financial info: Pets allowed
- HOA & community: Vero Beach Highlands POA with a $34 monthly fee; Association fee covers recreation facilities; Community amenities include basketball court, clubhouse, pickleball, tennis courts, trails/paths, and pool
Exterior
- Parking: Garage (1 car)
- Security: Smoke detector(s)
- Utilities: Public water; County sewer
- Home design: Single-story home; Frame and stucco construction; Shingle roof; West-facing; Has a view
- Construction: Frame and stucco construction; Shingle roof
- Exterior features: Patio with screened area; Community pool; Community has trails/paths
Interior
- Kitchen: Dishwasher; Range; Refrigerator; Disposal; Electric water heater
- Bedrooms: Two bedrooms (10x11 and 11x11)
- Flooring: Tile
- Bathrooms: One full bathroom
- Heating & cooling: Heat pump heating; Central air conditioning
- Interior features: Blinds; Double-hung windows; Unfurnished; Tile flooring
- Laundry & utility: Laundry area located in the garage
Neighborhood map
What this means for you Summary
Snapshot
- This is a 2-bed/1.0-bath single-family listed at $205k.
Deal economics
- At list price, monthly cash flow is $-61 ($-732/yr) — negative.
- To cash-flow at today's rent, offer at most $194k (5.3% below list).
- To meet the 1% rule (rent ≥ 1% of price), the offer needs to be $170k (16.9% below list).
- Recommended offer: $170k (16.9% below list) — sets the bar for 1% rule.
- Cap rate 5.9% vs local median 4.5% in Florida Ridge — top-decile yield for the area; either an underpriced asset or a hidden risk that comps aren't pricing in. Stress-test before assuming the spread holds.
Location & tenants
- Location reads 72/100 on livability (#353 in FL) — a middle-class / working-renter tenant base. Strengths: commute A+, cost of living A+, housing A+; Watch: schools D, employment D, amenities F.
- Indian River (other): math 48% / reading 52% proficiency, ranked #35 of 73 in FL (top 48%) — acceptable for families but not a draw, mixed tenant base, ~2y average lease.
- Market conditions: Rents rising fast (+4.2%/yr); 348 active listings in the ZIP; 1 comparable units currently listed for rent nearby; 564 units permitted in Indian River County in 2024 (281 in 5+ unit buildings).
- This rent runs 31% of the median local income ($67k/yr) — at the standard rent-burdened threshold; future hikes will face affordability resistance.
Forward outlook
- Local home prices are declining (-3.0%/yr); year-one equity from $1k of loan paydown is wiped out by about $6k of value loss. Plan a longer hold.
- Indian River County population projected at +18% by 2050 — long-run rental-demand tailwind backs the buy-and-hold thesis.
Negotiation context
- It's been on market 95 days — a 9% lower offer ($187k) is reasonable based on typical stale-listing flexibility.
- 6 sale attempts since 2y ago with the ask held roughly flat each time — persistent listings suggest the price (not the market) is what's stuck; bring a comps-based counter.
- Current owner paid $62k; list at $205k implies a 229% gain — meaningful room to come down on a strong offer.
Risks & watch-outs
- Climate carrying-cost: severe wind risk, 99% chance of damaging wind over 30y; extreme-heat days projected 7→24/yr by 2055 (HVAC capex compounding) — expect insurance premiums to compound above CPI over the hold.
Questions for the listing agent
- What do current leases actually rent for vs. the listed asking? Can we see a recent rent roll and the last 12 months of T-12 income?
- It's been on market 95 days. Have you received any prior offers? Is the seller open to a 17% concession, seller financing, or rate buy-down credit?
- What does the HOA fee cover, when was the last increase, and are there any pending special assessments or reserve-fund shortfalls?
- Why hasn't it sold? Are there any deal-killer items the seller is aware of (foundation, flood, title, zoning, code violations)?
- Is there a deadline driving the sale (1031 exchange, divorce, estate, relocation)? That informs how much negotiation room exists.
- Schools are D-rated, which usually means shorter tenancies and higher turnover. Who's the typical renter profile here, and what's been the actual vacancy rate?
- The area grade is low — what's the realistic commute time and amenity access for the typical tenant pool here? Any planned neighborhood developments (good or bad) we should know about?
- What's the average days-on-market for RENTAL listings here right now (not sales)? A rising rental-DOM trend means longer vacancies and softer asking-rent achievability than the comps imply.
- What's the recent tenant-quality profile in this submarket — average credit score on applications, eviction rate, late-payment / NSF rate, and stable-employment percentage? A property-management company in the area should have these aggregated.
- How much new for-sale + rental construction is in the pipeline within 1–3 miles? Heavy new supply typically softens prices + rents 12–24 months out; constrained supply supports both.
Investment metrics
- 1% rule
- 0.83% ✗
- Cap rate
- 5.94%
- Cash-on-cash
- -1.28%
- DSCR
- 0.94
- GRM
- 10.0
CMA / ARV
- ARV (on-the-fly)
- $212,562
- Comps found
- 11
Show comp detail 11 sales within ~0.75 mi
| Address | Dist | Beds/Ba | Sqft | Sold | Price | $/sf | Match |
|---|---|---|---|---|---|---|---|
| 2205 17th Ave SW | 0.00mi | 2/1.0 | 882 (0%) | 0mo | $171,677 | $195 | 100 |
| 2235 17th Ave SW | 0.03mi | 2/1.0 | 882 (0%) | 0mo | $171,677 | $195 | 98 |
| 2216 18th Ave SW | 0.03mi | 2/1.0 | 882 (0%) | 0mo | $171,677 | $195 | 98 |
| 2375 16th Ave SW | 0.21mi | 2/1.5 | 912 (+3%) | 2mo | $250,000 | $274 | 81 |
| 2195 19th Ave SW | 0.12mi | 2/1.0 | 900 (+2%) | 15mo | $230,000 | $256 | 78 |
| 2355 16th Ave SW | 0.18mi | 2/2.0 | 852 (-3%) | 23mo | $250,000 | $293 | 63 |
| 1676 17th Pl SW | 0.58mi | 2/2.0 | 960 (+9%) | 1mo | $195,000 | $203 | 54 |
| 1445 23rd St SW | 0.20mi | 2/2.0 | 1,000 (+13%) | 23mo | $315,000 | $315 | 45 |
| 1115 Highland Dr SW | 0.48mi | 2/2.0 | 936 (+6%) | 23mo | $282,500 | $302 | 44 |
| 1746 25th St SW | 0.32mi | 3/2.0 (+1) | 996 (+13%) | 13mo | $240,000 | $241 | 44 |
| 1620 20th Ave SW | 0.75mi | 2/2.0 | 938 (+6%) | 23mo | $203,000 | $216 | 31 |
Match score weights: distance 35% · size 25% · config 20% · recency 20%. Top-matched comps best support the ARV.
Projected returns pro-forma
-3.0% appreciation · 4.18% rent growth · sell at horizon
- IRR
- -17.1%
- Equity multiple
- 0.39×
- Total profit
- $-35,040
- Equity at exit
- $30,566
- IRR
- -7.0%
- Equity multiple
- 0.53×
- Total profit
- $-26,840
- Equity at exit
- $17,725
Cash invested: $57,400 (down + closing). Projections, not guarantees.
Landlord ↔ Tenant lean methodology
- Overall (STATE)
- 87 Strongly Landlord-Friendly
- State Florida
- 87 Strongly Landlord-Friendly · R+3
- County
- — inherits STATE
- City
- — inherits STATE
ZIP-level market 32962
- Rents YoY
- 4.2%
- Active inventory
- 348
- Price-to-rent
- 10.0×
Monthly cashflow live
- Estimated rent
- $1,703 medium interval (Pro) →
- Mortgage (P&I)
- −$1,075
- Tax from tax record
- −$212 /mo · $2,541/yr
- Insurance
- −$85
- HOA
- −$34
- Vacancy / Maint / Mgmt
- −$358
- Net cashflow
- $-61
Break-even live
UW: 25.0% down · 7.5% · 30yr · 1.5% tax · 5.0% vac · 8.0% maint · 8.0% mgmt
Financing live
Cash to close
- Down payment
- $51,250
- Closing costs
- $6,150
- Reserves months
- —
- Total cash needed
- —
Loan-product check · same deal, 3 products live
Conventional
25% down · 7.5% · 30yr
- Down + closing
- —
- Monthly P&I
- —
- Monthly cashflow
- —
- DSCR
- —
- Eligible?
- —
Personal DTI + credit; lowest rate.
DSCR
20% down · 8.5% · 30yr
- Down + closing
- —
- Monthly P&I
- —
- Monthly cashflow
- —
- DSCR
- —
- Eligible?
- —
No personal income docs; deal must DSCR.
Hard money
10% down · 12.0% · 12mo
- Down + closing
- —
- Monthly P&I
- —
- Monthly cashflow
- —
- DSCR
- —
- Eligible?
- —
Short-term bridge; refi at stabilization.
Rent comps 1 comps
| Address | Beds | Baths | Sqft | Rent | $/sqft | DOM | Units | Dist |
|---|---|---|---|---|---|---|---|---|
| 7500 Pensacola Rd Fort Pierce, FL | 3.0 | 2.0 | 1125 | $2,150 | $1.91 | 14d | 1 | 1.01mi |
HOA detail
- Monthly dues
- $34 · $408/yr
- Likely covers
- pool
Listing history 17 events
-
2026-04-30status Pending
-
2026-02-26price $205,000
-
2026-02-20price $207,000
-
2026-02-20price $20,700
-
2026-02-13price $209,900
-
2026-02-05status Active
-
2026-01-29status Pending
-
2026-01-16$214,900 Active
-
2025-12-18historical $1,700
-
2025-12-18$1,700
-
2025-11-23historical $1,700
-
2025-11-01$1,700
-
2024-09-28historical $1,700
-
2024-09-27historical $1,700
-
2024-08-03$1,700
-
2024-08-03$1,700
-
1982-08-01soldstatus $62,400
ⓘ Source: listings_history table (triggers on properties + properties_extension) + one-shot
backfill from property_details.listing_events for pre-trigger history.
Tax reassessment forecast FL · Resets to sale price
- Current annual tax
- $2,541 · $212/mo
- Projected year-2 tax
- $2,541 · $212/mo
- Expected delta
- $0/yr ($0/mo · 0.0%)
ⓘ Screening estimate from a state-policy table — verify with the county assessor before closing.
Climate risk First Street
- Flood 1/10 Low FEMA zone X (unshaded) · 0% chance over 30 yrs
- Wildfire 2/10 Low
- Heat 10/10 Extreme 7 d/yr ≥107°F today · 24 d/yr by 30 yrs out
- Wind 10/10 Extreme 99% chance of damaging wind over 30 yrs
- Air quality 1/10 Low 0 unhealthy d/yr today · 0 by 30 yrs out
Nearby sold comps map
Loading sold comps map…
Walkable amenities ~0.75 mi
Loading nearby amenities…
Taxation est. · year 1
- Rental income
- $20,434
- − Mortgage interest
- −$11,483
- − Property taxes
- −$2,541
- − Insurance
- −$1,025
- − Repairs & maintenance
- −$1,635
- − Management
- −$1,635
- − HOA
- −$408
- − Depreciation
- −$5,964
- Taxable loss
- −$4,257
- Est. tax savings @ 24.0%
- +$1,022
- After-tax cash flow
- $290/yr
For passive investors: Depreciation is non-cash, so a rental often shows a tax loss while cash-flowing — sheltering income. Rental losses are passive: they offset passive income freely, and up to $25,000/yr can offset ordinary (W-2) income if you actively participate and your MAGI is under $100k (phasing out to $0 by $150k); unused losses carry forward. On sale, claimed depreciation is recaptured at up to 25%, and gains may owe capital-gains tax (a 1031 exchange can defer both). Figures are a year-1 estimate at your 24.0% rate — not tax advice; consult a CPA.
Schools (NCES district)
- District
- Indian River
- NCES district ID
- 1200930
- Math proficiency
- 48% ▼ -9.00%
- Reading proficiency
- 52% ▼ -3.00%
- Median HH income
- $46,597
- Composite
- 42.45/100
- National rank
- #3218
- State rank
- #35 of 73 in FL
Livability — Florida Ridge
- Score
- 72/100
- State rank
- #353
- US rank
- #6129
Category grades
Schools grade is shown separately in the Schools card above.
Census & demographics
- Census place
- Florida Ridge, FL
- County
- Indian River County · 143,738 people
- City population
- 25,629
- Metro
- Sebastian-Vero Beach, FL
- Population (ZIP)
- 25,522
- Household income
- $66,664
- Rent vs Own
- Severe rent burden
- 425.0
Population outlook (Indian River County) Hauer SSP2
- Today (2025)
- 165,104 people
- By 2030
- 172,869 · +4.7%
- By 2040
- 185,640 · +12.4%
- By 2050
- 194,465 · +17.8%
- By 2075
- 211,115 · +27.9%
- By 2100
- 211,781 · +28.3%
Race, ethnicity, and origin ACS 2023
- Neighborhood character
- Predominantly White (70%)
- Race & ethnicity
- White 70% Black 13% Hispanic / Latino 12% Two or more races 5% Native American 1%
- Hispanic origin (detail)
- Mexican 1% Puerto Rican 2% Cuban 1%
- Common ancestry
- Romanian 4% Lithuanian 4% Italian 3%
- Foreign-born
- 12% · Canada, Jamaica, Dominican Republic
- Languages at home
- 85% English-only · Spanish 9% Other Indo-European 2% French/Haitian/Cajun 1%
Political lean MEDSL · Indian River
- 2024 margin
- Strong R (+27.4) · D 36.0% · R 63.4%
- 2008→2024 swing
- -12.5pp toward R · 2008: -14.8pp · 2024: -27.4pp
- All cycles
- 2024: R+27.4 2020: R+21.6 2016: R+24.5 2012: R+22.3 2008: R+14.8
Not yet ingested
- Civics
- —
Market trends
- HPI YoY
- ▼ -182.13%
- Current HPI
- 333.3274
- Rent YoY
- ▲ 4.18%
- Metro
- Sebastian-Vero Beach, FL
- State GDP YoY
- ▲ 3.28%
- F500 in state
- 36
Industry mix (Fortune 500 HQ in FL)
| Industry | F500 HQs | Revenue |
|---|---|---|
| Industrial Technology | 2 | $29B |
|
||
| Insurance | 2 | $17B |
|
||
| Retail | 1 | $60B |
|
||
| Technology Distribution | 1 | $58B |
|
||
| Homebuilding | 1 | $35B |
|
||
| Technology Manufacturing | 1 | $35B |
|
||
Price history
+228.5% since first listed17 events — show timeline
- 2026-04-30 Pending — RAIRCMLS
- 2026-02-26 Price Changed $205,000 RAIRCMLS
- 2026-02-20 Price Changed $207,000 RAIRCMLS
- 2026-02-20 Price Changed $20,700 RAIRCMLS
- 2026-02-13 Price Changed $209,900 RAIRCMLS
- 2026-02-05 Relisted — RAIRCMLS
- 2026-01-29 Pending — RAIRCMLS
- 2026-01-16 Listed $214,900 RAIRCMLS
- 2025-12-18 Rental Removed $1,700 RAIRCMLS
- 2025-12-18 Listed for Rent $1,700 RAIRCMLS
- 2025-11-23 Rental Removed $1,700 RAIRCMLS
- 2025-11-01 Listed for Rent $1,700 RAIRCMLS
- 2024-09-28 Rental Removed $1,700 RENT.
- 2024-09-27 Rental Removed $1,700 RAIRCMLS
- 2024-08-03 Listed for Rent $1,700 RAIRCMLS
- 2024-08-03 Listed for Rent $1,700 RENT.
- 1982-08-01 Sold (Public Records) $62,400 Public Records
Property tax history
+10.8%/yrLatest (2025): $2,541 · +14.1% YoY. Source: county tax records.
Cash-flow waterfall
monthlySold comps — $/sqft
last 12 mo · ≤1 miLoading sold comps…