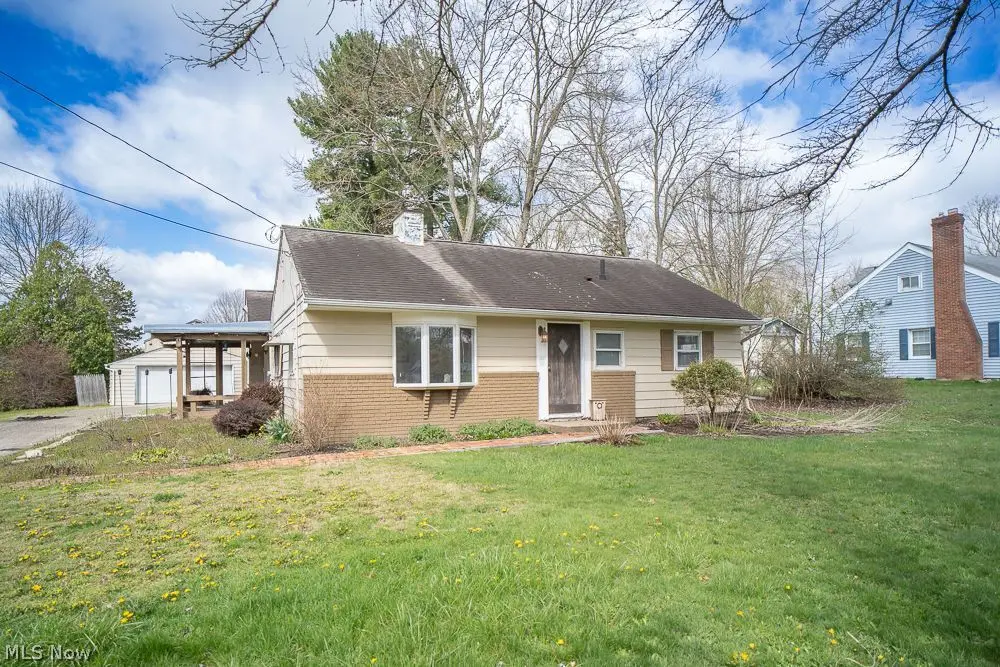
848 Schocalog Rd · Akron, OH
Flood risk 1/10 · Minimal
- FEMA flood zone
- X (unshaded)
- Chance of flooding over 30 yrs
- 0.0%
- Est. flood insurance / yr
- $507 – $1,088
Fire risk 1/10 · Minimal
- Est. fire insurance / yr
- $713 – $1,323
Heat risk 3/10 · Minor
- Hot days now (above 97°F)
- 7 days/yr
- Hot days in 30 yrs
- 17 days/yr
Wind risk 1/10 · Minimal
- Chance of severe wind over 30 yrs
- —
Air-quality risk 2/10 · Minimal
- Unhealthy air days now
- 1 days/yr
- Unhealthy air days in 30 yrs
- 2 days/yr
Risk factors via First Street. Map © Google.
Why this score? — see what drove the D+ grade
The composite is a weighted blend of 9 inputs, each scored 0–100. Each bar is that input's sub-score; the figure is the points it added to the 100-point composite (weight × sub-score).
- ARV discount +15.0/15.0
- Cash flow +11.6/30.0
- Schools +6.8/10.0
- Livability +4.0/5.0
- 1% rule +3.5/10.0
- DSCR +3.4/10.0
- Rent growth +2.9/5.0
- Condition / age +2.5/5.0
- Appreciation +0.0/10.0
$175,000
🖨 Deal sheet (PDF) 📄 Offer letter ✓ Due diligence
Listing remarks
Excellent opportunity for an investor! This home is in need of work and priced accordingly: 3 bedrooms; living room; family room with fireplace; 1.5 baths; 1+ acre lot; detached garage with 740 square foot outbuilding/workshop; Copley-Fairlawn School District.
Key facts
- Outbuilding workshop
- Detached garage
- 1.15 acre lot
Tags
Neighborhood map
What this means for you Summary
Snapshot
- This is a 3-bed/1.0-bath single-family listed at $175k.
Deal economics
- At list price, monthly cash flow is $-55 ($-656/yr) — negative.
- To cash-flow at today's rent, offer at most $165k (5.5% below list).
- To meet the 1% rule (rent ≥ 1% of price), the offer needs to be $150k (14.6% below list).
- Recommended offer: $150k (14.6% below list) — sets the bar for 1% rule.
Location & tenants
- Location reads 81/100 on livability (#104 in OH, #1,591 nationally) — a professional / high-income tenant draw. Strengths: amenities A+, commute A+, cost of living A+; Watch: crime F, employment F.
- Copley-Fairlawn City (suburban): math 77% / reading 79% proficiency, ranked #58 of 656 in OH (top 9%) — strong family-tenant draw, lease renewals of 3-5y typical; only 15% free/reduced lunch — higher-income household profile.
- Zoned schools: Fort Island Primary Elementary School (math 87% / reading 77%, grade A+, #116 of 1,584 statewide, top 9%, 376 students, 21% FRL); Copley-Fairlawn Middle School (math 76% / reading 79%, grade A+, #68 of 654 statewide, top 10%, 756 students, 16% FRL); Copley High School (math 67% / reading 76%, grade B+, #98 of 781 statewide, top 13%, 947 students, 15% FRL) — zoned schools at 17% FRL track the district average.
- Market conditions: Rents rising (+1.6%/yr); 106 active listings in the ZIP; 5 comparable units currently listed for rent nearby; rentals at typical pace (median 23d on market — plan ~3-4 weeks tenant-placement turnaround); 40% of comp listings sitting > 30 days — soft ceiling on asking rent; lower-income renter base — watch delinquency; 1,114 units permitted in Summit County in 2024 (397 in 5+ unit buildings).
- This rent runs 44% of the median local income ($41k/yr) — at the standard rent-burdened threshold; future hikes will face affordability resistance.
Forward outlook
- Local home prices are declining (-3.0%/yr); year-one equity from $1k of loan paydown is wiped out by about $5k of value loss. Plan a longer hold.
- Summit County population projected to shrink 6% by 2050 — rents likely to lag national; underwrite the cash flow, not the appreciation.
Negotiation context
- Only 4 days on market — expect competitive offers; lowballing is unlikely to land.
- 4 sale attempts since 19y ago with the ask held roughly flat each time — persistent listings suggest the price (not the market) is what's stuck; bring a comps-based counter.
- Current owner paid $138k; 27% above their basis — modest negotiation headroom, anchor on the comps not their cost.
Risks & watch-outs
- Watch-outs: built in 1950 — expect roof / HVAC / electrical / plumbing capex.
Questions for the listing agent
- What do current leases actually rent for vs. the listed asking? Can we see a recent rent roll and the last 12 months of T-12 income?
- Built in 1950 — when were the roof, HVAC, electrical panel, plumbing, and water heater last replaced?
- Is there a deadline driving the sale (1031 exchange, divorce, estate, relocation)? That informs how much negotiation room exists.
- Crime grade is F in this area — have there been break-ins, vandalism, or insurance claims at this property in the last 3 years? What carrier currently insures it and at what premium?
- The area grade is low — what's the realistic commute time and amenity access for the typical tenant pool here? Any planned neighborhood developments (good or bad) we should know about?
- What's the average days-on-market for RENTAL listings here right now (not sales)? A rising rental-DOM trend means longer vacancies and softer asking-rent achievability than the comps imply.
- What's the recent tenant-quality profile in this submarket — average credit score on applications, eviction rate, late-payment / NSF rate, and stable-employment percentage? A property-management company in the area should have these aggregated.
- How much new for-sale + rental construction is in the pipeline within 1–3 miles? Heavy new supply typically softens prices + rents 12–24 months out; constrained supply supports both.
Investment metrics
- 1% rule
- 0.85% ✗
- Cap rate
- 5.92%
- Cash-on-cash
- -1.34%
- DSCR
- 0.94
- GRM
- 9.8
CMA / ARV
- ARV (on-the-fly)
- $235,960
- Comps found
- 3
Show comp detail 3 sales within ~0.75 mi
| Address | Dist | Beds/Ba | Sqft | Sold | Price | $/sf | Match |
|---|---|---|---|---|---|---|---|
| 848 Schocalog Rd | 0.00mi | 3/1.5 | 1,388 (0%) | 0mo | $170,000 | $122 | 98 |
| 1306 N Plainview Dr | 0.72mi | 3/1.0 | 1,408 (+1%) | 2mo | $239,900 | $170 | 63 |
| 2393 Goodenough Ave | 0.69mi | 3/2.0 | 1,180 (-15%) | 1mo | $227,300 | $193 | 38 |
Match score weights: distance 35% · size 25% · config 20% · recency 20%. Top-matched comps best support the ARV.
Projected returns pro-forma
-3.0% appreciation · 1.65% rent growth · sell at horizon
- IRR
- -20.0%
- Equity multiple
- 0.31×
- Total profit
- $-33,806
- Equity at exit
- $26,093
- IRR
- -16.2%
- Equity multiple
- 0.15×
- Total profit
- $-41,770
- Equity at exit
- $15,131
Cash invested: $49,000 (down + closing). Projections, not guarantees.
Landlord ↔ Tenant lean methodology
- Overall (STATE)
- 73 Landlord-Friendly
- State Ohio
- 73 Landlord-Friendly · R+6
- County
- — inherits STATE
- City
- — inherits STATE
ZIP-level market 44320
- Rents YoY
- 1.6%
- Active inventory
- 106
- Price-to-rent
- 9.8×
Monthly cashflow live
- Estimated rent
- $1,495 high interval (Pro) →
- Mortgage (P&I)
- −$918
- Tax from tax record
- −$245 /mo · $2,945/yr
- Insurance
- −$73
- HOA
- −$0
- Vacancy / Maint / Mgmt
- −$314
- Net cashflow
- $-55
Break-even live
Sensitivity live
| Price | -10% $44 | -5% $-5 | +0% $-55 | +5% $-104 | +10% $-154 |
|---|---|---|---|---|---|
| Rent | -10% $-173 | -5% $-114 | +0% $-55 | +5% $4 | +10% $63 |
| Rate | -1.0pp $33 | -0.5pp $-10 | base $-55 | +0.5pp $-100 | +1.0pp $-146 |
UW: 25.0% down · 7.5% · 30yr · 1.5% tax · 5.0% vac · 8.0% maint · 8.0% mgmt
Financing live
Cash to close
- Down payment
- $43,750
- Closing costs
- $5,250
- Reserves months
- —
- Total cash needed
- —
Loan-product check · same deal, 3 products live
Conventional
25% down · 7.5% · 30yr
- Down + closing
- —
- Monthly P&I
- —
- Monthly cashflow
- —
- DSCR
- —
- Eligible?
- —
Personal DTI + credit; lowest rate.
DSCR
20% down · 8.5% · 30yr
- Down + closing
- —
- Monthly P&I
- —
- Monthly cashflow
- —
- DSCR
- —
- Eligible?
- —
No personal income docs; deal must DSCR.
Hard money
10% down · 12.0% · 12mo
- Down + closing
- —
- Monthly P&I
- —
- Monthly cashflow
- —
- DSCR
- —
- Eligible?
- —
Short-term bridge; refi at stabilization.
Rent comps 5 comps
| Address | Beds | Baths | Sqft | Rent | $/sqft | DOM | Units | Dist |
|---|---|---|---|---|---|---|---|---|
| 1335 Vale Dr Akron, OH | 2.0–3.0 | 1.5–2.0 | 1100 | $1,600 | $1.45 | 45d | 1 | 0.65mi |
| 915 Mull Ave Akron, OH | 2.0 | 1.0–2.0 | 662 | $1,110 | $1.68 | 14d | 1 | 1.12mi |
| 1859 Delia Ave Akron, OH | 3.0 | 1.0 | 1040 | $1,395 | $1.34 | 23d | 1 | 1.24mi |
| 1000 Spring Hill DR Akron, OH | 1.0–3.0 | 1.0–2.5 | 1100 | $2,099 | $1.91 | 12d | 1 | 1.42mi |
| 59 S Pershing Ave Akron, OH | 2.0 | 1.0 | 1579 | $1,350 | $0.85 | 45d | 1 | 1.48mi |
Listing history 10 events
-
2026-04-24status Pending
-
2026-04-20$175,000 Active
-
2012-08-22historical
-
2012-06-27$124,900
-
2012-01-16historical
-
2011-08-10$129,000
-
2007-08-09soldstatus $138,000
-
2007-08-09soldstatus $138,000
-
2007-07-02$141,900
-
1984-10-24soldstatus $52,000
ⓘ Source: listings_history table (triggers on properties + properties_extension) + one-shot
backfill from property_details.listing_events for pre-trigger history.
Tax reassessment forecast OH · Partial reset (capped growth)
- Current annual tax
- $2,945 · $245/mo
- Projected year-2 tax
- $2,945 · $245/mo
- Expected delta
- $0/yr ($0/mo · 0.0%)
ⓘ Screening estimate from a state-policy table — verify with the county assessor before closing.
Climate risk First Street
- Flood 1/10 Low FEMA zone X (unshaded) · 0% chance over 30 yrs
- Wildfire 1/10 Low
- Heat 3/10 Moderate 7 d/yr ≥97°F today · 17 d/yr by 30 yrs out
- Wind 1/10 Low
- Air quality 2/10 Low 1 unhealthy d/yr today · 2 by 30 yrs out
Nearby sold comps map
Loading sold comps map…
Walkable amenities ~0.75 mi
Loading nearby amenities…
Taxation est. · year 1
- Rental income
- $17,944
- − Mortgage interest
- −$9,803
- − Property taxes
- −$2,945
- − Insurance
- −$875
- − Repairs & maintenance
- −$1,436
- − Management
- −$1,436
- − Depreciation
- −$5,091
- Taxable loss
- −$3,640
- Est. tax savings @ 24.0%
- +$874
- After-tax cash flow
- $217/yr
For passive investors: Depreciation is non-cash, so a rental often shows a tax loss while cash-flowing — sheltering income. Rental losses are passive: they offset passive income freely, and up to $25,000/yr can offset ordinary (W-2) income if you actively participate and your MAGI is under $100k (phasing out to $0 by $150k); unused losses carry forward. On sale, claimed depreciation is recaptured at up to 25%, and gains may owe capital-gains tax (a 1031 exchange can defer both). Figures are a year-1 estimate at your 24.0% rate — not tax advice; consult a CPA.
Schools (NCES district)
- District
- Copley-Fairlawn City
- NCES district ID
- 3904998
- Math proficiency
- 77% ▼ -6.00%
- Reading proficiency
- 79% ▼ -5.00%
- Median HH income
- $66,228
- Composite
- 67.55/100
- National rank
- #370
- State rank
- #58 of 656 in OH
Livability — Akron
- Score
- 81/100
- State rank
- #104
- US rank
- #1591
Category grades
Schools grade is shown separately in the Schools card above.
Census & demographics
- County
- Summit County · 440,783 people
- City population
- 174,375
- Metro
- Akron, OH
- Population (ZIP)
- 17,690
- Household income
- $41,241
- Rent vs Own
- Severe rent burden
- 1316.0
Population outlook (Summit County) Hauer SSP2
- Today (2025)
- 546,583 people
- By 2030
- 544,028 · -0.5%
- By 2040
- 531,363 · -2.8%
- By 2050
- 514,923 · -5.8%
- By 2075
- 481,765 · -11.9%
- By 2100
- 432,265 · -20.9%
Race, ethnicity, and origin ACS 2023
- Neighborhood character
- Majority Black (63%)
- Race & ethnicity
- Black 63% White 27% Two or more races 7% Hispanic / Latino 4%
- Common ancestry
- Romanian 2% Italian 1% Scotch-Irish 1%
- Foreign-born
- 2% · Canada
- Languages at home
- 97% English-only · Spanish 1% Other Indo-European 1%
Political lean MEDSL · Summit
- 2024 margin
- Lean D (+7.0) · D 53.0% · R 46.0%
- 2008→2024 swing
- -9.6pp toward R · 2008: 16.6pp · 2024: 7.0pp
- All cycles
- 2024: D+7.0 2020: D+9.6 2016: D+8.2 2012: D+14.8 2008: D+16.6
Not yet ingested
- Civics
- —
Market trends
- HPI YoY
- ▼ -117.69%
- Current HPI
- 122.9888
- Rent YoY
- ▲ 1.65%
- Metro
- Akron, OH
- State GDP YoY
- ▲ 1.98%
- F500 in state
- 48
Industry mix (Fortune 500 HQ in OH)
| Industry | F500 HQs | Revenue |
|---|---|---|
| Insurance | 3 | $145B |
|
||
| Industrial Machinery | 3 | $49B |
|
||
| Financial Services | 3 | $24B |
|
||
| Consumer Goods | 2 | $93B |
|
||
| Aerospace / Defense | 2 | $47B |
|
||
| Utilities | 2 | $33B |
|
||
Price history
+236.5% since first listed10 events — show timeline
- 2026-04-24 Pending — MLSNOW
- 2026-04-20 Listed $175,000 MLSNOW
- 2012-08-22 Listing Removed — MLSNOW
- 2012-06-27 Listed $124,900 MLSNOW
- 2012-01-16 Listing Removed — MLSNOW
- 2011-08-10 Listed $129,000 MLSNOW
- 2007-08-09 Sold (Public Records) $138,000 Public Records
- 2007-08-09 Sold (MLS) $138,000 MLSNOW
- 2007-07-02 Listed $141,900 MLSNOW
- 1984-10-24 Sold (Public Records) $52,000 Public Records
Property tax history
+1.7%/yrLatest (2025): $2,945 · +0.6% YoY. Source: county tax records.
Cash-flow waterfall
monthlySold comps — $/sqft
last 12 mo · ≤1 miLoading sold comps…