22899 Byron Rd #53 · Crestline, CA
Flood risk 4/10 · Minor
- FEMA flood zone
- A
- Chance of flooding over 30 yrs
- 0.21%
- Est. flood insurance / yr
- $1,009 – $1,996
Fire risk 8/10 · Major
- Est. fire insurance / yr
- $659 – $1,223
Heat risk 4/10 · Minor
- Hot days now (above 89°F)
- 3 days/yr
- Hot days in 30 yrs
- 8 days/yr
Wind risk 1/10 · Minimal
- Chance of severe wind over 30 yrs
- —
Air-quality risk 10/10 · Severe
- Unhealthy air days now
- 31 days/yr
- Unhealthy air days in 30 yrs
- 41 days/yr
Risk factors via First Street. Map © Google.
Why this score? — see what drove the B- grade
The composite is a weighted blend of 9 inputs, each scored 0–100. Each bar is that input's sub-score; the figure is the points it added to the 100-point composite (weight × sub-score).
- Cash flow +28.2/30.0
- DSCR +10.0/10.0
- 1% rule +7.8/10.0
- ARV discount +7.5/15.0
- Condition / age +4.0/5.0
- Rent growth +3.7/5.0
- Livability +2.8/5.0
- Schools +2.1/10.0
- Appreciation +0.0/10.0
$166,900
🖨 Deal sheet 📄 Offer letter ✓ Due diligence
Listing remarks
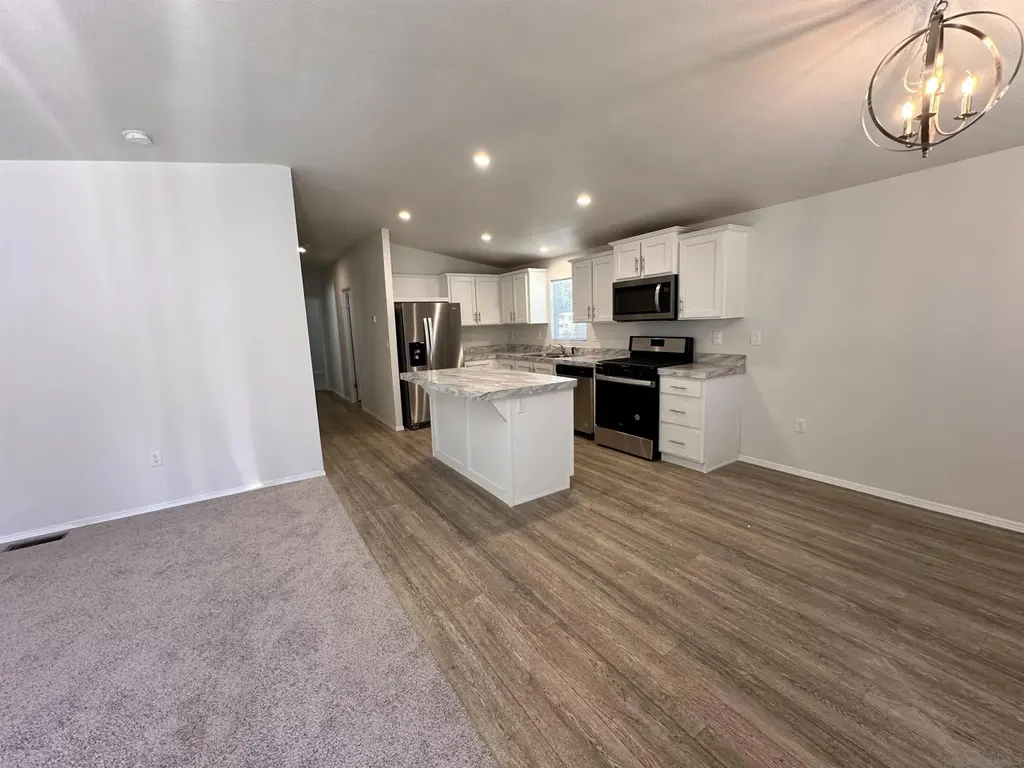
Discover mountain living at its finest in this beautiful BRAND NEW 3-bedroom, 2-bath home located in the highly sought-after Valley of Enchantment family park! Built with durable 2x4 construction and a 60 lb. snow-load roof, this home offers exceptional quality, comfort, and peace of mind. Inside, enjoy a bright open-concept layout, stylish vinyl flooring, cozy carpeted bedrooms, brand-new appliances, and a spacious primary suite with a large walk-in closet. Perfect for families or first-time buyers looking for modern living at an incredible value. Space rent is just $1,049/month. Chattel Loan financing available for qualified buyers.
Key facts
- 2 parking spots
- Built 2023
- Listed 19 days
Property features AI
Finance
- Other: Located in the Crestline subdivision
- HOA & community: Pets allowed with breed restrictions; Community: Valley of Enchantment
Exterior
- Parking: 2 parking spaces
- Utilities: Sewer connected
- Home design: Manufactured home; Single-story
- Construction: Cement siding
- Exterior features: Composition roof
Interior
- Kitchen: Disposal
- Bedrooms: Up to 3 bedrooms
- Bathrooms: 2 full bathrooms
- Heating & cooling: Forced-air heating; Natural gas heating
- Interior features: Kitchen has a disposal
Neighborhood map
What this means for you Summary
Snapshot
- This is a 3-bed/2.0-bath manufactured listed at $167k. Condition is rated good.
Deal economics
- At list price, monthly cash flow is $403 ($5k/yr) — positive.
- The deal already cash-flows at list — no discount required.
- Meets the 1% rule at list price ($2k rent vs $167k).
- Recommended offer: $164k (1.5% below list) — sets the bar for market timing.
- Cap rate 10.1% vs local median 3.9% in Crestline — top-decile yield for the area; either an underpriced asset or a hidden risk that comps aren't pricing in. Stress-test before assuming the spread holds.
Location & tenants
- Location reads 56/100 on livability (#805 in CA) — a working-class tenant base; expect higher turnover. Strengths: housing A+; Watch: commute D, schools D-, crime F.
- Rim Of The World Unified (town): math 13% / reading 34% proficiency, ranked #415 of 517 in CA (top 80%) — low school quality limits family demand, transient renter base, plan for 1-2y turnover.
- Market conditions: Rents rising fast (+4.7%/yr); 252 active listings in the ZIP; 6 comparable units currently listed for rent nearby; rentals at typical pace (median 18d on market — plan ~3-4 weeks tenant-placement turnaround); 5,458 units permitted in San Bernardino County in 2024 (1,500 in 5+ unit buildings).
- This rent runs 36% of the median local income ($71k/yr) — at the standard rent-burdened threshold; future hikes will face affordability resistance.
Forward outlook
- Local home prices are declining (-3.0%/yr); year-one equity from $1k of loan paydown is wiped out by about $5k of value loss. Plan a longer hold.
- San Bernardino County population projected at +15% by 2050 — modest demand growth; plan on rents tracking national, not racing it.
- At projected returns (-3.0% appreciation + 4.7% rent growth), your $47k cash investment doubles in ~9 years — after that, you're playing with house money.
Negotiation context
- It's been on market 20 days — a 2% lower offer ($164k) is reasonable based on typical stale-listing flexibility.
- 3 sale attempts since 3y ago with the ask held roughly flat each time — persistent listings suggest the price (not the market) is what's stuck; bring a comps-based counter.
Risks & watch-outs
- Watch-outs: flood insurance adds $125/mo.
- Climate carrying-cost: in FEMA flood zone A (mandatory federal flood insurance); severe wildfire risk — expect insurance premiums to compound above CPI over the hold.
Questions for the listing agent
- What's the actual annual flood-insurance premium (NFIP or private), and is the property in a SFHA with mandatory coverage?
- Is there a deadline driving the sale (1031 exchange, divorce, estate, relocation)? That informs how much negotiation room exists.
- Schools are D-rated, which usually means shorter tenancies and higher turnover. Who's the typical renter profile here, and what's been the actual vacancy rate?
- Crime grade is F in this area — have there been break-ins, vandalism, or insurance claims at this property in the last 3 years? What carrier currently insures it and at what premium?
- What's the average days-on-market for RENTAL listings here right now (not sales)? A rising rental-DOM trend means longer vacancies and softer asking-rent achievability than the comps imply.
- What's the recent tenant-quality profile in this submarket — average credit score on applications, eviction rate, late-payment / NSF rate, and stable-employment percentage? A property-management company in the area should have these aggregated.
- How much new for-sale + rental construction is in the pipeline within 1–3 miles? Heavy new supply typically softens prices + rents 12–24 months out; constrained supply supports both.
Investment metrics
- 1% rule
- 1.28% ✓
- Cap rate
- 10.09%
- Cash-on-cash
- 13.55%
- DSCR
- 1.60
- GRM
- 6.5
CMA / ARV
- ARV (on-the-fly)
- $90,048
- Comps found
- 3
Show comp detail 3 sales within ~0.75 mi
| Address | Dist | Beds/Ba | Sqft | Sold | Price | $/sf | Match |
|---|---|---|---|---|---|---|---|
| 22899 BYRON Rd #58 | 0.00mi | 3/2.0 | 1,440 (+7%) | 9mo | $129,000 | $90 | 80 |
| 22899 Byron Rd #41 | 0.18mi | 3/2.0 | 1,440 (+7%) | 2mo | $44,000 | $31 | 78 |
| 22899 Byron Rd #65 | 0.18mi | 2/2.0 (-1) | 1,344 (0%) | 21mo | $90,000 | $67 | 69 |
Match score weights: distance 35% · size 25% · config 20% · recency 20%. Top-matched comps best support the ARV.
Projected returns pro-forma
-3.0% appreciation · 4.65% rent growth · sell at horizon
- IRR
- 1.3%
- Equity multiple
- 1.05×
- Total profit
- $2,293
- Equity at exit
- $24,885
- IRR
- 12.6%
- Equity multiple
- 2.08×
- Total profit
- $50,693
- Equity at exit
- $14,430
Cash invested: $46,732 (down + closing). Projections, not guarantees.
Landlord ↔ Tenant lean methodology
- Overall (STATE)
- 18 Strongly Tenant-Friendly
- State California
- 18 Strongly Tenant-Friendly · D+13
- County
- — inherits STATE
- City
- — inherits STATE
ZIP-level market 92325
- Rents YoY
- 4.7%
- Active inventory
- 252
- Price-to-rent
- 6.5×
Monthly cashflow live
- Estimated rent
- $2,128 high interval (Pro) →
- Mortgage (P&I)
- −$875
- Tax est. 1.5%
- −$209 /mo · $2,504/yr
- Insurance
- −$70
- Flood insurance flood zone
- −$125 /mo · $1,502/yr
- HOA
- −$0
- Vacancy / Maint / Mgmt
- −$447
- Net cashflow
- $403
Break-even live
UW: 25.0% down · 7.5% · 30yr · 1.5% tax · 5.0% vac · 8.0% maint · 8.0% mgmt
Financing live
Cash to close
- Down payment
- $41,725
- Closing costs
- $5,007
- Reserves months
- —
- Total cash needed
- —
Loan-product check · same deal, 3 products live
Conventional
25% down · 7.5% · 30yr
- Down + closing
- —
- Monthly P&I
- —
- Monthly cashflow
- —
- DSCR
- —
- Eligible?
- —
Personal DTI + credit; lowest rate.
DSCR
20% down · 8.5% · 30yr
- Down + closing
- —
- Monthly P&I
- —
- Monthly cashflow
- —
- DSCR
- —
- Eligible?
- —
No personal income docs; deal must DSCR.
Hard money
10% down · 12.0% · 12mo
- Down + closing
- —
- Monthly P&I
- —
- Monthly cashflow
- —
- DSCR
- —
- Eligible?
- —
Short-term bridge; refi at stabilization.
Rent comps 6 comps
| Address | Beds | Baths | Sqft | Rent | $/sqft | DOM | Units | Dist |
|---|---|---|---|---|---|---|---|---|
| 22858 Lupin Ln Cedarpines Park, CA | 3.0 | 2.0 | 1176 | $2,000 | $1.70 | 2d | 1 | 0.20mi |
| 767 Woodland Rd Unit 1 Crestline, CA | 2.0 | 1.0 | 1100 | $1,700 | $1.55 | 2d | 1 | 0.87mi |
| 794 Woodland Rd Crestline, CA | 3.0 | 2.0 | 1372 | $1,400 | $1.02 | 17d | 1 | 0.95mi |
| 21510 Crest Forest Dr Cedarpines Park, CA | 3.0 | 2.5 | 1824 | $2,350 | $1.29 | 2d | 1 | 1.18mi |
| 23855 Zuger Dr Unit B Crestline, CA | 3.0 | 1.0 | 1300 | $1,995 | $1.53 | 19d | 1 | 1.24mi |
| 23882 Springwater Rd Crestline, CA | 3.0 | 1.0 | 1133 | $2,500 | $2.21 | 19d | 1 | 1.29mi |
Listing history 15 events
-
2026-06-18days on market $166,900 Active 20 DOM
-
2026-06-17days on market $166,900 Active 19 DOM
-
2026-06-16days on market $166,900 Active 18 DOM
-
2026-06-15days on market $166,900 Active 17 DOM
-
2026-06-13days on market $166,900 Active 15 DOM
-
2026-06-13days on market $166,900 Active 14 DOM
-
2026-06-09days on market $166,900 Active 11 DOM
-
2026-06-08days on market $166,900 Active 10 DOM
-
2026-06-07days on market $166,900 Active 9 DOM
-
2026-06-04days on market $166,900 Active 6 DOM
-
2026-06-03days on market $166,900 Active 5 DOM
-
2026-06-02days on market $166,900 Active 4 DOM
-
2026-06-02remarks 642-char remark
-
2026-06-01days on market $166,900 Active 3 DOM
-
2026-05-31days on market $166,900 Active 2 DOM
ⓘ Source: listings_history table (triggers on properties + properties_extension) + one-shot
backfill from property_details.listing_events for pre-trigger history.
Climate risk First Street
- Flood 4/10 Moderate FEMA zone A · 21% chance over 30 yrs
- Wildfire 8/10 Severe
- Heat 4/10 Moderate 3 d/yr ≥89°F today · 8 d/yr by 30 yrs out
- Wind 1/10 Low
- Air quality 10/10 Extreme 31 unhealthy d/yr today · 41 by 30 yrs out
Nearby sold comps map
Loading sold comps map…
Walkable amenities ~0.75 mi
Loading nearby amenities…
Taxation est. · year 1
- Rental income
- $25,537
- − Mortgage interest
- −$9,349
- − Property taxes
- −$2,504
- − Insurance
- −$2,337
- − Repairs & maintenance
- −$2,043
- − Management
- −$2,043
- − Depreciation
- −$4,855
- Taxable income
- $2,406
- Est. tax owed @ 24.0%
- −$577
- After-tax cash flow
- $4,253/yr
For passive investors: Depreciation is non-cash, so a rental often shows a tax loss while cash-flowing — sheltering income. Rental losses are passive: they offset passive income freely, and up to $25,000/yr can offset ordinary (W-2) income if you actively participate and your MAGI is under $100k (phasing out to $0 by $150k); unused losses carry forward. On sale, claimed depreciation is recaptured at up to 25%, and gains may owe capital-gains tax (a 1031 exchange can defer both). Figures are a year-1 estimate at your 24.0% rate — not tax advice; consult a CPA.
Condition & rehab AI · 5 photos
This beautiful, brand-new 3-bedroom, 2-bath home in Crestline, CA, offers a modern and comfortable living space with a spacious primary suite and a bright open-concept layout. The home is move-in ready with minimal maintenance required.
Value-add opportunities
- Both Paint the exterior siding — Enhances curb appeal and adds value for both resale and rental
- Both Install a smart thermostat — Improves energy efficiency and adds a modern touch
- Both Add a smart lock — Enhances security and adds a modern touch
Renovation cost estimate screening
Value-add ROI direction
- Both Paint the exterior siding — Enhances curb appeal and adds value for both resale and rental ↑
- Both Install a smart thermostat — Improves energy efficiency and adds a modern touch ↑
- Both Add a smart lock — Enhances security and adds a modern touch ↑
ⓘ Cost ranges are severity-bucket heuristics (US national rule-of-thumb). Get contractor quotes + a written scope before underwriting a rehab budget.
Schools (NCES district)
- District
- Rim Of The World Unified
- NCES district ID
- 0632610
- Math proficiency
- 13% ▼ -10.00%
- Reading proficiency
- 34% ▼ -7.00%
- Median HH income
- $55,860
- Composite
- 21.29/100
- National rank
- #8389
- State rank
- #415 of 517 in CA
Livability — Crestline
- Score
- 56/100
- State rank
- #805
- US rank
- #22821
Category grades
Schools grade is shown separately in the Schools card above.
Census & demographics
- Census place
- Crestline, CA
- County
- San Bernardino County · 2,030,291 people
- City population
- 9,065
- Metro
- Riverside-San Bernardino-Ontario, CA
- Population (ZIP)
- 9,065
- Household income
- $70,563
- Rent vs Own
- Severe rent burden
- 179.0
Population outlook (San Bernardino County) Hauer SSP2
- Today (2025)
- 2,300,329 people
- By 2030
- 2,378,907 · +3.4%
- By 2040
- 2,523,137 · +9.7%
- By 2050
- 2,642,388 · +14.9%
- By 2075
- 2,880,769 · +25.2%
- By 2100
- 2,909,436 · +26.5%
Race, ethnicity, and origin ACS 2023
- Neighborhood character
- Predominantly White (68%)
- Race & ethnicity
- White 68% Hispanic / Latino 25% Two or more races 20% Black 2%
- Hispanic origin (detail)
- Mexican 21%
- Common ancestry
- Romanian 5% Slovak 5% Lithuanian 4%
- Foreign-born
- 9% · Canada
- Languages at home
- 85% English-only · Spanish 12% Russian/Polish/Slavic 3% German/W. Germanic 1%
Political lean MEDSL · San Bernardino
- 2024 margin
- Toss-up / Even · D 47.5% · R 49.7% · Other 2.8%
- 2008→2024 swing
- -8.5pp toward R · 2008: 6.3pp · 2024: -2.1pp
- All cycles
- 2024: R+2.1 2020: D+10.7 2016: D+9.8 2012: D+5.4 2008: D+6.3
Not yet ingested
- Civics
- —
Market trends
- HPI YoY
- ▼ -255.88%
- Current HPI
- 352.6512
- Rent YoY
- ▲ 4.65%
- Metro
- Riverside-San Bernardino-Ontario, CA
- State GDP YoY
- ▲ 3.21%
- F500 in state
- 116
Industry mix (Fortune 500 HQ in CA)
| Industry | F500 HQs | Revenue |
|---|---|---|
| Technology | 27 | $1,492B |
|
||
| Financial Services | 3 | $174B |
|
||
| Retail | 3 | $44B |
|
||
| Insurance | 3 | $26B |
|
||
| Media / Entertainment | 2 | $115B |
|
||
| Pharmaceuticals / Biotech | 2 | $62B |
|
||
Price history
-20.5% since first listed8 events — show timeline
- 2026-05-29 Listed $166,900 SDMLS
- 2025-10-09 Listing Removed — SDMLS
- 2025-09-12 Price Changed $189,900 SDMLS
- 2025-02-17 Listed $199,900 SDMLS
- 2025-01-08 Listing Removed — SDMLS
- 2024-10-04 Price Changed $199,900 SDMLS
- 2023-10-24 Price Changed $204,900 SDMLS
- 2023-10-18 Listed $209,900 SDMLS
Cash-flow waterfall
monthlySold comps — $/sqft
last 12 mo · ≤1 miLoading sold comps…