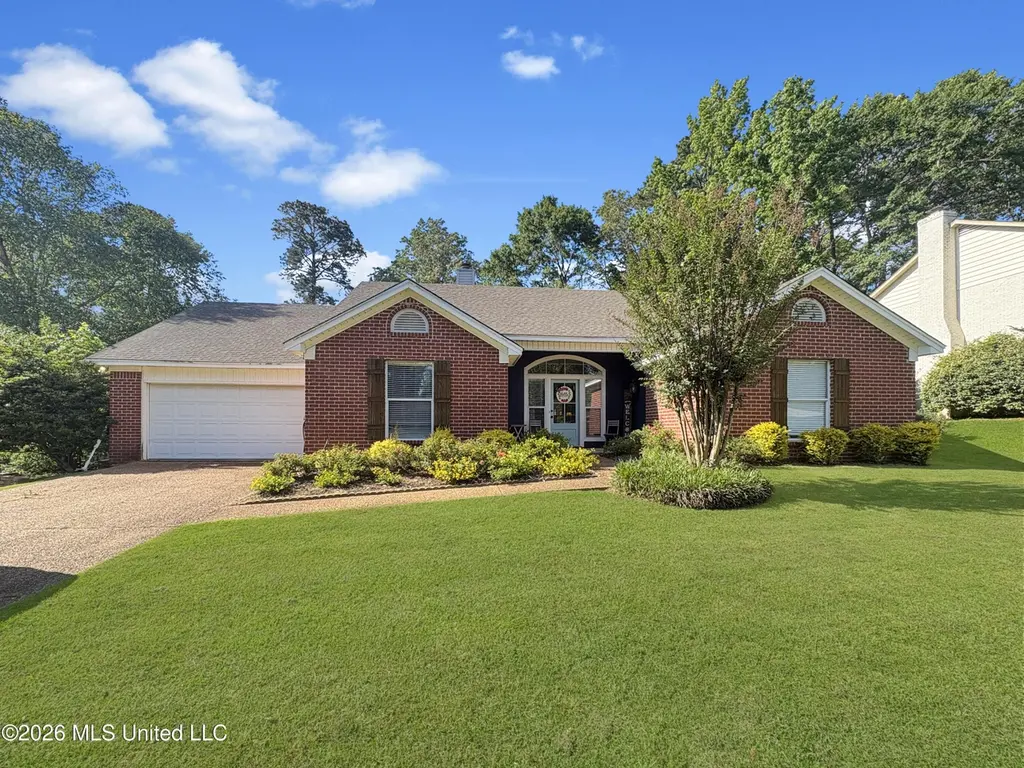
113 Twin Oaks Dr · Flowood, MS
Flood risk 1/10 · Minimal
- FEMA flood zone
- X (unshaded)
- Chance of flooding over 30 yrs
- 0.0%
- Est. flood insurance / yr
- $507 – $1,088
Fire risk 3/10 · Minor
- Est. fire insurance / yr
- $1,241 – $2,305
Heat risk 7/10 · Major
- Hot days now (above 108°F)
- 7 days/yr
- Hot days in 30 yrs
- 20 days/yr
Wind risk 8/10 · Major
- Chance of severe wind over 30 yrs
- 80.0%
Air-quality risk 2/10 · Minimal
- Unhealthy air days now
- 1 days/yr
- Unhealthy air days in 30 yrs
- 1 days/yr
Risk factors via First Street. Map © Google.
Why this score? — see what drove the D- grade
The composite is a weighted blend of 9 inputs, each scored 0–100. Each bar is that input's sub-score; the figure is the points it added to the 100-point composite (weight × sub-score).
- Cash flow +11.0/30.0
- ARV discount +8.0/15.0
- Schools +4.6/10.0
- Livability +3.9/5.0
- DSCR +3.2/10.0
- Rent growth +3.2/5.0
- Condition / age +2.5/5.0
- 1% rule +2.3/10.0
- Appreciation +0.0/10.0
$324,900
🖨 Deal sheet (PDF) 📄 Offer letter ✓ Due diligence
Listing remarks MLS
This home was bought by an investor as a foreclosure. This home will not go FHA due to flipping rules. The home seems to be in good condition just needs some updates. The seller has just put a new roof on the property within the last 30 days. This home has a great floor-plan. There are 4 bedrooms and 2 1/2 baths. This home is on a semi open, split plan. There is a beautiful formal dining room. The living room and hall way has beautiful hardwood floors. The master bath features a whirlpool tub, double vanities, and a separate shower. The master closet is HUGE! This home has tons of potential. If this home does not sell in the 1st 60 days on the market the owner is going to do updates such as granite, some new floors, and fixtures and raise the price to $214,000. Please call your agent today to get in to see this Diamond in the rough!!
Key facts
- Private master suite
- Designated dog run
- Split floor plan
Tags
Property features AI
Finance
- Other: Property address: 113 Twin Oaks Dr, Brandon, MS 39047
- Financial info: Not applicable
- HOA & community: Homeowners association with annual fee of $200 covering grounds maintenance and management; Community pool
Exterior
- Parking: Attached 2-car garage with garage door opener and concrete driveway
- Security: Smoke detector(s)
- Utilities: Public water; Public sewer; Electricity connected; Natural gas connected; Cable connected
- Home design: Single-family residence (house); One level
- Construction: Brick construction; Architectural shingle roof; Slab foundation; Built year source: assessor
- Exterior features: Deck; Patio; Dog run; Private yard; Rain gutters; Partial wood fencing; Subdivided lot
Interior
- Kitchen: Dishwasher; Disposal; Electric cooktop; Oven; Microwave; Electric water heater
- Bedrooms: Not specified
- Flooring: Ceramic tile; Laminate; Wood
- Bathrooms: 2 full bathrooms; 1 half bathroom (2.5 total)
- Heating & cooling: Central heating (natural gas); Fireplace heating; Central air conditioning; Ceiling fan(s)
- Interior features: Double vanity in bathrooms; High ceilings; Soaking tub; Walk-in closet(s); Insulated windows; Living room fireplace
- Laundry & utility: Washer/dryer hookups not specified
Neighborhood map
What this means for you Summary
Snapshot
- This is a 4-bed/2.0-bath single-family listed at $325k.
Deal economics
- At list price, monthly cash flow is $-139 ($-2k/yr) — negative.
- To cash-flow at today's rent, offer at most $300k (7.5% below list).
- To meet the 1% rule (rent ≥ 1% of price), the offer needs to be $237k (27.1% below list).
- Recommended offer: $237k (27.1% below list) — sets the bar for 1% rule.
- Cap rate 5.8% vs local median 4.3% in Flowood — top-decile yield for the area; either an underpriced asset or a hidden risk that comps aren't pricing in. Stress-test before assuming the spread holds.
Location & tenants
- Location reads 77/100 on livability (#10 in MS, #3,075 nationally) — a middle-class / working-renter tenant base. Strengths: crime A+, cost of living A+, housing A+; Watch: amenities F, commute F.
- Rankin County School District (rural): math 56% / reading 48% proficiency, ranked #6 of 130 in MS (top 5%) — acceptable for families but not a draw, mixed tenant base, ~2y average lease.
- Zoned schools: Highland Bluff Elementary (math 52% / reading 50%, grade C-, #58 of 375 statewide, top 15%, 577 students, 100% FRL); Northwest Rankin Middle School (math 63% / reading 51%, grade B, #13 of 179 statewide, top 7%, 1,374 students, 100% FRL); Northwest Rankin High School (math 48% / reading 42%, grade D-, #34 of 197 statewide, top 17%, 1,898 students, 100% FRL) — zoned schools average 100% FRL vs 35% district-wide (65 pts higher); higher-poverty schools than district average — tighter screening recommended.
- Market conditions: Rents rising (+2.9%/yr); 433 active listings in the ZIP; 4 comparable units currently listed for rent nearby; rentals lingering (median 45d on market — plan ~5-8 weeks vacancy on turnover, expect pricing pressure); 50% of comp listings sitting > 30 days — soft ceiling on asking rent; solid renter incomes; 343 units permitted in Rankin County in 2024 (0 in 5+ unit buildings).
Forward outlook
- Local home prices are declining (-3.0%/yr); year-one equity from $2k of loan paydown is wiped out by about $10k of value loss. Plan a longer hold.
- Rankin County population projected at +17% by 2050 — long-run rental-demand tailwind backs the buy-and-hold thesis.
Negotiation context
- It's been on market 44 days — a 3% lower offer ($315k) is reasonable based on typical stale-listing flexibility.
- 2 sale attempts since 11y ago with the ask held roughly flat each time — persistent listings suggest the price (not the market) is what's stuck; bring a comps-based counter.
Risks & watch-outs
- Climate carrying-cost: severe wind risk, 80% chance of damaging wind over 30y; extreme-heat days projected 7→20/yr by 2055 (HVAC capex compounding) — expect insurance premiums to compound above CPI over the hold.
Questions for the listing agent
- What do current leases actually rent for vs. the listed asking? Can we see a recent rent roll and the last 12 months of T-12 income?
- It's been on market 44 days. Have you received any prior offers? Is the seller open to a 27% concession, seller financing, or rate buy-down credit?
- What does the HOA fee cover, when was the last increase, and are there any pending special assessments or reserve-fund shortfalls?
- Is there a deadline driving the sale (1031 exchange, divorce, estate, relocation)? That informs how much negotiation room exists.
- Schools are B-rated — typically a magnet for longer-tenancy family renters. What's the average tenant stay here, and is there a school-zone premium baked into asking?
- The area grade is low — what's the realistic commute time and amenity access for the typical tenant pool here? Any planned neighborhood developments (good or bad) we should know about?
- What's the average days-on-market for RENTAL listings here right now (not sales)? A rising rental-DOM trend means longer vacancies and softer asking-rent achievability than the comps imply.
- What's the recent tenant-quality profile in this submarket — average credit score on applications, eviction rate, late-payment / NSF rate, and stable-employment percentage? A property-management company in the area should have these aggregated.
- How much new for-sale + rental construction is in the pipeline within 1–3 miles? Heavy new supply typically softens prices + rents 12–24 months out; constrained supply supports both.
Investment metrics
- 1% rule
- 0.73% ✗
- Cap rate
- 5.78%
- Cash-on-cash
- -1.83%
- DSCR
- 0.92
- GRM
- 11.4
CMA / ARV
- ARV (median comp)
- $328,571
- List price
- $324,900
- Delta
- -1.12%
- Verdict
- FAIR
- Comps
- 20 within 1.0 mi
Show comp detail 12 sales within ~0.75 mi
| Address | Dist | Beds/Ba | Sqft | Sold | Price | $/sf | Match |
|---|---|---|---|---|---|---|---|
| 114 Westlake Dr | 0.19mi | 4/2.0 | 2,335 (+2%) | 6mo | $310,000 | $133 | 82 |
| 563 Eastside Cv | 0.30mi | 4/3.0 | 2,333 (+2%) | 1mo | $379,900 | $163 | 77 |
| 233 Greenfield Pl | 0.30mi | 4/2.0 | 2,387 (+5%) | 2mo | $299,000 | $125 | 76 |
| 324 Millcreek Dr | 0.34mi | 3/2.0 (-1) | 2,251 (-1%) | 3mo | $329,900 | $147 | 75 |
| 508 Springhill Xing | 0.41mi | 4/3.0 | 2,233 (-2%) | 0mo | $369,900 | $166 | 73 |
| 334 Gladeview Pl | 0.53mi | 4/2.0 | 2,290 (+0%) | 6mo | $375,000 | $164 | 70 |
| 225 Hidden Hills Pkwy | 0.52mi | 4/3.0 | 2,317 (+2%) | 3mo | $364,900 | $157 | 67 |
| 320 Millcreek Dr | 0.30mi | 3/2.0 (-1) | 2,151 (-6%) | 6mo | $309,900 | $144 | 66 |
| 219 Hidden Hills Pkwy | 0.48mi | 4/3.0 | 2,242 (-2%) | 5mo | $374,500 | $167 | 66 |
| 454 Glendale Pl | 0.44mi | 4/3.0 | 2,389 (+5%) | 2mo | $405,000 | $170 | 66 |
| 670 Hidden Hills Xing | 0.60mi | 4/3.0 | 2,225 (-2%) | 1mo | $399,000 | $179 | 63 |
| 272 Hidden Hills Pkwy | 0.68mi | 3/2.0 (-1) | 2,024 (-11%) | 6mo | $334,900 | $165 | 39 |
Match score weights: distance 35% · size 25% · config 20% · recency 20%. Top-matched comps best support the ARV.
Projected returns pro-forma
-3.0% appreciation · 2.9% rent growth · sell at horizon
- IRR
- -19.5%
- Equity multiple
- 0.32×
- Total profit
- $-61,835
- Equity at exit
- $48,444
- IRR
- -12.5%
- Equity multiple
- 0.27×
- Total profit
- $-66,644
- Equity at exit
- $28,091
Cash invested: $90,972 (down + closing). Projections, not guarantees.
Landlord ↔ Tenant lean methodology
- Overall (STATE)
- 90 Strongly Landlord-Friendly
- State Mississippi
- 90 Strongly Landlord-Friendly · R+11
- County
- — inherits STATE
- City
- — inherits STATE
ZIP-level market 39047
- Home prices YoY
- -32.6%
- Rents YoY
- 2.9%
- Active inventory
- 433
- Price-to-rent
- 11.4×
Monthly cashflow live
- Estimated rent
- $2,370 medium interval (Pro) →
- Mortgage (P&I)
- −$1,704
- Tax from tax record
- −$155 /mo · $1,858/yr
- Insurance
- −$135
- HOA
- −$17
- Vacancy / Maint / Mgmt
- −$498
- Net cashflow
- $-139
Break-even live
Sensitivity live
| Price | -10% $45 | -5% $-47 | +0% $-139 | +5% $-231 | +10% $-323 |
|---|---|---|---|---|---|
| Rent | -10% $-326 | -5% $-232 | +0% $-139 | +5% $-45 | +10% $48 |
| Rate | -1.0pp $25 | -0.5pp $-56 | base $-139 | +0.5pp $-223 | +1.0pp $-309 |
UW: 25.0% down · 7.5% · 30yr · 1.5% tax · 5.0% vac · 8.0% maint · 8.0% mgmt
Financing live
Cash to close
- Down payment
- $81,225
- Closing costs
- $9,747
- Reserves months
- —
- Total cash needed
- —
Loan-product check · same deal, 3 products live
Conventional
25% down · 7.5% · 30yr
- Down + closing
- —
- Monthly P&I
- —
- Monthly cashflow
- —
- DSCR
- —
- Eligible?
- —
Personal DTI + credit; lowest rate.
DSCR
20% down · 8.5% · 30yr
- Down + closing
- —
- Monthly P&I
- —
- Monthly cashflow
- —
- DSCR
- —
- Eligible?
- —
No personal income docs; deal must DSCR.
Hard money
10% down · 12.0% · 12mo
- Down + closing
- —
- Monthly P&I
- —
- Monthly cashflow
- —
- DSCR
- —
- Eligible?
- —
Short-term bridge; refi at stabilization.
Rent comps 4 comps
| Address | Beds | Baths | Sqft | Rent | $/sqft | DOM | Units | Dist |
|---|---|---|---|---|---|---|---|---|
| 413 Shenandoah Rd N Brandon, MS | 4.0 | 2.0 | 1715 | $2,056 | $1.20 | 14d | 1 | 0.89mi |
| 133 Cumberland Rd Brandon, MS | 4.0 | 3.0 | 1846 | $2,225 | $1.21 | 24d | 1 | 0.97mi |
| 218 Shenandoah Rd N Brandon, MS | 3.0 | 2.0 | 1625 | $2,006 | $1.23 | 44d | 1 | 1.15mi |
| 108 Cypress Ridge Dr Brandon, MS | 3.0 | 2.0 | 1911 | $2,206 | $1.15 | 44d | 1 | 1.27mi |
HOA detail
- Monthly dues
- $17 · $204/yr
- Likely covers
- pool
Listing history 18 events
-
2026-06-18days on market $324,900 Active 44 DOM
-
2026-06-17days on market $324,900 Active 43 DOM
-
2026-06-16days on market $324,900 Active 42 DOM
-
2026-06-15days on market $324,900 Active 41 DOM
-
2026-06-14days on market $324,900 Active 39 DOM
-
2026-06-13days on market $324,900 Active 38 DOM
-
2026-06-10days on market $324,900 Active 36 DOM
-
2026-06-09days on market $324,900 Active 35 DOM
-
2026-06-08days on market $324,900 Active 34 DOM
-
2026-06-07days on market $324,900 Active 33 DOM
-
2026-06-03days on market $324,900 Active 29 DOM
-
2026-06-02pricedays on market $324,900 Active 28 DOM
-
2026-06-01days on market $335,000 Active 27 DOM
-
2026-05-31days on market $335,000 Active 26 DOM
-
2026-05-30days on market $335,000 Active 25 DOM
-
2026-05-05$335,000 Active 1227-char remark
-
2015-11-30soldstatus 845-char remark
Show marketing remark (845 chars)
This home was bought by an investor as a foreclosure. This home will not go FHA due to flipping rules. The home seems to be in good condition just needs some updates. The seller has just put a new roof on the property within the last 30 days. This home has a great floor-plan. There are 4 bedrooms and 2 1/2 baths. This home is on a semi open, split plan. There is a beautiful formal dining room. The living room and hall way has beautiful hardwood floors. The master bath features a whirlpool tub, double vanities, and a separate shower. The master closet is HUGE! This home has tons of potential. If this home does not sell in the 1st 60 days on the market the owner is going to do updates such as granite, some new floors, and fixtures and raise the price to $214,000. Please call your agent today to get in to see this Diamond in the rough!!
-
2015-10-05$169,900 845-char remark
Show marketing remark (845 chars)
This home was bought by an investor as a foreclosure. This home will not go FHA due to flipping rules. The home seems to be in good condition just needs some updates. The seller has just put a new roof on the property within the last 30 days. This home has a great floor-plan. There are 4 bedrooms and 2 1/2 baths. This home is on a semi open, split plan. There is a beautiful formal dining room. The living room and hall way has beautiful hardwood floors. The master bath features a whirlpool tub, double vanities, and a separate shower. The master closet is HUGE! This home has tons of potential. If this home does not sell in the 1st 60 days on the market the owner is going to do updates such as granite, some new floors, and fixtures and raise the price to $214,000. Please call your agent today to get in to see this Diamond in the rough!!
ⓘ Source: listings_history table (triggers on properties + properties_extension) + one-shot
backfill from property_details.listing_events for pre-trigger history.
Tax reassessment forecast MS · Resets to sale price
- Current annual tax
- $1,858 · $155/mo
- Projected year-2 tax
- $2,567 · $214/mo
- Expected delta
- +$709/yr (+$59/mo · 38.1%)
ⓘ Screening estimate from a state-policy table — verify with the county assessor before closing.
Climate risk First Street
- Flood 1/10 Low FEMA zone X (unshaded) · 0% chance over 30 yrs
- Wildfire 3/10 Moderate
- Heat 7/10 Severe 7 d/yr ≥108°F today · 20 d/yr by 30 yrs out
- Wind 8/10 Severe 80% chance of damaging wind over 30 yrs
- Air quality 2/10 Low 1 unhealthy d/yr today · 1 by 30 yrs out
Nearby sold comps map
Loading sold comps map…
Walkable amenities ~0.75 mi
Loading nearby amenities…
Taxation est. · year 1
- Rental income
- $28,439
- − Mortgage interest
- −$18,199
- − Property taxes
- −$1,858
- − Insurance
- −$1,624
- − Repairs & maintenance
- −$2,275
- − Management
- −$2,275
- − HOA
- −$204
- − Depreciation
- −$9,452
- Taxable loss
- −$7,449
- Est. tax savings @ 24.0%
- +$1,788
- After-tax cash flow
- $122/yr
For passive investors: Depreciation is non-cash, so a rental often shows a tax loss while cash-flowing — sheltering income. Rental losses are passive: they offset passive income freely, and up to $25,000/yr can offset ordinary (W-2) income if you actively participate and your MAGI is under $100k (phasing out to $0 by $150k); unused losses carry forward. On sale, claimed depreciation is recaptured at up to 25%, and gains may owe capital-gains tax (a 1031 exchange can defer both). Figures are a year-1 estimate at your 24.0% rate — not tax advice; consult a CPA.
Schools (NCES district)
- District
- Rankin County School District
- NCES district ID
- 2803830
- Math proficiency
- 56% ▼ -4.00%
- Reading proficiency
- 48% ▼ -6.00%
- Median HH income
- $61,867
- Composite
- 45.62/100
- National rank
- #2587
- State rank
- #6 of 130 in MS
Livability — Flowood
- Score
- 77/100
- State rank
- #10
- US rank
- #3075
Category grades
Schools grade is shown separately in the Schools card above.
Census & demographics
- County
- Rankin County · 123,614 people
- City population
- 9,222
- Metro
- Jackson, MS
- Population (ZIP)
- 40,808
- Household income
- $100,347
- Rent vs Own
- Severe rent burden
- 551.0
Population outlook (Rankin County) Hauer SSP2
- Today (2025)
- 164,317 people
- By 2030
- 171,013 · +4.1%
- By 2040
- 182,723 · +11.2%
- By 2050
- 192,376 · +17.1%
- By 2075
- 209,535 · +27.5%
- By 2100
- 209,534 · +27.5%
Race, ethnicity, and origin ACS 2023
- Neighborhood character
- Predominantly White (77%)
- Race & ethnicity
- White 77% Black 16% Two or more races 4% Hispanic / Latino 2% Asian 1%
- Common ancestry
- Italian 4% Slovak 3% Serbian 3%
- Foreign-born
- 3% · Canada
- Languages at home
- 95% English-only · Spanish 3% Other Indo-European 1% Other Asian/Pacific 1%
Political lean MEDSL · Rankin
- 2024 margin
- Solid R (+47.1) · D 25.9% · R 73.0% · Other 1.0%
- 2008→2024 swing
- +6.4pp toward D · 2008: -53.5pp · 2024: -47.1pp
- All cycles
- 2024: R+47.1 2020: R+45.4 2016: R+52.9 2012: R+51.9 2008: R+53.5
Not yet ingested
- Civics
- —
Market trends
- HPI YoY
- ▼ -79.01%
- Current HPI
- 162.9709
- Rent YoY
- ▲ 2.90%
- Metro
- Jackson, MS
- State GDP YoY
- —
- F500 in state
- 0
Price history
+91.2% since first listed4 events — show timeline
- 2026-06-01 Price Changed $324,900 MLSU
- 2026-05-05 Listed $335,000 MLSU
- 2015-11-30 Sold (MLS) — MLSU
- 2015-10-05 Listed $169,900 MLSU
Property tax history
-2.5%/yrLatest (2025): $1,858 · +6.4% YoY. Source: county tax records.
Cash-flow waterfall
monthlySold comps — $/sqft
last 12 mo · ≤1 miLoading sold comps…