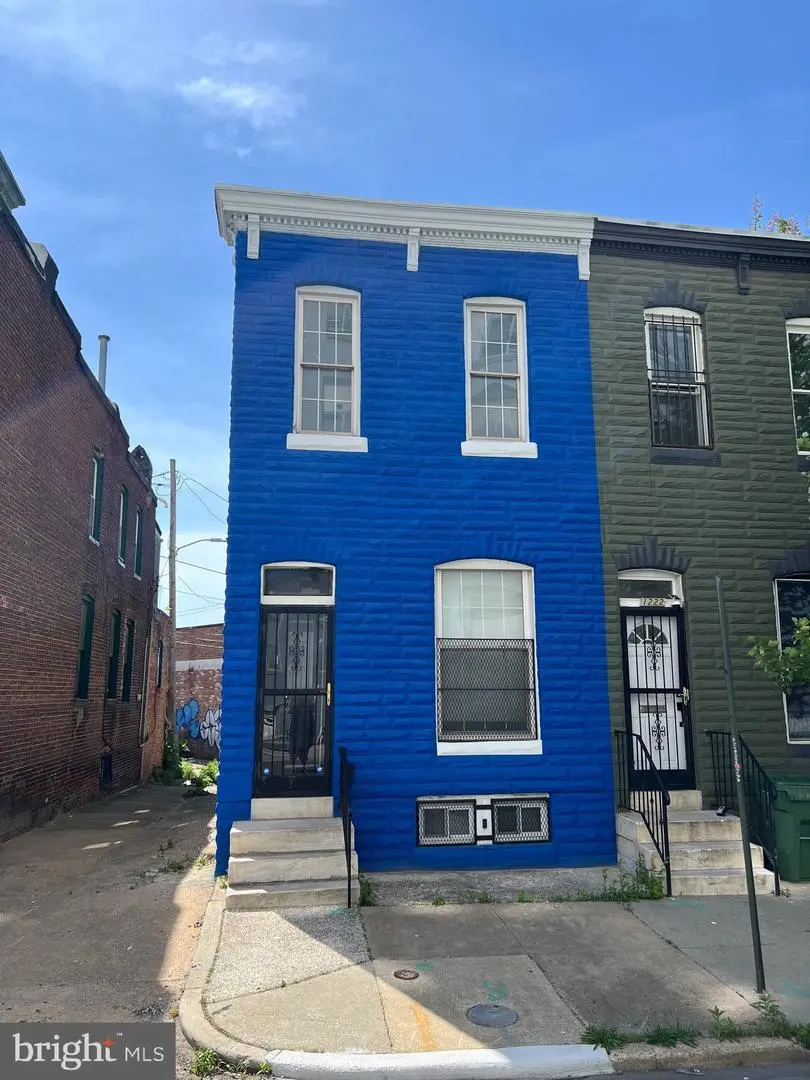
1220 Brentwood Ave · Baltimore, MD
Flood risk 3/10 · Minor
- FEMA flood zone
- X (unshaded)
- Chance of flooding over 30 yrs
- 0.2%
- Est. flood insurance / yr
- $507 – $1,088
Fire risk 1/10 · Minimal
- Est. fire insurance / yr
- $755 – $1,403
Heat risk 7/10 · Major
- Hot days now (above 103°F)
- 7 days/yr
- Hot days in 30 yrs
- 15 days/yr
Wind risk 6/10 · Moderate
- Chance of severe wind over 30 yrs
- 27.0%
Air-quality risk 4/10 · Minor
- Unhealthy air days now
- 6 days/yr
- Unhealthy air days in 30 yrs
- 7 days/yr
Risk factors via First Street. Map © Google.
Why this score? — see what drove the B- grade
The composite is a weighted blend of 9 inputs, each scored 0–100. Each bar is that input's sub-score; the figure is the points it added to the 100-point composite (weight × sub-score).
- Cash flow +30.0/30.0
- 1% rule +10.0/10.0
- DSCR +10.0/10.0
- ARV discount +7.5/15.0
- Livability +3.8/5.0
- Rent growth +2.6/5.0
- Condition / age +2.5/5.0
- Schools +1.0/10.0
- Appreciation +0.0/10.0
$129,900
🖨 Deal sheet 📄 Offer letter ✓ Due diligence
Listing remarks MLS
Great investment opportunity to flip or buy and hold this 3BR townhouse/rowhouse on quite street in Johnston Square neighborhood. Major renovations happening in this area, with sales ranging from $120k - $300K. House is currently occupied, but will convey vacant. Showings/Tours require 2-hour notice . Owner will provide access to the property.
Key facts
- Three unit property
- Built 1920
- Listed 42 days
Tags
Property features AI
Finance
- Other: Approximately 1,600 finished square feet above grade (estimated); Approximately 600 unfinished square feet below grade (estimated); Total below-grade area about 600 sq ft (estimated)
- Financial info: Fee simple ownership; Below average condition
Exterior
- Parking: On-street parking
- Utilities: Public water; Public sewer; Natural gas heating and hot water
- Home design: Brick construction; Permanent foundation; Above-grade and below-grade finished/unfinished areas
- Construction: Brick construction; Permanent foundation; Estimated year built
- Exterior features: End of row/townhouse; Pets allowed (cats and dogs)
Interior
- Bedrooms: Three bedrooms on the first upper level
- Bathrooms: One full bathroom (all upper levels)
- Heating & cooling: Forced air heating; Natural gas hot water
- Interior features: Estimated living area; Has fireplace (1)
Neighborhood map
What this means for you Summary
Snapshot
- This is a 3-bed/1.0-bath townhouse listed at $130k.
Deal economics
- At list price, monthly cash flow is $770 ($9k/yr) — positive.
- The deal already cash-flows at list — no discount required.
- Meets the 1% rule at list price ($2k rent vs $130k).
- Recommended offer: $126k (3.0% below list) — sets the bar for market timing.
- Cap rate 13.4% vs local median 6.0% in Baltimore — top-decile yield for the area; either an underpriced asset or a hidden risk that comps aren't pricing in. Stress-test before assuming the spread holds.
Location & tenants
- Location reads 76/100 on livability (#90 in MD, #3,396 nationally) — a middle-class / working-renter tenant base. Strengths: amenities A+, commute A+, housing A+; Watch: schools D, crime F.
- Baltimore City Public Schools (urban): math 7% / reading 16% proficiency, ranked #24 of 24 in MD (top 100%) — low school quality limits family demand, transient renter base, plan for 1-2y turnover; 79% free/reduced lunch — lower-income household profile, screen leases tightly.
- Market conditions: Rents flat; 134 active listings in the ZIP; 40 comparable units currently listed for rent nearby; rentals at typical pace (median 22d on market — plan ~3-4 weeks tenant-placement turnaround); 1,273 units permitted in Baltimore city in 2024 (1,104 in 5+ unit buildings).
- This rent runs 41% of the median local income ($59k/yr) — at the standard rent-burdened threshold; future hikes will face affordability resistance.
Forward outlook
- Local home prices are declining (-3.0%/yr); year-one equity from $898 of loan paydown is wiped out by about $4k of value loss. Plan a longer hold.
- Baltimore County population projected to shrink 4% by 2050 — rents likely to lag national; underwrite the cash flow, not the appreciation.
- At projected returns (-3.0% appreciation + 0.6% rent growth), your $36k cash investment doubles in ~6 years — after that, you're playing with house money.
Negotiation context
- It's been on market 42 days — a 3% lower offer ($126k) is reasonable based on typical stale-listing flexibility.
- 3 sale attempts; this cycle's ask has dropped $18k (12%) from the opening price — seller is motivated, your offer sets the floor, not the list.
- Current owner paid $75k; list at $130k implies a 73% gain — meaningful room to come down on a strong offer.
Risks & watch-outs
- Watch-outs: built in 1920 — expect roof / HVAC / electrical / plumbing capex.
- Climate carrying-cost: major wind risk, 27% chance of damaging wind over 30y; extreme-heat days projected 7→15/yr by 2055 (HVAC capex compounding) — expect insurance premiums to compound above CPI over the hold.
Questions for the listing agent
- It's been on market 42 days. Have you received any prior offers? Is the seller open to a 3% concession, seller financing, or rate buy-down credit?
- Built in 1920 — when were the roof, HVAC, electrical panel, plumbing, and water heater last replaced?
- Is there a deadline driving the sale (1031 exchange, divorce, estate, relocation)? That informs how much negotiation room exists.
- Schools are D-rated, which usually means shorter tenancies and higher turnover. Who's the typical renter profile here, and what's been the actual vacancy rate?
- Crime grade is F in this area — have there been break-ins, vandalism, or insurance claims at this property in the last 3 years? What carrier currently insures it and at what premium?
- What's the average days-on-market for RENTAL listings here right now (not sales)? A rising rental-DOM trend means longer vacancies and softer asking-rent achievability than the comps imply.
- What's the recent tenant-quality profile in this submarket — average credit score on applications, eviction rate, late-payment / NSF rate, and stable-employment percentage? A property-management company in the area should have these aggregated.
- How much new for-sale + rental construction is in the pipeline within 1–3 miles? Heavy new supply typically softens prices + rents 12–24 months out; constrained supply supports both.
Investment metrics
- 1% rule
- 1.55% ✓
- Cap rate
- 13.41%
- Cash-on-cash
- 25.41%
- DSCR
- 2.13
- GRM
- 5.4
CMA / ARV
- ARV (median comp)
- $266,422
- List price
- $129,900
- Delta
- -51.24%
- Verdict
- UNDERPRICED
- Comps
- 20 within 1.0 mi
Show comp detail 12 sales within ~0.75 mi
| Address | Dist | Beds/Ba | Sqft | Sold | Price | $/sf | Match |
|---|---|---|---|---|---|---|---|
| 731 E Preston St | 0.12mi | 3/2.5 | 1,700 (+6%) | 5mo | $283,500 | $167 | 74 |
| 733 E Preston St | 0.12mi | 3/2.5 | 1,500 (-6%) | 5mo | $155,000 | $103 | 74 |
| 1206 Turpin Ln | 0.17mi | 3/2.5 | 1,728 (+8%) | 1mo | $215,000 | $124 | 72 |
| 707 E Preston St | 0.09mi | 3/2.5 | 1,762 (+10%) | 2mo | $275,000 | $156 | 71 |
| 422 E Lanvale St | 0.32mi | 4/3.0 (+1) | 1,566 (-2%) | 1mo | $280,000 | $179 | 68 |
| 1100 N Calvert St #2 | 0.24mi | 2/2.5 (-1) | 1,486 (-7%) | 3mo | $350,000 | $236 | 63 |
| 1209 N Charles St #314 | 0.33mi | 2/2.0 (-1) | 1,482 (-7%) | 4mo | $295,000 | $199 | 60 |
| 1024 N Central Ave | 0.50mi | 4/2.0 (+1) | 1,451 (-9%) | 1mo | $204,000 | $141 | 52 |
| 1209 N Charles St #115 | 0.33mi | 2/2.0 (-1) | 1,384 (-14%) | 2mo | $279,888 | $202 | 52 |
| 1502 E Hoffman St | 0.65mi | 3/2.5 | 1,500 (-6%) | 3mo | $220,000 | $147 | 51 |
| 2227 Cecil Ave | 0.73mi | 3/2.0 | 1,764 (+10%) | 2mo | $195,000 | $111 | 43 |
| 1433 E Federal St | 0.63mi | 3/3.0 | 1,814 (+13%) | 2mo | $181,900 | $100 | 38 |
Match score weights: distance 35% · size 25% · config 20% · recency 20%. Top-matched comps best support the ARV.
Projected returns pro-forma
-3.0% appreciation · 0.59% rent growth · sell at horizon
- IRR
- 16.3%
- Equity multiple
- 1.64×
- Total profit
- $23,213
- Equity at exit
- $19,369
- IRR
- 23.2%
- Equity multiple
- 2.78×
- Total profit
- $64,639
- Equity at exit
- $11,231
Cash invested: $36,372 (down + closing). Projections, not guarantees.
Landlord ↔ Tenant lean methodology
- Overall (CITY)
- 12 Strongly Tenant-Friendly
- State Maryland
- 27 Tenant-Leaning · D+14
- County
- — inherits STATE
- City Baltimore
- 12 Strongly Tenant-Friendly · D+58
ZIP-level market 21202
- Home prices YoY
- -8.0%
- Rents YoY
- 0.6%
- Active inventory
- 134
- Price-to-rent
- 5.4×
Monthly cashflow live
- Estimated rent
- $2,017 high interval (Pro) →
- Mortgage (P&I)
- −$681
- Tax from tax record
- −$88 /mo · $1,057/yr
- Insurance
- −$54
- HOA
- −$0
- Vacancy / Maint / Mgmt
- −$424
- Net cashflow
- $770
Break-even live
UW: 25.0% down · 7.5% · 30yr · 1.5% tax · 5.0% vac · 8.0% maint · 8.0% mgmt
Financing live
Cash to close
- Down payment
- $32,475
- Closing costs
- $3,897
- Reserves months
- —
- Total cash needed
- —
Loan-product check · same deal, 3 products live
Conventional
25% down · 7.5% · 30yr
- Down + closing
- —
- Monthly P&I
- —
- Monthly cashflow
- —
- DSCR
- —
- Eligible?
- —
Personal DTI + credit; lowest rate.
DSCR
20% down · 8.5% · 30yr
- Down + closing
- —
- Monthly P&I
- —
- Monthly cashflow
- —
- DSCR
- —
- Eligible?
- —
No personal income docs; deal must DSCR.
Hard money
10% down · 12.0% · 12mo
- Down + closing
- —
- Monthly P&I
- —
- Monthly cashflow
- —
- DSCR
- —
- Eligible?
- —
Short-term bridge; refi at stabilization.
Rent comps 40 comps
| Address | Beds | Baths | Sqft | Rent | $/sqft | DOM | Units | Dist |
|---|---|---|---|---|---|---|---|---|
| 1100 Greenmount Ave Baltimore, MD | 1.0–3.0 | 1.0–2.0 | 839 | $2,584 | $3.08 | 2d | 1 | 0.10mi |
| 218 E Preston St Baltimore, MD | 2.0 | 1.0 | 1250 | $1,724 | $1.38 | 43d | 1 | 0.18mi |
| 814 Showell Ct Baltimore, MD | 3.0 | 1.0 | 1152 | $2,000 | $1.74 | 22d | 1 | 0.19mi |
| 1312 Guilford Ave Baltimore, MD | 1.0–2.0 | 1.0–2.0 | 1040 | $1,850 | $1.78 | 43d | 6 | 0.20mi |
| 1121 N Calvert St Baltimore, MD | 2.0 | 1.0 | 1300 | $1,550 | $1.19 | 43d | 1 | 0.23mi |
| 1101 N Calvert St Baltimore, MD | 2.0 | 1.0–2.0 | 910 | $2,274 | $2.50 | 2d | 19 | 0.23mi |
| 1009 Hillman St Baltimore, MD | 3.0 | 1.0 | 1200 | $1,650 | $1.38 | 20d | 1 | 0.23mi |
| 908 E Preston St Baltimore, MD | 3.0 | 2.0 | 1560 | $1,300 | $0.83 | 43d | 1 | 0.24mi |
| 226 E Eager St Baltimore, MD | 3.0 | 2.0 | 1484 | $650 | $0.44 | 43d | 1 | 0.24mi |
| 1032 Valley St Baltimore, MD | 4.0 | 2.0 | 1900 | $2,150 | $1.13 | 4d | 1 | 0.24mi |
| 103 E Mt Royal Ave Baltimore, MD | 1.0–3.0 | 1.0–2.0 | 850 | $2,624 | $3.09 | 1d | 17 | 0.27mi |
| 1301 Saint Paul St Baltimore, MD | 3.0 | 1.0–3.0 | 1050 | $2,399 | $2.28 | 43d | 1 | 0.29mi |
| 456 E Federal St Baltimore, MD | 2.0 | 2.0 | 1450 | $1,850 | $1.28 | 43d | 1 | 0.29mi |
| 458 E Federal St Baltimore, MD | 2.0 | 2.5 | 1300 | $1,850 | $1.42 | 4d | 1 | 0.29mi |
| 1101 Saint Paul St Baltimore, MD | 1.0–2.0 | 1.0–2.0 | 1108 | $2,200 | $1.99 | 18d | 3 | 0.29mi |
| 412 E Federal St Baltimore, MD | 2.0 | 2.5 | 1100 | $1,700 | $1.55 | 24d | 1 | 0.29mi |
| 437 Pitman Pl Baltimore, MD | 2.0 | 3.0 | 1520 | $1,650 | $1.09 | 4d | 1 | 0.30mi |
| 412 E Lanvale St Baltimore, MD | 3.0 | 2.0 | 1600 | $3,100 | $1.94 | 4d | 1 | 0.36mi |
| 1209 N Charles St Baltimore, MD | 1.0–2.0 | 1.0–2.0 | 1462 | $2,750 | $1.88 | 2d | 2 | 0.37mi |
| 1214 N Charles St Baltimore, MD | 2.0 | 1.0–2.0 | 1103 | $2,333 | $2.11 | 1d | 14 | 0.39mi |
| 351 Greenmount Ave Baltimore, MD | 3.0 | 1.5 | 1616 | $1,850 | $1.14 | 43d | 1 | 0.45mi |
| 1801 Guilford Ave Baltimore, MD | 3.0 | 3.5 | 1921 | $2,595 | $1.35 | 24d | 3 | 0.46mi |
| 1807 Guilford Ave Unit G-1807 Baltimore, MD | 3.0 | 3.5 | 1920 | $2,750 | $1.43 | 43d | 1 | 0.47mi |
| 1809 Guilford Ave Unit G-1809 Baltimore, MD | 3.0 | 3.5 | 1920 | $2,750 | $1.43 | 43d | 1 | 0.47mi |
| 1813 Guilford Ave Unit G-1813 Baltimore, MD | 3.0 | 3.5 | 1920 | $2,750 | $1.43 | 43d | 1 | 0.47mi |
| 1704 Saint Paul St Unit 1 Baltimore, MD | 2.0 | 1.0 | 1141 | $1,550 | $1.36 | 4d | 1 | 0.48mi |
| 1823 Guilford Ave Unit G-1823 Baltimore, MD | 3.0 | 3.5 | 1920 | $2,750 | $1.43 | 43d | 1 | 0.48mi |
| 1027 N Central Ave Baltimore, MD | 3.0 | 1.0 | 1200 | $1,600 | $1.33 | 22d | 1 | 0.48mi |
| 1245 E Eager St Baltimore, MD | 3.0 | 1.0 | 1592 | $1,200 | $0.75 | 24d | 1 | 0.48mi |
| 1827 Guilford Ave Unit G-1809 Baltimore, MD | 3.0 | 3.5 | 1920 | $2,750 | $1.43 | 24d | 1 | 0.49mi |
| 918 N Central Ave Baltimore, MD | 3.0 | 1.0 | 1514 | $1,400 | $0.92 | 15d | 1 | 0.50mi |
| 931 N Central Ave Baltimore, MD | 3.0 | 1.0 | 1085 | $1,400 | $1.29 | 24d | 1 | 0.52mi |
| 1232 Ashland Ave Baltimore, MD | 3.0 | 1.0 | 1200 | $1,600 | $1.33 | 22d | 1 | 0.52mi |
| 1317 E Eager St Baltimore, MD | 4.0 | 1.5 | 1400 | $1,900 | $1.36 | 22d | 1 | 0.53mi |
| 624 Stirling St Baltimore, MD | 4.0 | 3.0 | 1812 | $2,450 | $1.35 | 43d | 1 | 0.53mi |
| 900 Cathedral St Baltimore, MD | 3.0 | 1.0 | 902 | $2,699 | $2.99 | 2d | 4 | 0.54mi |
| 101 W Read St Baltimore, MD | 2.0 | 1.0–2.0 | 773 | $2,275 | $2.94 | 3d | 16 | 0.55mi |
| 1226 E Madison St Baltimore, MD | 3.0 | 1.0 | 1100 | $2,179 | $1.98 | 4d | 1 | 0.55mi |
| 1243 E Lanvale St Baltimore, MD | 3.0 | 1.5 | 1281 | $1,750 | $1.37 | 2d | 1 | 0.56mi |
| 1243 E Lanvale St Baltimore, MD | 3.0 | 1.5 | 1281 | $1,750 | $1.37 | 16d | 1 | 0.56mi |
Listing history 23 events
-
2026-06-18days on market $129,900 Active 42 DOM
-
2026-06-17days on market $129,900 Active 41 DOM
-
2026-06-16days on market $129,900 Active 40 DOM
-
2026-06-15days on market $129,900 Active 39 DOM
-
2026-06-13statusdays on market $129,900 Active 37 DOM
-
2026-06-10remarks 525-char remark
-
2026-06-10status $129,900 Pending 35 DOM
-
2026-06-09days on market $129,900 Active 35 DOM
-
2026-06-08days on market $129,900 Active 34 DOM
-
2026-06-07days on market $129,900 Active 33 DOM
-
2026-06-04days on market $129,900 Active 30 DOM
-
2026-06-03days on market $129,900 Active 29 DOM
-
2026-06-02days on market $129,900 Active 28 DOM
-
2026-06-02price $129,900 Active 27 DOM
-
2026-06-01days on market $138,000 Active 27 DOM
-
2026-05-31days on market $138,000 Active 26 DOM
-
2026-05-14price $139,000 497-char remark
-
2026-05-05$148,000 Active 497-char remark
-
2026-03-23soldstatus $75,000
-
2026-02-24soldstatus $75,000 Closed 345-char remark
Show marketing remark (345 chars)
Great investment opportunity to flip or buy and hold this 3BR townhouse/rowhouse on quite street in Johnston Square neighborhood. Major renovations happening in this area, with sales ranging from $120k - $300K. House is currently occupied, but will convey vacant. Showings/Tours require 2-hour notice . Owner will provide access to the property.
-
2026-01-10status Pending 345-char remark
Show marketing remark (345 chars)
Great investment opportunity to flip or buy and hold this 3BR townhouse/rowhouse on quite street in Johnston Square neighborhood. Major renovations happening in this area, with sales ranging from $120k - $300K. House is currently occupied, but will convey vacant. Showings/Tours require 2-hour notice . Owner will provide access to the property.
-
2026-01-05$100,000 Active 345-char remark
Show marketing remark (345 chars)
Great investment opportunity to flip or buy and hold this 3BR townhouse/rowhouse on quite street in Johnston Square neighborhood. Major renovations happening in this area, with sales ranging from $120k - $300K. House is currently occupied, but will convey vacant. Showings/Tours require 2-hour notice . Owner will provide access to the property.
-
1987-06-24soldstatus $9,500
ⓘ Source: listings_history table (triggers on properties + properties_extension) + one-shot
backfill from property_details.listing_events for pre-trigger history.
Tax reassessment forecast MD · Partial reset (capped growth)
- Current annual tax
- $1,057 · $88/mo
- Projected year-2 tax
- $1,236 · $103/mo
- Expected delta
- +$179/yr (+$15/mo · 17.0%)
ⓘ Screening estimate from a state-policy table — verify with the county assessor before closing.
Climate risk First Street
- Flood 3/10 Moderate FEMA zone X (unshaded) · 20% chance over 30 yrs
- Wildfire 1/10 Low
- Heat 7/10 Severe 7 d/yr ≥103°F today · 15 d/yr by 30 yrs out
- Wind 6/10 Major 27% chance of damaging wind over 30 yrs
- Air quality 4/10 Moderate 6 unhealthy d/yr today · 7 by 30 yrs out
Nearby sold comps map
Loading sold comps map…
Walkable amenities ~0.75 mi
Loading nearby amenities…
Taxation est. · year 1
- Rental income
- $24,207
- − Mortgage interest
- −$7,276
- − Property taxes
- −$1,057
- − Insurance
- −$650
- − Repairs & maintenance
- −$1,937
- − Management
- −$1,937
- − Depreciation
- −$3,779
- Taxable income
- $7,572
- Est. tax owed @ 24.0%
- −$1,817
- After-tax cash flow
- $7,425/yr
For passive investors: Depreciation is non-cash, so a rental often shows a tax loss while cash-flowing — sheltering income. Rental losses are passive: they offset passive income freely, and up to $25,000/yr can offset ordinary (W-2) income if you actively participate and your MAGI is under $100k (phasing out to $0 by $150k); unused losses carry forward. On sale, claimed depreciation is recaptured at up to 25%, and gains may owe capital-gains tax (a 1031 exchange can defer both). Figures are a year-1 estimate at your 24.0% rate — not tax advice; consult a CPA.
Schools (NCES district)
- District
- Baltimore City Public Schools
- NCES district ID
- 2400090
- Math proficiency
- 7% ▼ -9.00%
- Reading proficiency
- 16% ▼ -5.00%
- Median HH income
- $42,108
- Composite
- 10.08/100
- National rank
- #9805
- State rank
- #24 of 24 in MD
Livability — Baltimore
- Score
- 76/100
- State rank
- #90
- US rank
- #3396
Category grades
Schools grade is shown separately in the Schools card above.
Census & demographics
- Census place
- Baltimore, MD
- County
- Baltimore City · 558,601 people
- City population
- 588,727
- Metro
- Baltimore-Columbia-Towson, MD
- Population (ZIP)
- 20,683
- Household income
- $59,377
- Rent vs Own
- Severe rent burden
- 1863.0
Population outlook (Baltimore County) Hauer SSP2
- Today (2025)
- 624,249 people
- By 2030
- 621,541 · -0.4%
- By 2040
- 609,756 · -2.3%
- By 2050
- 597,249 · -4.3%
- By 2075
- 552,236 · -11.5%
- By 2100
- 513,934 · -17.7%
Race, ethnicity, and origin ACS 2023
- Neighborhood character
- Diverse neighborhood (Simpson 0.63)
- Race & ethnicity
- Black 52% White 31% Hispanic / Latino 7% Two or more races 6% Asian 5%
- Hispanic origin (detail)
- Mexican 2%
- Common ancestry
- Lithuanian 2% Romanian 2% Slovak 1%
- Foreign-born
- 12% · Canada, South Korea, China
- Languages at home
- 87% English-only · Spanish 4% Other Indo-European 2% Arabic 1%
Political lean MEDSL · Baltimore
- 2024 margin
- Solid D (+73.0) · D 85.2% · R 12.2% · Other 2.6%
- 2008→2024 swing
- -2.5pp toward R · 2008: 75.5pp · 2024: 73.0pp
- All cycles
- 2024: D+73.0 2020: D+76.6 2016: D+74.6 2012: D+76.4 2008: D+75.5
Not yet ingested
- Civics
- —
Market trends
- HPI YoY
- ▼ -25.44%
- Current HPI
- 291.3702
- Rent YoY
- ▲ 0.59%
- Metro
- Baltimore-Columbia-Towson, MD
- State GDP YoY
- ▲ 2.97%
- F500 in state
- 12
Industry mix (Fortune 500 HQ in MD)
| Industry | F500 HQs | Revenue |
|---|---|---|
| Aerospace / Defense | 1 | $71B |
|
||
| Utilities | 1 | $25B |
|
||
| Hotels | 1 | $24B |
|
||
| Consumer Goods | 1 | $7B |
|
||
| Real Estate | 1 | $6B |
|
||
| Chemicals | 1 | $2B |
|
||
Price history
+1267.4% since first listed11 events — show timeline
- 2026-06-11 Relisted — BRIGHT MLS
- 2026-06-09 Pending — BRIGHT MLS
- 2026-06-02 Price Changed $129,900 BRIGHT MLS
- 2026-05-25 Price Changed $138,000 BRIGHT MLS
- 2026-05-14 Price Changed $139,000 BRIGHT MLS
- 2026-05-05 Listed $148,000 BRIGHT MLS
- 2026-03-23 Sold (Public Records) $75,000 Public Records
- 2026-02-24 Sold (MLS) $75,000 BRIGHT MLS
- 2026-01-10 Pending — BRIGHT MLS
- 2026-01-05 Listed $100,000 BRIGHT MLS
- 1987-06-24 Sold (Public Records) $9,500 Public Records
Property tax history
+8.7%/yrLatest (2025): $1,057 · +28.6% YoY. Source: county tax records.
Cash-flow waterfall
monthlySold comps — $/sqft
last 12 mo · ≤1 miLoading sold comps…