 🏗️ New Construction
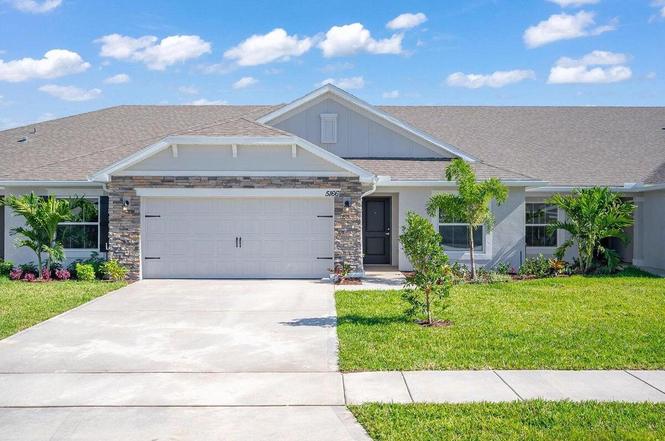
8625 Giovanni Ave · Lakewood Park, FL
Flood risk 1/10 · Minimal
- FEMA flood zone
- X (unshaded)
- Chance of flooding over 30 yrs
- 0.0%
- Est. flood insurance / yr
- $507 – $1,088
Fire risk 3/10 · Minor
- Est. fire insurance / yr
- $947 – $1,759
Heat risk 10/10 · Severe
- Hot days now (above 107°F)
- 7 days/yr
- Hot days in 30 yrs
- 24 days/yr
Wind risk 10/10 · Severe
- Chance of severe wind over 30 yrs
- 99.0%
Air-quality risk 1/10 · Minimal
- Unhealthy air days now
- 0 days/yr
- Unhealthy air days in 30 yrs
- 0 days/yr
Risk factors via First Street. Map © Google.
Why this score? — see what drove the D- grade
The composite is a weighted blend of 9 inputs, each scored 0–100. Each bar is that input's sub-score; the figure is the points it added to the 100-point composite (weight × sub-score).
- Cash flow +13.0/30.0
- ARV discount +7.5/15.0
- DSCR +3.9/10.0
- Schools +3.7/10.0
- 1% rule +3.2/10.0
- Livability +3.2/5.0
- Rent growth +2.5/5.0
- Condition / age +2.5/5.0
- Appreciation +0.0/10.0
$325,000
🖨 Deal sheet 📄 Offer letter ✓ Due diligence
Listing remarks
COMPETITIVE RATES, AND FLEX INCENTIVES. .. . REALTOR COOPERATION WELCOMED 3% NEW CONSTRUCTION - VILLA-MODEL 1658, 3 ROOMS 2 BATH, FLEX AND 2 CAR GARAGE READY APRIL 2026! Discover the perfect blend of modern design and affordable luxury in the highly desirable Waterstone Community. This stunning 1,658 sq. ft. floor plan features a spacious open-concept layout and sleek "MODERN FINISHES", ideal for contemporary Florida living. Spacious Living: 3 Bedrooms, 2 Bathrooms, Flex and a 2-Car Garage. Enjoy a beautiful covered patio. Waterstone offers premium amenities, including a clubhouse, pool, tennis, and pickleball courts. Flex Cash Available: Use toward closing costs or rate buy-
Key facts
- 4,095 sq ft lot
- 2 garage spots
- Community pool
Neighborhood map
What this means for you Summary
Snapshot
- This is a 3-bed/2.0-bath land listed at $325k.
Deal economics
- At list price, monthly cash flow is $-18 ($-219/yr) — negative.
- To cash-flow at today's rent, offer at most $322k (1.0% below list).
- To meet the 1% rule (rent ≥ 1% of price), the offer needs to be $266k (18.2% below list).
- Recommended offer: $266k (18.2% below list) — sets the bar for 1% rule.
Location & tenants
- Location reads 63/100 on livability (#719 in FL) — a middle-class / working-renter tenant base. Strengths: cost of living A+, housing A+; Watch: amenities F, commute F, health & safety D-.
- St. Lucie (urban): math 40% / reading 48% proficiency, ranked #51 of 73 in FL (top 70%) — families likely to look elsewhere, expect single-tenant / working-renter base with shorter leases.
- Zoned schools: Weatherbee Elementary School (math 32% / reading 32%, grade F, #1,797 of 2,144 statewide, top 86%, 672 students, 90% FRL); Dan Mccarty Middle School (math 23% / reading 23%, grade F, #542 of 571 statewide, top 95%, 747 students, 88% FRL); Fort Pierce Westwood Academy The W.E.S.T. Prep Magnet (math 16% / reading 36%, grade F, #494 of 667 statewide, top 75%, 2,010 students, 75% FRL) — zoned schools average 85% FRL vs 59% district-wide (26 pts higher); higher-poverty schools than district average — tighter screening recommended.
- Zoned-school proficiency averages 27% at this address vs 44% district-wide (-17 pts) — the specific schools serving this property underperform the St. Lucie average; the district grade overstates school quality for this exact location.
- Market conditions: 292 active listings in the ZIP; 10 comparable units currently listed for rent nearby; rentals at typical pace (median 21d on market — plan ~3-4 weeks tenant-placement turnaround); 4,868 units permitted in St. Lucie County in 2024 (268 in 5+ unit buildings).
- At $2,658/mo this rent would consume 51% of the median local household income ($63k/yr) (locally 140% of renters already pay >50% of income on rent) — very limited rent-growth headroom before tenants either downsize or default.
Forward outlook
- Local home prices are declining (-3.0%/yr); year-one equity from $2k of loan paydown is wiped out by about $10k of value loss. Plan a longer hold.
- St. Lucie County population projected at +20% by 2050 — long-run rental-demand tailwind backs the buy-and-hold thesis.
Negotiation context
- It's been on market 120 days — a 9% lower offer ($296k) is reasonable based on typical stale-listing flexibility.
- 2 sale attempts with the ask held roughly flat each time — persistent listings suggest the price (not the market) is what's stuck; bring a comps-based counter.
Risks & watch-outs
- Climate carrying-cost: severe wind risk, 99% chance of damaging wind over 30y; extreme-heat days projected 7→24/yr by 2055 (HVAC capex compounding) — expect insurance premiums to compound above CPI over the hold.
Questions for the listing agent
- What do current leases actually rent for vs. the listed asking? Can we see a recent rent roll and the last 12 months of T-12 income?
- It's been on market 120 days. Have you received any prior offers? Is the seller open to a 18% concession, seller financing, or rate buy-down credit?
- What does the HOA fee cover, when was the last increase, and are there any pending special assessments or reserve-fund shortfalls?
- Why hasn't it sold? Are there any deal-killer items the seller is aware of (foundation, flood, title, zoning, code violations)?
- Is there a deadline driving the sale (1031 exchange, divorce, estate, relocation)? That informs how much negotiation room exists.
- Schools are F-rated, which usually means shorter tenancies and higher turnover. Who's the typical renter profile here, and what's been the actual vacancy rate?
- The area grade is low — what's the realistic commute time and amenity access for the typical tenant pool here? Any planned neighborhood developments (good or bad) we should know about?
- What's the average days-on-market for RENTAL listings here right now (not sales)? A rising rental-DOM trend means longer vacancies and softer asking-rent achievability than the comps imply.
- What's the recent tenant-quality profile in this submarket — average credit score on applications, eviction rate, late-payment / NSF rate, and stable-employment percentage? A property-management company in the area should have these aggregated.
- How much new for-sale + rental construction is in the pipeline within 1–3 miles? Heavy new supply typically softens prices + rents 12–24 months out; constrained supply supports both.
Investment metrics
- 1% rule
- 0.82% ✗
- Cap rate
- 6.23%
- Cash-on-cash
- -0.24%
- DSCR
- 0.99
- GRM
- 10.2
CMA / ARV
No comps found within radius.
Projected returns pro-forma
-3.0% appreciation · 3.0% rent growth · sell at horizon
- IRR
- -16.7%
- Equity multiple
- 0.41×
- Total profit
- $-53,864
- Equity at exit
- $48,459
- IRR
- -8.6%
- Equity multiple
- 0.47×
- Total profit
- $-48,556
- Equity at exit
- $28,100
Cash invested: $91,000 (down + closing). Projections, not guarantees.
Landlord ↔ Tenant lean methodology
- Overall (STATE)
- 87 Strongly Landlord-Friendly
- State Florida
- 87 Strongly Landlord-Friendly · R+3
- County
- — inherits STATE
- City
- — inherits STATE
ZIP-level market 34951
- Home prices YoY
- -23.6%
- Active inventory
- 292
- Price-to-rent
- 10.2×
Monthly cashflow live
- Estimated rent
- $2,658 high interval (Pro) →
- Mortgage (P&I)
- −$1,704
- Tax from tax record
- −$198 /mo · $2,377/yr
- Insurance
- −$135
- HOA
- −$80
- Vacancy / Maint / Mgmt
- −$558
- Net cashflow
- $-18
Break-even live
UW: 25.0% down · 7.5% · 30yr · 1.5% tax · 5.0% vac · 8.0% maint · 8.0% mgmt
Financing live
Cash to close
- Down payment
- $81,250
- Closing costs
- $9,750
- Reserves months
- —
- Total cash needed
- —
Loan-product check · same deal, 3 products live
Conventional
25% down · 7.5% · 30yr
- Down + closing
- —
- Monthly P&I
- —
- Monthly cashflow
- —
- DSCR
- —
- Eligible?
- —
Personal DTI + credit; lowest rate.
DSCR
20% down · 8.5% · 30yr
- Down + closing
- —
- Monthly P&I
- —
- Monthly cashflow
- —
- DSCR
- —
- Eligible?
- —
No personal income docs; deal must DSCR.
Hard money
10% down · 12.0% · 12mo
- Down + closing
- —
- Monthly P&I
- —
- Monthly cashflow
- —
- DSCR
- —
- Eligible?
- —
Short-term bridge; refi at stabilization.
Rent comps 10 comps
| Address | Beds | Baths | Sqft | Rent | $/sqft | DOM | Units | Dist |
|---|---|---|---|---|---|---|---|---|
| 5154 Armina Pl Fort Pierce, FL | 3.0 | 2.0 | 1477 | $2,350 | $1.59 | 13d | 1 | 0.25mi |
| 5082 Armina Pl Fort Pierce, FL | 3.0 | 2.0 | 1464 | $3,000 | $2.05 | 23d | 1 | 0.25mi |
| 5226 Armina Pl Fort Pierce, FL | 4.0 | 2.0 | 2003 | $2,950 | $1.47 | 21d | 1 | 0.32mi |
| 8674 Pavia St Fort Pierce, FL | 4.0 | 2.0 | 1824 | $2,600 | $1.43 | 21d | 1 | 0.57mi |
| 5234 Oakland Lake Cir Fort Pierce, FL | 3.0 | 2.0 | 1460 | $2,300 | $1.58 | 13d | 1 | 0.92mi |
| 7704 Pacific Ave Fort Pierce, FL | 3.0 | 2.0 | 1719 | $2,500 | $1.45 | 13d | 1 | 1.18mi |
| 6602 Palomar Pkwy Unit A Fort Pierce, FL | 3.0 | 1.0 | 1200 | $2,000 | $1.67 | 23d | 1 | 1.34mi |
| 5010 Killarney Ave Unit A Fort Pierce, FL | 2.0 | 1.0 | 1720 | $1,500 | $0.87 | 23d | 1 | 1.35mi |
| 7403 Winter Garden Pkwy Fort Pierce, FL | 3.0 | 2.0 | 1372 | $2,200 | $1.60 | 21d | 1 | 1.42mi |
| 5510 Shannon Dr Fort Pierce, FL | 3.0 | 2.0 | 1594 | $2,350 | $1.47 | 13d | 1 | 1.46mi |
HOA detail
- Monthly dues
- $80 · $960/yr
- Likely covers
- waterpool
Listing history 10 events
-
2026-04-27status Pending
-
2026-04-10price $325,000
-
2026-03-12price $328,772
-
2026-03-04price $322,772
-
2026-02-23price $332,722
-
2026-01-31price $314,772
-
2026-01-31status Active
-
2026-01-24price $343,722
-
2026-01-24historical Active Under Contract
-
2025-12-28$339,772 Active
ⓘ Source: listings_history table (triggers on properties + properties_extension) + one-shot
backfill from property_details.listing_events for pre-trigger history.
Tax reassessment forecast FL · Resets to sale price
- Current annual tax
- $2,377 · $198/mo
- Projected year-2 tax
- $2,698 · $225/mo
- Expected delta
- +$321/yr (+$27/mo · 13.5%)
ⓘ Screening estimate from a state-policy table — verify with the county assessor before closing.
Climate risk First Street
- Flood 1/10 Low FEMA zone X (unshaded) · 0% chance over 30 yrs
- Wildfire 3/10 Moderate
- Heat 10/10 Extreme 7 d/yr ≥107°F today · 24 d/yr by 30 yrs out
- Wind 10/10 Extreme 99% chance of damaging wind over 30 yrs
- Air quality 1/10 Low 0 unhealthy d/yr today · 0 by 30 yrs out
Nearby sold comps map
Loading sold comps map…
Walkable amenities ~0.75 mi
Loading nearby amenities…
Taxation est. · year 1
- Rental income
- $31,893
- − Mortgage interest
- −$18,205
- − Property taxes
- −$2,377
- − Insurance
- −$1,625
- − Repairs & maintenance
- −$2,551
- − Management
- −$2,551
- − HOA
- −$960
- − Depreciation
- −$9,455
- Taxable loss
- −$5,832
- Est. tax savings @ 24.0%
- +$1,400
- After-tax cash flow
- $1,181/yr
For passive investors: Depreciation is non-cash, so a rental often shows a tax loss while cash-flowing — sheltering income. Rental losses are passive: they offset passive income freely, and up to $25,000/yr can offset ordinary (W-2) income if you actively participate and your MAGI is under $100k (phasing out to $0 by $150k); unused losses carry forward. On sale, claimed depreciation is recaptured at up to 25%, and gains may owe capital-gains tax (a 1031 exchange can defer both). Figures are a year-1 estimate at your 24.0% rate — not tax advice; consult a CPA.
Schools (NCES district)
- District
- St. Lucie
- NCES district ID
- 1201770
- Math proficiency
- 40% ▼ -11.00%
- Reading proficiency
- 48% ▼ -4.00%
- Median HH income
- $44,737
- Composite
- 37.28/100
- National rank
- #4449
- State rank
- #51 of 73 in FL
Livability — Lakewood Park
- Score
- 63/100
- State rank
- #719
- US rank
- #15407
Category grades
Schools grade is shown separately in the Schools card above.
Census & demographics
- County
- Saint Lucie County · 337,150 people
- Metro
- Port St. Lucie, FL
- Population (ZIP)
- 17,148
- Household income
- $63,122
- Rent vs Own
- Severe rent burden
- 140.0
Population outlook (St. Lucie County) Hauer SSP2
- Today (2025)
- 338,016 people
- By 2030
- 355,687 · +5.2%
- By 2040
- 385,521 · +14.1%
- By 2050
- 406,106 · +20.1%
- By 2075
- 441,054 · +30.5%
- By 2100
- 436,885 · +29.2%
Race, ethnicity, and origin ACS 2023
- Neighborhood character
- Predominantly White (74%)
- Race & ethnicity
- White 74% Black 13% Hispanic / Latino 8% Two or more races 7% Asian 2%
- Hispanic origin (detail)
- Mexican 2% Puerto Rican 2% Cuban 2%
- Common ancestry
- Romanian 3% Italian 2% Lithuanian 2%
- Foreign-born
- 10% · Canada, Jamaica, Vietnam
- Languages at home
- 88% English-only · Spanish 7% French/Haitian/Cajun 3% Vietnamese 1%
Political lean MEDSL · St. Lucie
- 2024 margin
- Lean R (+9.1) · D 45.1% · R 54.2%
- 2008→2024 swing
- -21.2pp toward R · 2008: 12.1pp · 2024: -9.1pp
- All cycles
- 2024: R+9.1 2020: R+1.6 2016: R+2.5 2012: D+7.9 2008: D+12.1
Not yet ingested
- Civics
- —
Market trends
- HPI YoY
- ▼ -106.06%
- Current HPI
- 343.1376
- Rent YoY
- —
- Metro
- Port St. Lucie, FL
- State GDP YoY
- ▲ 3.28%
- F500 in state
- 36
Industry mix (Fortune 500 HQ in FL)
| Industry | F500 HQs | Revenue |
|---|---|---|
| Industrial Technology | 2 | $29B |
|
||
| Insurance | 2 | $17B |
|
||
| Retail | 1 | $60B |
|
||
| Technology Distribution | 1 | $58B |
|
||
| Homebuilding | 1 | $35B |
|
||
| Technology Manufacturing | 1 | $35B |
|
||
Price history
-4.3% since first listed10 events — show timeline
- 2026-04-27 Pending — Beaches MLS
- 2026-04-10 Price Changed $325,000 Beaches MLS
- 2026-03-12 Price Changed $328,772 Beaches MLS
- 2026-03-04 Price Changed $322,772 Beaches MLS
- 2026-02-23 Price Changed $332,722 Beaches MLS
- 2026-01-31 Price Changed $314,772 Beaches MLS
- 2026-01-31 Relisted — Beaches MLS
- 2026-01-24 Price Changed $343,722 Beaches MLS
- 2026-01-24 Contingent — Beaches MLS
- 2025-12-28 Listed $339,772 Beaches MLS
Property tax history
+4.5%/yrLatest (2025): $2,377 · +3.6% YoY. Source: county tax records.
Cash-flow waterfall
monthlySold comps — $/sqft
last 12 mo · ≤1 miLoading sold comps…