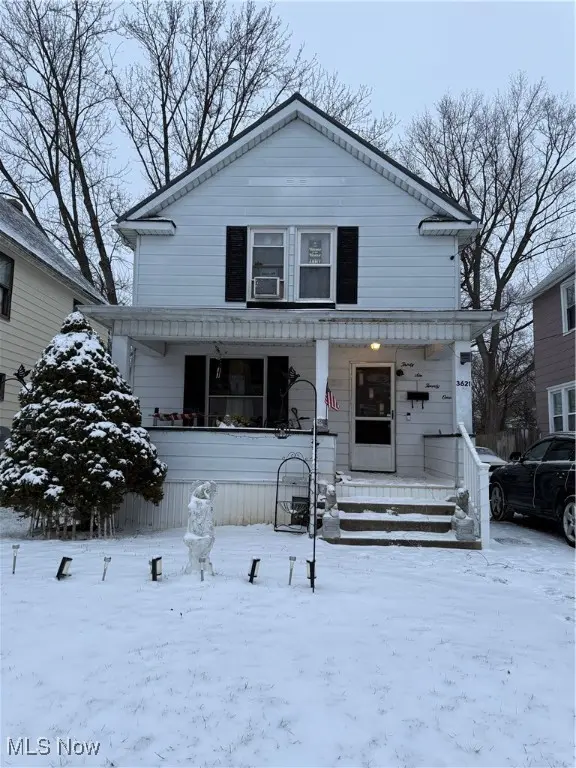
3621 Neilson Ave · Youngstown, OH
Flood risk 1/10 · Minimal
- FEMA flood zone
- X (unshaded)
- Chance of flooding over 30 yrs
- 0.0%
- Est. flood insurance / yr
- $473 – $860
Fire risk 1/10 · Minimal
- Est. fire insurance / yr
- $713 – $1,323
Heat risk 3/10 · Minor
- Hot days now (above 97°F)
- 7 days/yr
- Hot days in 30 yrs
- 17 days/yr
Wind risk 1/10 · Minimal
- Chance of severe wind over 30 yrs
- —
Air-quality risk 3/10 · Minor
- Unhealthy air days now
- 1 days/yr
- Unhealthy air days in 30 yrs
- 4 days/yr
Risk factors via First Street. Map © Google.
Why this score? — see what drove the B grade
The composite is a weighted blend of 9 inputs, each scored 0–100. Each bar is that input's sub-score; the figure is the points it added to the 100-point composite (weight × sub-score).
- Cash flow +30.0/30.0
- 1% rule +10.0/10.0
- DSCR +10.0/10.0
- ARV discount +7.5/15.0
- Appreciation +5.9/10.0
- Livability +4.0/5.0
- Rent growth +2.5/5.0
- Condition / age +2.5/5.0
- Schools +0.9/10.0
$49,900
🖨 Deal sheet (PDF) 📄 Offer letter ✓ Due diligence
Listing remarks MLS
Large bedrooms, 1 & 1/2 baths! Newer Breaker box & 220 line to 2 car garage. Newer Forced air furnace, Hot water tank & Water lines had been replaced. Needs repairs so price has been lowered to current price. Seller will look at creatitive financing with a down payment. Land Contract is possible. Blacktop driveway. Beautiful original woodwork and large foyer. Motivated Seller.
Key facts
- 5,009 sq ft lot
- 2 garage spots
- Built 1917
Property features AI
Finance
- Financial info: Annual tax information available (excluded per instructions)
Exterior
- Parking: Detached paved garage; 2 garage spaces
- Utilities: Public water; Public sewer
- Home design: 2-story home; Faces west
- Construction: Aluminum and wood siding; Asphalt/fiberglass roof; Built (year per public records)
- Exterior features: Patio; Porch; Partial fencing; Irregular lot measuring approximately 40 x 125
Interior
- Bedrooms: Total of 5 rooms (includes bedrooms and living areas)
- Bathrooms: 1 full bathroom
- Heating & cooling: Forced air gas heating; Window AC units
- Interior features: Full basement
Neighborhood map
What this means for you Summary
Snapshot
- This is a 2-bed/1.0-bath single-family listed at $50k.
Deal economics
- At list price, monthly cash flow is $673 ($8k/yr) — positive.
- The deal already cash-flows at list — no discount required.
- Meets the 1% rule at list price ($1k rent vs $50k).
- Recommended offer: $44k (12.0% below list) — sets the bar for market timing.
- Cap rate 22.5% vs local median 7.0% in Youngstown — top-decile yield for the area; either an underpriced asset or a hidden risk that comps aren't pricing in. Stress-test before assuming the spread holds.
Location & tenants
- Location reads 81/100 on livability (#99 in OH, #1,506 nationally) — a professional / high-income tenant draw. Strengths: amenities A+, commute A+, cost of living A+; Watch: crime F, employment F.
- Youngstown City (urban): math 8% / reading 17% proficiency, ranked #649 of 656 in OH (top 99%) — low school quality limits family demand, transient renter base, plan for 1-2y turnover; 88% free/reduced lunch — lower-income household profile, screen leases tightly.
- Market conditions: 45 active listings in the ZIP; 7 comparable units currently listed for rent nearby; rentals at typical pace (median 22d on market — plan ~3-4 weeks tenant-placement turnaround); 43% of comp listings sitting > 30 days — soft ceiling on asking rent; lower-income renter base — watch delinquency; 147 units permitted in Mahoning County in 2024 (0 in 5+ unit buildings).
- At $1,250/mo this rent would consume 48% of the median local household income ($31k/yr) (locally 566% of renters already pay >50% of income on rent) — very limited rent-growth headroom before tenants either downsize or default.
Forward outlook
- In year one you build about $1k of equity ($345 loan paydown + $886 appreciation (1.8% local appreciation)).
- Mahoning County population projected at -14% by 2050 — secular population decline; favor cash flow + early exit over multi-decade hold.
- At projected returns (1.8% appreciation + 3.0% rent growth), your $14k cash investment doubles in ~2 years — after that, you're playing with house money.
Negotiation context
- It's been on market 154 days — a 12% lower offer ($44k) is reasonable based on typical stale-listing flexibility.
- 2 sale attempts since 16y ago with the ask held roughly flat each time — persistent listings suggest the price (not the market) is what's stuck; bring a comps-based counter.
- Current owner paid $15k; list at $50k implies a 233% gain — meaningful room to come down on a strong offer.
Risks & watch-outs
- Watch-outs: built in 1917 — expect roof / HVAC / electrical / plumbing capex.
Questions for the listing agent
- It's been on market 154 days. Have you received any prior offers? Is the seller open to a 12% concession, seller financing, or rate buy-down credit?
- Built in 1917 — when were the roof, HVAC, electrical panel, plumbing, and water heater last replaced?
- Why hasn't it sold? Are there any deal-killer items the seller is aware of (foundation, flood, title, zoning, code violations)?
- Is there a deadline driving the sale (1031 exchange, divorce, estate, relocation)? That informs how much negotiation room exists.
- Crime grade is F in this area — have there been break-ins, vandalism, or insurance claims at this property in the last 3 years? What carrier currently insures it and at what premium?
- What's the average days-on-market for RENTAL listings here right now (not sales)? A rising rental-DOM trend means longer vacancies and softer asking-rent achievability than the comps imply.
- What's the recent tenant-quality profile in this submarket — average credit score on applications, eviction rate, late-payment / NSF rate, and stable-employment percentage? A property-management company in the area should have these aggregated.
- How much new for-sale + rental construction is in the pipeline within 1–3 miles? Heavy new supply typically softens prices + rents 12–24 months out; constrained supply supports both.
Investment metrics
- 1% rule
- 2.51% ✓
- Cap rate
- 22.47%
- Cash-on-cash
- 57.78%
- DSCR
- 3.57
- GRM
- 3.3
CMA / ARV
- ARV (on-the-fly)
- $116,480
- Comps found
- 12
Show comp detail 12 sales within ~0.75 mi
| Address | Dist | Beds/Ba | Sqft | Sold | Price | $/sf | Match |
|---|---|---|---|---|---|---|---|
| 1925 Weston Ave | 0.44mi | 3/1.0 (+1) | 1,227 (+10%) | 1mo | $89,000 | $73 | 58 |
| 2510 E Midlothian Blvd | 0.45mi | 2/2.0 | 1,016 (-9%) | 3mo | $107,500 | $106 | 57 |
| 1633 Everett Ave | 0.49mi | 3/1.0 (+1) | 1,202 (+7%) | 5mo | $125,000 | $104 | 56 |
| 1562 Medford Ave | 0.65mi | 3/1.0 (+1) | 1,170 (+4%) | 3mo | $129,156 | $110 | 55 |
| 2002 Bancroft Ave | 0.64mi | 3/2.0 (+1) | 1,080 (-4%) | 4mo | $131,500 | $122 | 51 |
| 612 Maplewood Ave | 0.71mi | 3/1.0 (+1) | 1,056 (-6%) | 3mo | $135,000 | $128 | 50 |
| 417 9th St | 0.49mi | 3/1.0 (+1) | 1,260 (+12%) | 2mo | $93,000 | $74 | 50 |
| 3006 Shirley Rd | 0.62mi | 3/2.0 (+1) | 1,020 (-9%) | 0mo | $105,000 | $103 | 47 |
| 515 Lincoln Ave | 0.57mi | 3/2.0 (+1) | 984 (-12%) | 1mo | $179,900 | $183 | 44 |
| 2743 Mount Vernon Ave | 0.65mi | 3/1.0 (+1) | 1,248 (+11%) | 4mo | $65,000 | $52 | 42 |
| 1321 Detroit Ave | 0.68mi | 3/2.0 (+1) | 1,001 (-11%) | 2mo | $60,000 | $60 | 40 |
| 2692 Taft Ave | 0.74mi | 3/1.0 (+1) | 990 (-12%) | 3mo | $30,000 | $30 | 39 |
Match score weights: distance 35% · size 25% · config 20% · recency 20%. Top-matched comps best support the ARV.
Projected returns pro-forma
1.78% appreciation · 3.0% rent growth · sell at horizon
- IRR
- 61.4%
- Equity multiple
- 4.27×
- Total profit
- $45,706
- Equity at exit
- $19,082
- IRR
- 62.0%
- Equity multiple
- 8.64×
- Total profit
- $106,794
- Equity at exit
- $27,024
Cash invested: $13,972 (down + closing). Projections, not guarantees.
Landlord ↔ Tenant lean methodology
- Overall (STATE)
- 73 Landlord-Friendly
- State Ohio
- 73 Landlord-Friendly · R+6
- County
- — inherits STATE
- City
- — inherits STATE
ZIP-level market 44502
- Home prices YoY
- 0.7%
- Active inventory
- 45
- Price-to-rent
- 3.3×
Monthly cashflow live
- Estimated rent
- $1,250 high interval (Pro) →
- Mortgage (P&I)
- −$262
- Tax from tax record
- −$32 /mo · $390/yr
- Insurance
- −$21
- HOA
- −$0
- Vacancy / Maint / Mgmt
- −$263
- Net cashflow
- $673
Break-even live
Sensitivity live
| Price | -10% $701 | -5% $687 | +0% $673 | +5% $659 | +10% $645 |
|---|---|---|---|---|---|
| Rent | -10% $574 | -5% $623 | +0% $673 | +5% $722 | +10% $772 |
| Rate | -1.0pp $698 | -0.5pp $685 | base $673 | +0.5pp $660 | +1.0pp $647 |
UW: 25.0% down · 7.5% · 30yr · 1.5% tax · 5.0% vac · 8.0% maint · 8.0% mgmt
Financing live
Cash to close
- Down payment
- $12,475
- Closing costs
- $1,497
- Reserves months
- —
- Total cash needed
- —
Loan-product check · same deal, 3 products live
Conventional
25% down · 7.5% · 30yr
- Down + closing
- —
- Monthly P&I
- —
- Monthly cashflow
- —
- DSCR
- —
- Eligible?
- —
Personal DTI + credit; lowest rate.
DSCR
20% down · 8.5% · 30yr
- Down + closing
- —
- Monthly P&I
- —
- Monthly cashflow
- —
- DSCR
- —
- Eligible?
- —
No personal income docs; deal must DSCR.
Hard money
10% down · 12.0% · 12mo
- Down + closing
- —
- Monthly P&I
- —
- Monthly cashflow
- —
- DSCR
- —
- Eligible?
- —
Short-term bridge; refi at stabilization.
Rent comps 7 comps
| Address | Beds | Baths | Sqft | Rent | $/sqft | DOM | Units | Dist |
|---|---|---|---|---|---|---|---|---|
| 1914 S Heights Ave Youngstown, OH | 3.0 | 1.0 | 1115 | $1,950 | $1.75 | 44d | 1 | 0.18mi |
| 1803 Pointview Ave Youngstown, OH | 2.0 | 1.0 | 950 | $1,000 | $1.05 | 44d | 1 | 0.23mi |
| 2002 Brownlee Ave Youngstown, OH | 1.0 | 1.0 | 820 | $875 | $1.07 | 44d | 1 | 0.48mi |
| 2523 E Midlothian Blvd Apt 5 Struthers, OH | 2.0 | 1.0 | 750 | $800 | $1.07 | 14d | 1 | 0.53mi |
| 610 Elm St Struthers, OH | 3.0 | 1.0 | 1050 | $1,500 | $1.43 | 14d | 1 | 0.63mi |
| 834 E Midlothian Blvd Youngstown, OH | 1.0 | 1.0 | 708 | $750 | $1.06 | 14d | 1 | 1.19mi |
| 512 E Philadelphia Ave Unit 1 Youngstown, OH | 2.0 | 1.0 | 1200 | $899 | $0.75 | 22d | 1 | 1.49mi |
Listing history 20 events
-
2026-06-19days on market $49,900 Active 154 DOM
-
2026-06-18days on market $49,900 Active 153 DOM
-
2026-06-17days on market $49,900 Active 152 DOM
-
2026-06-16days on market $49,900 Active 151 DOM
-
2026-06-15days on market $49,900 Active 150 DOM
-
2026-06-14days on market $49,900 Active 148 DOM
-
2026-06-13days on market $49,900 Active 147 DOM
-
2026-06-10days on market $49,900 Active 145 DOM
-
2026-06-09days on market $49,900 Active 144 DOM
-
2026-06-08days on market $49,900 Active 143 DOM
-
2026-06-07days on market $49,900 Active 142 DOM
-
2026-06-03days on market $49,900 Active 138 DOM
-
2026-06-02days on market $49,900 Active 137 DOM
-
2026-06-01days on market $49,900 Active 136 DOM
-
2026-05-31days on market $49,900 Active 135 DOM
-
2026-05-30days on market $49,900 Active 134 DOM
-
2026-01-16$49,900 Active
-
2011-04-05soldstatus $15,000
-
2011-04-04soldstatus $15,000 397-char remark
Show marketing remark (397 chars)
Large bedrooms, 1 & 1/2 baths! Newer Breaker box & 220 line to 2 car garage. Newer Forced air furnace, Hot water tank & Water lines had been replaced. Needs repairs so price has been lowered to current price. Seller will look at creatitive financing with a down payment. Land Contract is possible. Blacktop driveway. Beautiful original woodwork and large foyer. Motivated Seller.
-
2010-10-04$15,000 397-char remark
Show marketing remark (397 chars)
Large bedrooms, 1 & 1/2 baths! Newer Breaker box & 220 line to 2 car garage. Newer Forced air furnace, Hot water tank & Water lines had been replaced. Needs repairs so price has been lowered to current price. Seller will look at creatitive financing with a down payment. Land Contract is possible. Blacktop driveway. Beautiful original woodwork and large foyer. Motivated Seller.
ⓘ Source: listings_history table (triggers on properties + properties_extension) + one-shot
backfill from property_details.listing_events for pre-trigger history.
Tax reassessment forecast OH · Partial reset (capped growth)
- Current annual tax
- $390 · $32/mo
- Projected year-2 tax
- $584 · $49/mo
- Expected delta
- +$194/yr (+$16/mo · 49.8%)
ⓘ Screening estimate from a state-policy table — verify with the county assessor before closing.
Climate risk First Street
- Flood 1/10 Low FEMA zone X (unshaded) · 0% chance over 30 yrs
- Wildfire 1/10 Low
- Heat 3/10 Moderate 7 d/yr ≥97°F today · 17 d/yr by 30 yrs out
- Wind 1/10 Low
- Air quality 3/10 Moderate 1 unhealthy d/yr today · 4 by 30 yrs out
Nearby sold comps map
Loading sold comps map…
Walkable amenities ~0.75 mi
Loading nearby amenities…
Taxation est. · year 1
- Rental income
- $15,003
- − Mortgage interest
- −$2,795
- − Property taxes
- −$390
- − Insurance
- −$250
- − Repairs & maintenance
- −$1,200
- − Management
- −$1,200
- − Depreciation
- −$1,452
- Taxable income
- $7,717
- Est. tax owed @ 24.0%
- −$1,852
- After-tax cash flow
- $6,221/yr
For passive investors: Depreciation is non-cash, so a rental often shows a tax loss while cash-flowing — sheltering income. Rental losses are passive: they offset passive income freely, and up to $25,000/yr can offset ordinary (W-2) income if you actively participate and your MAGI is under $100k (phasing out to $0 by $150k); unused losses carry forward. On sale, claimed depreciation is recaptured at up to 25%, and gains may owe capital-gains tax (a 1031 exchange can defer both). Figures are a year-1 estimate at your 24.0% rate — not tax advice; consult a CPA.
Schools (NCES district)
- District
- Youngstown City
- NCES district ID
- 3904516
- Math proficiency
- 8% ▼ -15.00%
- Reading proficiency
- 17% ▼ -10.00%
- Median HH income
- $25,257
- Composite
- 9.29/100
- National rank
- #9858
- State rank
- #649 of 656 in OH
Livability — Youngstown
- Score
- 81/100
- State rank
- #99
- US rank
- #1506
Category grades
Schools grade is shown separately in the Schools card above.
Census & demographics
- Census place
- Youngstown, OH
- County
- Mahoning County · 84,956 people
- City population
- 28,503
- Metro
- Youngstown-Warren-Boardman, OH-PA
- Population (ZIP)
- 9,594
- Household income
- $31,170
- Rent vs Own
- Severe rent burden
- 566.0
Population outlook (Mahoning County) Hauer SSP2
- Today (2025)
- 223,932 people
- By 2030
- 218,387 · -2.5%
- By 2040
- 205,367 · -8.3%
- By 2050
- 193,606 · -13.5%
- By 2075
- 173,694 · -22.4%
- By 2100
- 151,147 · -32.5%
Race, ethnicity, and origin ACS 2023
- Neighborhood character
- Diverse neighborhood (Simpson 0.67)
- Race & ethnicity
- White 44% Black 35% Two or more races 12% Hispanic / Latino 11%
- Hispanic origin (detail)
- Mexican 1% Puerto Rican 9%
- Common ancestry
- Romanian 2% Serbian 1% Iranian 1%
- Foreign-born
- 4% · Canada
- Languages at home
- 91% English-only · Spanish 6% Other Indo-European 1% Arabic 1%
Political lean MEDSL · Mahoning
- 2024 margin
- Lean R (+9.4) · D 44.9% · R 54.4%
- 2008→2024 swing
- -36.1pp toward R · 2008: 26.6pp · 2024: -9.4pp
- All cycles
- 2024: R+9.4 2020: R+1.9 2016: D+3.0 2012: D+27.7 2008: D+26.6
Not yet ingested
- Civics
- —
Market trends
- HPI YoY
- ▲ 1.78%
- Current HPI
- 246.2163
- Rent YoY
- —
- Metro
- Youngstown-Warren-Boardman, OH-PA
- State GDP YoY
- ▲ 1.98%
- F500 in state
- 48
Industry mix (Fortune 500 HQ in OH)
| Industry | F500 HQs | Revenue |
|---|---|---|
| Insurance | 3 | $145B |
|
||
| Industrial Machinery | 3 | $49B |
|
||
| Financial Services | 3 | $24B |
|
||
| Consumer Goods | 2 | $93B |
|
||
| Aerospace / Defense | 2 | $47B |
|
||
| Utilities | 2 | $33B |
|
||
Price history
+232.7% since first listed4 events — show timeline
- 2026-01-16 Listed $49,900 MLSNOW
- 2011-04-05 Sold (Public Records) $15,000 Public Records
- 2011-04-04 Sold (MLS) $15,000 MLSNOW
- 2010-10-04 Listed $15,000 MLSNOW
Property tax history
-0.9%/yrLatest (2025): $390 · -11.8% YoY. Source: county tax records.
Cash-flow waterfall
monthlySold comps — $/sqft
last 12 mo · ≤1 miLoading sold comps…