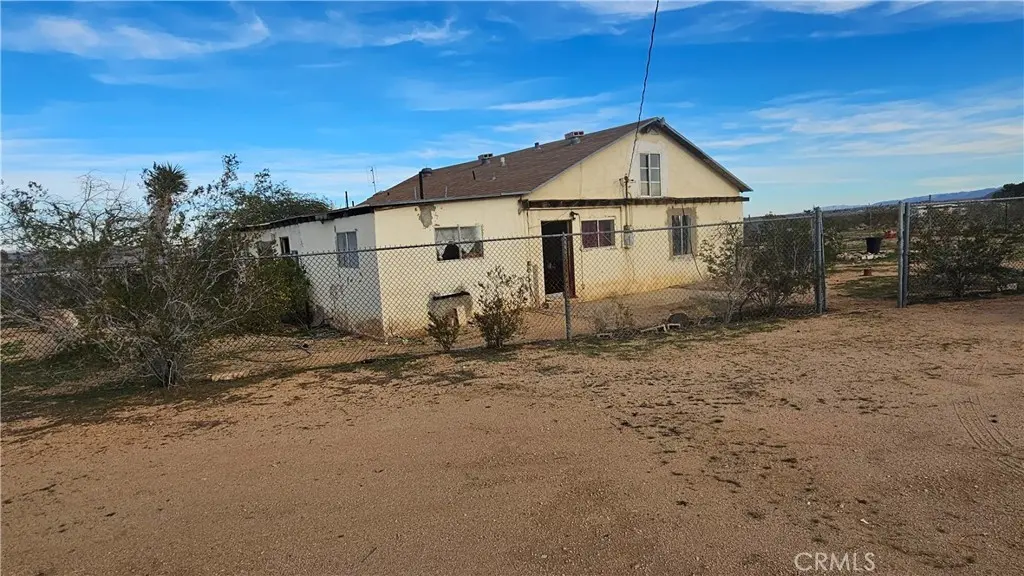
56727 Cone Blvd · Homestead Valley, CA
Flood risk 1/10 · Minimal
- FEMA flood zone
- D
- Chance of flooding over 30 yrs
- 0.0%
- Est. flood insurance / yr
- $544 – $1,084
Fire risk 4/10 · Minor
- Est. fire insurance / yr
- $659 – $1,223
Heat risk 7/10 · Major
- Hot days now (above 101°F)
- 8 days/yr
- Hot days in 30 yrs
- 24 days/yr
Wind risk 1/10 · Minimal
- Chance of severe wind over 30 yrs
- —
Air-quality risk 5/10 · Moderate
- Unhealthy air days now
- 7 days/yr
- Unhealthy air days in 30 yrs
- 10 days/yr
Risk factors via First Street. Map © Google.
Why this score? — see what drove the C+ grade
The composite is a weighted blend of 9 inputs, each scored 0–100. Each bar is that input's sub-score; the figure is the points it added to the 100-point composite (weight × sub-score).
- Cash flow +17.1/30.0
- ARV discount +15.0/15.0
- Appreciation +10.0/10.0
- DSCR +5.3/10.0
- 1% rule +3.4/10.0
- Rent growth +2.5/5.0
- Livability +2.5/5.0
- Condition / age +2.5/5.0
- Schools +2.2/10.0
$290,000
🖨 Deal sheet 📄 Offer letter ✓ Due diligence
Listing remarks MLS
Welcome To Cone Ranch Surrounded By Serene Tranquility Of The Desert In Peaceful Landers, With 5 Acres Of Private Land, Views Of The Wonderous Mountain Ranges, And Secluded Giving You The Feel Of Your Own Personal Retreat. Featuring Flat Ample Space, This Home Has 4 Bedrooms (2 Of Which Appear To Be Additions), 2 Full Bathrooms, Open Kitchen, Living Room, And Family Room. The Cone Ranch Has Public Water, Septic, And Propane Gas While Most Of The Cone Ranch Is Fenced And Has A Driveway Next To The Home With Outdoor Patio In Back. Single Story Home, Interior Has Carpet And Tiling, Roof Appears To Be In Good Shape, While Exterior And Interior Spaces Need Attention. There Is What Appears To Be An ADU In The Back. Garage Has Since Been Taken Down But Concrete Pad Still Available For Building/Replacement. San Bernardino County RL (Rural Living) Zoned Which Is 2.5 Acres Per Residential Unit. Ideal For Investors, Developers, Handy Persons That Are Looking For Sprawling Land And SFR To Create Their Own Vision Into Reality!
Key facts
- Propane gas
- Septic
- Flat ample space
Tags
Neighborhood map
What this means for you Summary
Snapshot
- This is a 4-bed/2.0-bath single-family listed at $290k.
Deal economics
- At list price, monthly cash flow is $204 ($2k/yr) — positive.
- The deal already cash-flows at list — no discount required.
- To meet the 1% rule (rent ≥ 1% of price), the offer needs to be $245k (15.6% below list).
- Recommended offer: $245k (15.6% below list) — sets the bar for 1% rule.
- Cap rate 7.1% vs local median 3.7% in Homestead Valley — top-decile yield for the area; either an underpriced asset or a hidden risk that comps aren't pricing in. Stress-test before assuming the spread holds.
Location & tenants
- Location reads 49/100 on livability (#1,167 in CA) — a working-class tenant base; expect higher turnover. Strengths: housing A+; Watch: schools F, amenities F, commute F.
- Morongo Unified (town): math 15% / reading 38% proficiency, ranked #395 of 517 in CA (top 76%) — low school quality limits family demand, transient renter base, plan for 1-2y turnover.
- Market conditions: 196 active listings in the ZIP; 5,458 units permitted in San Bernardino County in 2024 (1,500 in 5+ unit buildings).
Forward outlook
- In year one you build about $31k of equity ($2k loan paydown + $29k appreciation (10.0% local appreciation)).
- San Bernardino County population projected at +15% by 2050 — modest demand growth; plan on rents tracking national, not racing it.
- At projected returns (10.0% appreciation + 3.0% rent growth), your $81k cash investment doubles in ~3 years — after that, you're playing with house money.
- By year 2, paydown + projected appreciation supports a ~$50k cash-out refi (75% LTV) — recoverable capital for the next deal without selling this one.
Negotiation context
- It's been on market 141 days — a 12% lower offer ($255k) is reasonable based on typical stale-listing flexibility.
- Current owner paid $50k; list at $290k implies a 480% gain — meaningful room to come down on a strong offer.
Risks & watch-outs
- Watch-outs: built in 1958 — expect roof / HVAC / electrical / plumbing capex.
- Climate carrying-cost: extreme-heat days projected 8→24/yr by 2055 (HVAC capex compounding) — expect insurance premiums to compound above CPI over the hold.
Questions for the listing agent
- It's been on market 141 days. Have you received any prior offers? Is the seller open to a 16% concession, seller financing, or rate buy-down credit?
- Built in 1958 — when were the roof, HVAC, electrical panel, plumbing, and water heater last replaced?
- Why hasn't it sold? Are there any deal-killer items the seller is aware of (foundation, flood, title, zoning, code violations)?
- Is there a deadline driving the sale (1031 exchange, divorce, estate, relocation)? That informs how much negotiation room exists.
- Schools are F-rated, which usually means shorter tenancies and higher turnover. Who's the typical renter profile here, and what's been the actual vacancy rate?
- What's the average days-on-market for RENTAL listings here right now (not sales)? A rising rental-DOM trend means longer vacancies and softer asking-rent achievability than the comps imply.
- What's the recent tenant-quality profile in this submarket — average credit score on applications, eviction rate, late-payment / NSF rate, and stable-employment percentage? A property-management company in the area should have these aggregated.
- How much new for-sale + rental construction is in the pipeline within 1–3 miles? Heavy new supply typically softens prices + rents 12–24 months out; constrained supply supports both.
Investment metrics
- 1% rule
- 0.84% ✗
- Cap rate
- 7.14%
- Cash-on-cash
- 3.01%
- DSCR
- 1.13
- GRM
- 9.9
CMA / ARV
- ARV (median comp)
- $402,090
- List price
- $290,000
- Delta
- -27.88%
- Verdict
- UNDERPRICED
- Comps
- 3 within 1.0 mi
Projected returns pro-forma
10.0% appreciation · 3.0% rent growth · sell at horizon
- IRR
- 26.4%
- Equity multiple
- 3.10×
- Total profit
- $170,782
- Equity at exit
- $261,255
- IRR
- 23.2%
- Equity multiple
- 7.06×
- Total profit
- $492,464
- Equity at exit
- $563,406
Cash invested: $81,200 (down + closing). Projections, not guarantees.
Landlord ↔ Tenant lean methodology
- Overall (STATE)
- 18 Strongly Tenant-Friendly
- State California
- 18 Strongly Tenant-Friendly · D+13
- County
- — inherits STATE
- City
- — inherits STATE
ZIP-level market 92285
- Home prices YoY
- 31.4%
- Active inventory
- 196
- Price-to-rent
- 9.9×
Monthly cashflow live
- Estimated rent
- $2,449 medium interval (Pro) →
- Mortgage (P&I)
- −$1,521
- Tax from tax record
- −$89 /mo · $1,070/yr
- Insurance
- −$121
- HOA
- −$0
- Vacancy / Maint / Mgmt
- −$514
- Net cashflow
- $204
Break-even live
UW: 25.0% down · 7.5% · 30yr · 1.5% tax · 5.0% vac · 8.0% maint · 8.0% mgmt
Financing live
Cash to close
- Down payment
- $72,500
- Closing costs
- $8,700
- Reserves months
- —
- Total cash needed
- —
Loan-product check · same deal, 3 products live
Conventional
25% down · 7.5% · 30yr
- Down + closing
- —
- Monthly P&I
- —
- Monthly cashflow
- —
- DSCR
- —
- Eligible?
- —
Personal DTI + credit; lowest rate.
DSCR
20% down · 8.5% · 30yr
- Down + closing
- —
- Monthly P&I
- —
- Monthly cashflow
- —
- DSCR
- —
- Eligible?
- —
No personal income docs; deal must DSCR.
Hard money
10% down · 12.0% · 12mo
- Down + closing
- —
- Monthly P&I
- —
- Monthly cashflow
- —
- DSCR
- —
- Eligible?
- —
Short-term bridge; refi at stabilization.
Listing history 16 events
-
2026-06-18days on market $290,000 Active 141 DOM
-
2026-06-17days on market $290,000 Active 140 DOM
-
2026-06-16days on market $290,000 Active 139 DOM
-
2026-06-15days on market $290,000 Active 138 DOM
-
2026-06-13days on market $290,000 Active 136 DOM
-
2026-06-13days on market $290,000 Active 135 DOM
-
2026-06-09days on market $290,000 Active 132 DOM
-
2026-06-08days on market $290,000 Active 131 DOM
-
2026-06-07days on market $290,000 Active 130 DOM
-
2026-06-04days on market $290,000 Active 127 DOM
-
2026-06-03days on market $290,000 Active 126 DOM
-
2026-06-02days on market $290,000 Active 125 DOM
-
2026-06-01days on market $290,000 Active 124 DOM
-
2026-05-31days on market $290,000 Active 123 DOM
-
2026-01-28$290,000 Active 1029-char remark
Show marketing remark (1029 chars)
Welcome To Cone Ranch Surrounded By Serene Tranquility Of The Desert In Peaceful Landers, With 5 Acres Of Private Land, Views Of The Wonderous Mountain Ranges, And Secluded Giving You The Feel Of Your Own Personal Retreat. Featuring Flat Ample Space, This Home Has 4 Bedrooms (2 Of Which Appear To Be Additions), 2 Full Bathrooms, Open Kitchen, Living Room, And Family Room. The Cone Ranch Has Public Water, Septic, And Propane Gas While Most Of The Cone Ranch Is Fenced And Has A Driveway Next To The Home With Outdoor Patio In Back. Single Story Home, Interior Has Carpet And Tiling, Roof Appears To Be In Good Shape, While Exterior And Interior Spaces Need Attention. There Is What Appears To Be An ADU In The Back. Garage Has Since Been Taken Down But Concrete Pad Still Available For Building/Replacement. San Bernardino County RL (Rural Living) Zoned Which Is 2.5 Acres Per Residential Unit. Ideal For Investors, Developers, Handy Persons That Are Looking For Sprawling Land And SFR To Create Their Own Vision Into Reality!
-
1990-11-14soldstatus $50,000
ⓘ Source: listings_history table (triggers on properties + properties_extension) + one-shot
backfill from property_details.listing_events for pre-trigger history.
Tax reassessment forecast CA · Resets to sale price
- Current annual tax
- $1,070 · $89/mo
- Projected year-2 tax
- $2,204 · $184/mo
- Expected delta
- +$1,134/yr (+$95/mo · 106.0%)
ⓘ Screening estimate from a state-policy table — verify with the county assessor before closing.
Climate risk First Street
- Flood 1/10 Low FEMA zone D · 0% chance over 30 yrs
- Wildfire 4/10 Moderate
- Heat 7/10 Severe 8 d/yr ≥101°F today · 24 d/yr by 30 yrs out
- Wind 1/10 Low
- Air quality 5/10 Major 7 unhealthy d/yr today · 10 by 30 yrs out
Nearby sold comps map
Loading sold comps map…
Walkable amenities ~0.75 mi
Loading nearby amenities…
Taxation est. · year 1
- Rental income
- $29,384
- − Mortgage interest
- −$16,245
- − Property taxes
- −$1,070
- − Insurance
- −$1,450
- − Repairs & maintenance
- −$2,351
- − Management
- −$2,351
- − Depreciation
- −$8,436
- Taxable loss
- −$2,518
- Est. tax savings @ 24.0%
- +$604
- After-tax cash flow
- $3,048/yr
For passive investors: Depreciation is non-cash, so a rental often shows a tax loss while cash-flowing — sheltering income. Rental losses are passive: they offset passive income freely, and up to $25,000/yr can offset ordinary (W-2) income if you actively participate and your MAGI is under $100k (phasing out to $0 by $150k); unused losses carry forward. On sale, claimed depreciation is recaptured at up to 25%, and gains may owe capital-gains tax (a 1031 exchange can defer both). Figures are a year-1 estimate at your 24.0% rate — not tax advice; consult a CPA.
Schools (NCES district)
- District
- Morongo Unified
- NCES district ID
- 0625860
- Math proficiency
- 15% ▼ -12.00%
- Reading proficiency
- 38% ▼ -3.00%
- Median HH income
- $39,399
- Composite
- 22.19/100
- National rank
- #8156
- State rank
- #395 of 517 in CA
Livability — Homestead Valley
- Score
- 49/100
- State rank
- #1167
- US rank
- #25885
Category grades
Schools grade is shown separately in the Schools card above.
Census & demographics
- Census place
- Homestead Valley, CA
- Population (ZIP)
- 2,914
Population outlook (San Bernardino County) Hauer SSP2
- Today (2025)
- 2,300,329 people
- By 2030
- 2,378,907 · +3.4%
- By 2040
- 2,523,137 · +9.7%
- By 2050
- 2,642,388 · +14.9%
- By 2075
- 2,880,769 · +25.2%
- By 2100
- 2,909,436 · +26.5%
Race, ethnicity, and origin ACS 2023
- Neighborhood character
- Predominantly White (67%)
- Race & ethnicity
- White 67% Hispanic / Latino 20% Two or more races 15% Black 4% Native American 4% Asian 2%
- Hispanic origin (detail)
- Mexican 17%
- Common ancestry
- Italian 6% Romanian 3% Iranian 2%
- Foreign-born
- 8% · Canada, Philippines
- Languages at home
- 82% English-only · Spanish 16%
Political lean MEDSL · San Bernardino
- 2024 margin
- Toss-up / Even · D 47.5% · R 49.7% · Other 2.8%
- 2008→2024 swing
- -8.5pp toward R · 2008: 6.3pp · 2024: -2.1pp
- All cycles
- 2024: R+2.1 2020: D+10.7 2016: D+9.8 2012: D+5.4 2008: D+6.3
Not yet ingested
- Civics
- —
Market trends
- HPI YoY
- ▲ 128.05%
- Current HPI
- 536.4822
- Rent YoY
- —
- Metro
- —
- State GDP YoY
- ▲ 3.21%
- F500 in state
- 116
Industry mix (Fortune 500 HQ in CA)
| Industry | F500 HQs | Revenue |
|---|---|---|
| Technology | 27 | $1,492B |
|
||
| Financial Services | 3 | $174B |
|
||
| Retail | 3 | $44B |
|
||
| Insurance | 3 | $26B |
|
||
| Media / Entertainment | 2 | $115B |
|
||
| Pharmaceuticals / Biotech | 2 | $62B |
|
||
Price history
+480.0% since first listed2 events — show timeline
- 2026-01-28 Listed $290,000 CRMLS
- 1990-11-14 Sold (Public Records) $50,000 Public Records
Property tax history
+1.6%/yrLatest (2025): $1,070 · +3.9% YoY. Source: county tax records.
Cash-flow waterfall
monthlySold comps — $/sqft
last 12 mo · ≤1 miLoading sold comps…