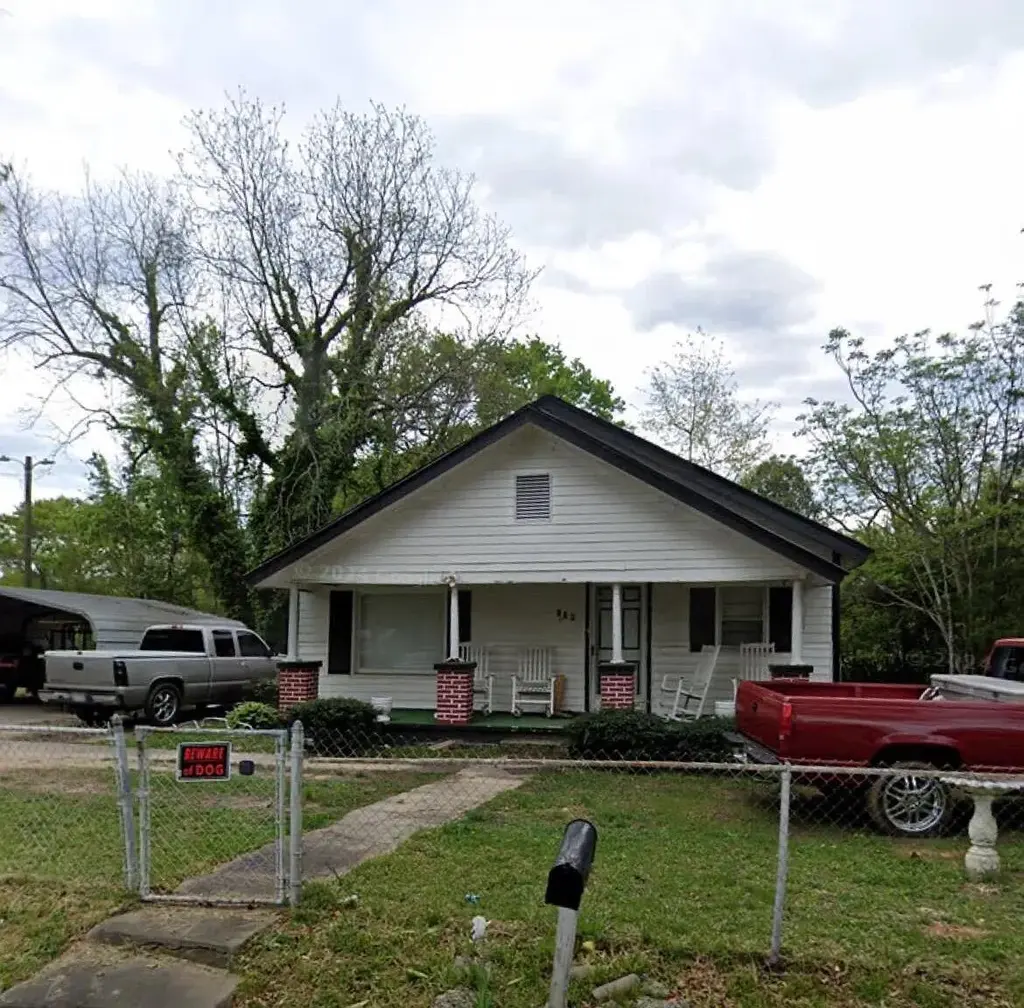
128 Bird St · Union, SC
Flood risk 1/10 · Minimal
- FEMA flood zone
- X (unshaded)
- Chance of flooding over 30 yrs
- 0.0%
- Est. flood insurance / yr
- $507 – $1,088
Fire risk 4/10 · Minor
- Est. fire insurance / yr
- $783 – $1,453
Heat risk 6/10 · Moderate
- Hot days now (above 107°F)
- 7 days/yr
- Hot days in 30 yrs
- 16 days/yr
Wind risk 4/10 · Minor
- Chance of severe wind over 30 yrs
- 9.0%
Air-quality risk 2/10 · Minimal
- Unhealthy air days now
- 1 days/yr
- Unhealthy air days in 30 yrs
- 2 days/yr
Risk factors via First Street. Map © Google.
Why this score? — see what drove the B- grade
The composite is a weighted blend of 9 inputs, each scored 0–100. Each bar is that input's sub-score; the figure is the points it added to the 100-point composite (weight × sub-score).
- Cash flow +30.0/30.0
- 1% rule +10.0/10.0
- DSCR +10.0/10.0
- ARV discount +7.5/15.0
- Livability +2.6/5.0
- Rent growth +2.5/5.0
- Condition / age +2.5/5.0
- Schools +2.3/10.0
- Appreciation +0.0/10.0
$58,000
🖨 Deal sheet 📄 Offer letter ✓ Due diligence
Listing remarks
Fantastic opportunity to purchase an active cash flowing property in Union SC. Property has a current, paying tenant in place. Financials available upon request. This two bedroom house is situated in a strong rental market and presents an excellent opportunity for an investor looking to add to their portfolio. Don't miss this chance for a return on investment day one!
Key facts
- 0.92 acre lot
- Built 1968
- Listed 55 days
Property features AI
Finance
- Other: MLS area: 81 - Out of Area; Listing status: Active
Exterior
- Utilities: Public sewer
- Home design: Single family detached residential property; Rural property outside Union, SC
- Exterior features: No other structures on the property; Subdivision listed as None
Interior
- Bedrooms: 2 bedrooms
- Bathrooms: 1 bathroom
- Interior features: No additional interior features listed
Neighborhood map
What this means for you Summary
Snapshot
- This is a 2-bed/1.0-bath other listed at $58k.
Deal economics
- At list price, monthly cash flow is $409 ($5k/yr) — positive.
- The deal already cash-flows at list — no discount required.
- Meets the 1% rule at list price ($1k rent vs $58k).
- Recommended offer: $56k (3.0% below list) — sets the bar for market timing.
- Cap rate 14.7% vs local median 2.8% in Union — top-decile yield for the area; either an underpriced asset or a hidden risk that comps aren't pricing in. Stress-test before assuming the spread holds.
Location & tenants
- Location reads 52/100 on livability (#359 in SC) — a working-class tenant base; expect higher turnover. Strengths: cost of living A+, housing A; Watch: schools F, crime F, amenities F.
- Union 01 (town): math 23% / reading 33% proficiency, ranked #60 of 80 in SC (top 75%) — low school quality limits family demand, transient renter base, plan for 1-2y turnover; 64% free/reduced lunch — lower-income household profile, screen leases tightly.
- Market conditions: 121 active listings in the ZIP; 57 units permitted in Union County in 2024 (0 in 5+ unit buildings).
Forward outlook
- Local home prices are declining (-3.0%/yr); year-one equity from $401 of loan paydown is wiped out by about $2k of value loss. Plan a longer hold.
- Union County population projected at -28% by 2050 — secular population decline; favor cash flow + early exit over multi-decade hold.
- At projected returns (-3.0% appreciation + 3.0% rent growth), your $16k cash investment doubles in ~4 years — after that, you're playing with house money.
Negotiation context
- It's been on market 56 days — a 3% lower offer ($56k) is reasonable based on typical stale-listing flexibility.
- 5 sale attempts; this cycle's ask has dropped $7k (11%) from the opening price — seller is motivated, your offer sets the floor, not the list.
Risks & watch-outs
- Climate carrying-cost: extreme-heat days projected 7→16/yr by 2055 (HVAC capex compounding) — expect insurance premiums to compound above CPI over the hold.
Questions for the listing agent
- It's been on market 56 days. Have you received any prior offers? Is the seller open to a 3% concession, seller financing, or rate buy-down credit?
- Built in 1968 — when were the roof, HVAC, electrical panel, plumbing, and water heater last replaced?
- Is there a deadline driving the sale (1031 exchange, divorce, estate, relocation)? That informs how much negotiation room exists.
- Schools are F-rated, which usually means shorter tenancies and higher turnover. Who's the typical renter profile here, and what's been the actual vacancy rate?
- Crime grade is F in this area — have there been break-ins, vandalism, or insurance claims at this property in the last 3 years? What carrier currently insures it and at what premium?
- What's the average days-on-market for RENTAL listings here right now (not sales)? A rising rental-DOM trend means longer vacancies and softer asking-rent achievability than the comps imply.
- What's the recent tenant-quality profile in this submarket — average credit score on applications, eviction rate, late-payment / NSF rate, and stable-employment percentage? A property-management company in the area should have these aggregated.
- How much new for-sale + rental construction is in the pipeline within 1–3 miles? Heavy new supply typically softens prices + rents 12–24 months out; constrained supply supports both.
Investment metrics
- 1% rule
- 1.78% ✓
- Cap rate
- 14.75%
- Cash-on-cash
- 30.20%
- DSCR
- 2.34
- GRM
- 4.7
CMA / ARV
No comps found within radius.
Projected returns pro-forma
-3.0% appreciation · 3.0% rent growth · sell at horizon
- IRR
- 24.8%
- Equity multiple
- 2.03×
- Total profit
- $16,651
- Equity at exit
- $8,648
- IRR
- 32.6%
- Equity multiple
- 3.96×
- Total profit
- $48,096
- Equity at exit
- $5,015
Cash invested: $16,240 (down + closing). Projections, not guarantees.
Landlord ↔ Tenant lean methodology
- Overall (STATE)
- 90 Strongly Landlord-Friendly
- State South Carolina
- 90 Strongly Landlord-Friendly · R+6
- County
- — inherits STATE
- City
- — inherits STATE
ZIP-level market 29379
- Home prices YoY
- -31.6%
- Active inventory
- 121
- Price-to-rent
- 4.7×
Monthly cashflow live
- Estimated rent
- $1,032 medium interval (Pro) →
- Mortgage (P&I)
- −$304
- Tax from tax record
- −$79 /mo · $944/yr
- Insurance
- −$24
- HOA
- −$0
- Vacancy / Maint / Mgmt
- −$217
- Net cashflow
- $409
Break-even live
UW: 25.0% down · 7.5% · 30yr · 1.5% tax · 5.0% vac · 8.0% maint · 8.0% mgmt
Financing live
Cash to close
- Down payment
- $14,500
- Closing costs
- $1,740
- Reserves months
- —
- Total cash needed
- —
Loan-product check · same deal, 3 products live
Conventional
25% down · 7.5% · 30yr
- Down + closing
- —
- Monthly P&I
- —
- Monthly cashflow
- —
- DSCR
- —
- Eligible?
- —
Personal DTI + credit; lowest rate.
DSCR
20% down · 8.5% · 30yr
- Down + closing
- —
- Monthly P&I
- —
- Monthly cashflow
- —
- DSCR
- —
- Eligible?
- —
No personal income docs; deal must DSCR.
Hard money
10% down · 12.0% · 12mo
- Down + closing
- —
- Monthly P&I
- —
- Monthly cashflow
- —
- DSCR
- —
- Eligible?
- —
Short-term bridge; refi at stabilization.
Listing history 26 events
-
2026-06-19days on market $58,000 Active 56 DOM
-
2026-06-18days on market $58,000 Active 55 DOM
-
2026-06-17days on market $58,000 Active 54 DOM
-
2026-06-16days on market $58,000 Active 53 DOM
-
2026-06-15days on market $58,000 Active 52 DOM
-
2026-06-14days on market $58,000 Active 50 DOM
-
2026-06-12days on market $58,000 Active 49 DOM
-
2026-06-09days on market $58,000 Active 46 DOM
-
2026-06-08days on market $58,000 Active 45 DOM
-
2026-06-07days on market $58,000 Active 44 DOM
-
2026-06-05days on market $58,000 Active 41 DOM
-
2026-06-03days on market $58,000 Active 40 DOM
-
2026-06-02days on market $58,000 Active 39 DOM
-
2026-06-01days on market $58,000 Active 38 DOM
-
2026-05-31days on market $58,000 Active 37 DOM
-
2026-05-30days on market $58,000 Active 36 DOM
-
2026-05-13price $58,000
-
2026-04-24status Active
-
2026-04-23historical
-
2026-04-20$65,000 Active
-
2026-03-01historical
-
2026-02-05$79,500 Active
-
2026-01-21price $75,000
-
2026-01-01historical
-
2025-12-04$125,000 Active
-
2025-10-29$125,000 Active
ⓘ Source: listings_history table (triggers on properties + properties_extension) + one-shot
backfill from property_details.listing_events for pre-trigger history.
Tax reassessment forecast SC · Resets to sale price
- Current annual tax
- $944 · $79/mo
- Projected year-2 tax
- $944 · $79/mo
- Expected delta
- $0/yr ($0/mo · 0.0%)
ⓘ Screening estimate from a state-policy table — verify with the county assessor before closing.
Climate risk First Street
- Flood 1/10 Low FEMA zone X (unshaded) · 0% chance over 30 yrs
- Wildfire 4/10 Moderate
- Heat 6/10 Major 7 d/yr ≥107°F today · 16 d/yr by 30 yrs out
- Wind 4/10 Moderate 9% chance of damaging wind over 30 yrs
- Air quality 2/10 Low 1 unhealthy d/yr today · 2 by 30 yrs out
Nearby sold comps map
Loading sold comps map…
Walkable amenities ~0.75 mi
Loading nearby amenities…
Taxation est. · year 1
- Rental income
- $12,390
- − Mortgage interest
- −$3,249
- − Property taxes
- −$944
- − Insurance
- −$290
- − Repairs & maintenance
- −$991
- − Management
- −$991
- − Depreciation
- −$1,687
- Taxable income
- $4,238
- Est. tax owed @ 24.0%
- −$1,017
- After-tax cash flow
- $3,887/yr
For passive investors: Depreciation is non-cash, so a rental often shows a tax loss while cash-flowing — sheltering income. Rental losses are passive: they offset passive income freely, and up to $25,000/yr can offset ordinary (W-2) income if you actively participate and your MAGI is under $100k (phasing out to $0 by $150k); unused losses carry forward. On sale, claimed depreciation is recaptured at up to 25%, and gains may owe capital-gains tax (a 1031 exchange can defer both). Figures are a year-1 estimate at your 24.0% rate — not tax advice; consult a CPA.
Schools (NCES district)
- District
- Union 01
- NCES district ID
- 4503750
- Math proficiency
- 23% ▼ -9.00%
- Reading proficiency
- 33% ▬ 0.00%
- Median HH income
- $34,709
- Composite
- 23.05/100
- National rank
- #7971
- State rank
- #60 of 80 in SC
Livability — Union
- Score
- 52/100
- State rank
- #359
- US rank
- #25100
Category grades
Schools grade is shown separately in the Schools card above.
Census & demographics
- Population (ZIP)
- 17,580
Population outlook (Union County) Hauer SSP2
- Today (2025)
- 25,518 people
- By 2030
- 24,099 · -5.6%
- By 2040
- 21,133 · -17.2%
- By 2050
- 18,314 · -28.2%
- By 2075
- 13,235 · -48.1%
- By 2100
- 9,565 · -62.5%
Race, ethnicity, and origin ACS 2023
- Neighborhood character
- Majority White (62%)
- Race & ethnicity
- White 62% Black 31% Two or more races 5% Hispanic / Latino 2%
- Common ancestry
- Lithuanian 1% Serbian 1% Slovak 1%
- Foreign-born
- 1% · Canada
- Languages at home
- 98% English-only · Spanish 1%
Political lean MEDSL · Union
- 2024 margin
- Solid R (+32.7) · D 33.2% · R 65.9%
- 2008→2024 swing
- -21.5pp toward R · 2008: -11.2pp · 2024: -32.7pp
- All cycles
- 2024: R+32.7 2020: R+24.5 2016: R+19.3 2012: R+6.5 2008: R+11.2
Not yet ingested
- Civics
- —
Market trends
- HPI YoY
- ▼ -72.94%
- Current HPI
- 158.1075
- Rent YoY
- —
- Metro
- —
- State GDP YoY
- ▲ 4.51%
- F500 in state
- 2
Industry mix (Fortune 500 HQ in SC)
| Industry | F500 HQs | Revenue |
|---|---|---|
| Packaging | 1 | $7B |
|
||
Price history
-53.6% since first listed10 events — show timeline
- 2026-05-13 Price Changed $58,000 Charleston Trident MLS
- 2026-04-24 Relisted — Charleston Trident MLS
- 2026-04-23 Listing Removed — Charleston Trident MLS
- 2026-04-20 Listed $65,000 Charleston Trident MLS
- 2026-03-01 Listing Removed — Greater Greenville MLS
- 2026-02-05 Listed $79,500 Consolidated MLS
- 2026-01-21 Price Changed $75,000 Greater Greenville MLS
- 2026-01-01 Delisted — Consolidated MLS
- 2025-12-04 Listed $125,000 Greater Greenville MLS
- 2025-10-29 Listed $125,000 Consolidated MLS
Property tax history
+1.0%/yrLatest (2025): $944 · +7.1% YoY. Source: county tax records.
Cash-flow waterfall
monthlySold comps — $/sqft
last 12 mo · ≤1 miLoading sold comps…