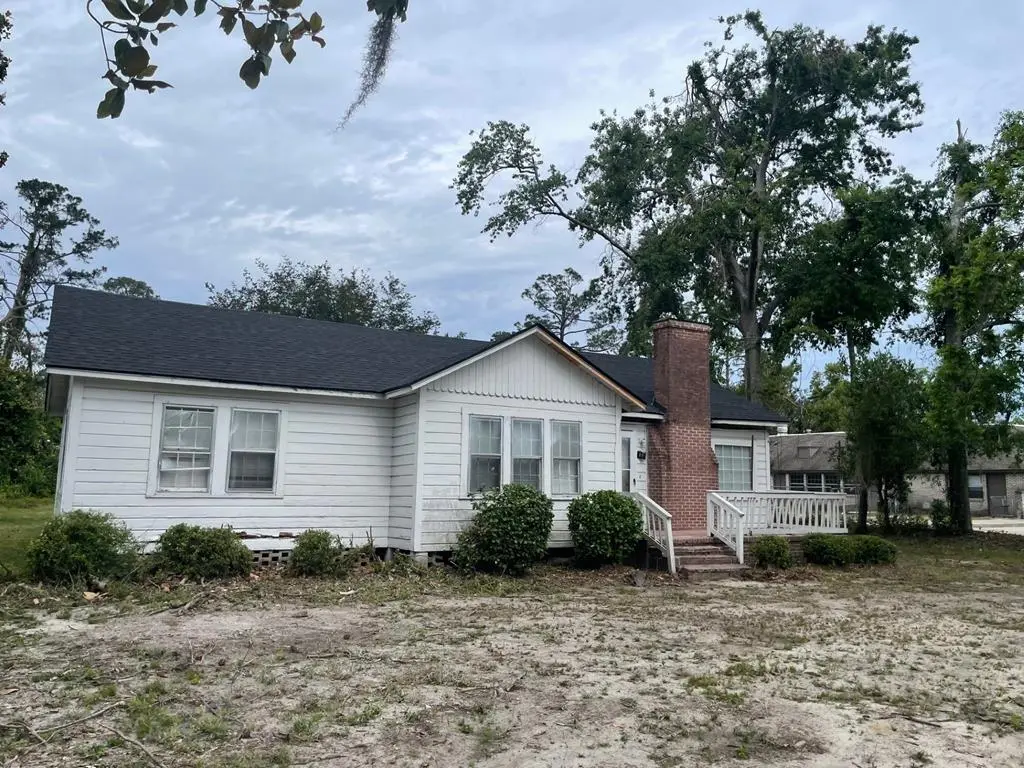
1900 N Barack Obama Blvd · Valdosta, GA
Flood risk 1/10 · Minimal
- FEMA flood zone
- X (unshaded)
- Chance of flooding over 30 yrs
- 0.0%
- Est. flood insurance / yr
- $507 – $1,088
Fire risk 5/10 · Moderate
- Est. fire insurance / yr
- $963 – $1,789
Heat risk 8/10 · Major
- Hot days now (above 108°F)
- 7 days/yr
- Hot days in 30 yrs
- 19 days/yr
Wind risk 9/10 · Severe
- Chance of severe wind over 30 yrs
- 99.0%
Air-quality risk 6/10 · Moderate
- Unhealthy air days now
- 10 days/yr
- Unhealthy air days in 30 yrs
- 11 days/yr
Risk factors via First Street. Map © Google.
Why this score? — see what drove the C- grade
The composite is a weighted blend of 9 inputs, each scored 0–100. Each bar is that input's sub-score; the figure is the points it added to the 100-point composite (weight × sub-score).
- Cash flow +22.9/30.0
- DSCR +7.3/10.0
- ARV discount +5.4/15.0
- 1% rule +5.2/10.0
- Rent growth +4.6/5.0
- Livability +3.0/5.0
- Condition / age +2.5/5.0
- Schools +1.5/10.0
- Appreciation +0.0/10.0
$115,000
🖨 Deal sheet (PDF) 📄 Offer letter ✓ Due diligence
Listing remarks MLS
Affordable investor opportunity to purchase a home and garage apartment to add to or start your rental portfolio. They are also close proximity to retail and surrounded by commercial properties. Possible gross income is $1350/month. 1900 is a 3 bedroom, 1 bath. 1900 1/2 is garage apartment with a 1 bedroom, 1 bath. Below the garage apartment are two storage areas. Brand NEW ROOF added to main house and garage apartment in May 2025. Come take a look today!
Key facts
- Garage apartment
- Storage areas
- New roof
Tags
Neighborhood map
What this means for you Summary
Snapshot
- This is a 3-bed/1.0-bath single-family listed at $115k.
Deal economics
- At list price, monthly cash flow is $202 ($2k/yr) — positive.
- The deal already cash-flows at list — no discount required.
- Meets the 1% rule at list price ($1k rent vs $115k).
- Recommended offer: $101k (12.0% below list) — sets the bar for market timing.
- Cap rate 8.4% vs local median 4.3% in Valdosta — top-decile yield for the area; either an underpriced asset or a hidden risk that comps aren't pricing in. Stress-test before assuming the spread holds.
Location & tenants
- Location reads 60/100 on livability (#392 in GA) — a middle-class / working-renter tenant base. Strengths: cost of living A+, health & safety A+, housing A-; Watch: crime F, amenities F, commute F.
- Valdosta City (urban): math 15% / reading 22% proficiency, ranked #149 of 174 in GA (top 86%) — low school quality limits family demand, transient renter base, plan for 1-2y turnover; 74% free/reduced lunch — lower-income household profile, screen leases tightly.
- Zoned schools: W.G. Nunn Elementary (math 14% / reading 17%, grade F, #973 of 1,228 statewide, top 80%, 901 students, 93% FRL); Newbern Middle School (math 10% / reading 18%, grade F, #405 of 470 statewide, top 86%, 806 students, 95% FRL); Valdosta High School (math 7% / reading 24%, grade F, #290 of 424 statewide, top 69%, 2,381 students, 95% FRL) — zoned schools average 94% FRL vs 74% district-wide (20 pts higher); higher-poverty schools than district average — tighter screening recommended.
- Market conditions: Rents rising fast (+8.3%/yr); 201 active listings in the ZIP; 35 comparable units currently listed for rent nearby; rentals lingering (median 46d on market — plan ~5-8 weeks vacancy on turnover, expect pricing pressure); 66% of comp listings sitting > 30 days — soft ceiling on asking rent; lower-income renter base — watch delinquency; 896 units permitted in Lowndes County in 2024 (0 in 5+ unit buildings).
- This rent runs 39% of the median local income ($36k/yr) — at the standard rent-burdened threshold; future hikes will face affordability resistance.
Forward outlook
- Local home prices are declining (-3.0%/yr); year-one equity from $795 of loan paydown is wiped out by about $3k of value loss. Plan a longer hold.
- Lowndes County population projected at +10% by 2050 — modest demand growth; plan on rents tracking national, not racing it.
- At projected returns (-3.0% appreciation + 8.0% rent growth), your $32k cash investment doubles in ~9 years — after that, you're playing with house money.
Negotiation context
- It's been on market 137 days — a 12% lower offer ($101k) is reasonable based on typical stale-listing flexibility.
Risks & watch-outs
- Watch-outs: built in 1955 — expect roof / HVAC / electrical / plumbing capex.
- Climate carrying-cost: severe wind risk, 99% chance of damaging wind over 30y; moderate wildfire risk; extreme-heat days projected 7→19/yr by 2055 (HVAC capex compounding) — expect insurance premiums to compound above CPI over the hold.
Questions for the listing agent
- It's been on market 137 days. Have you received any prior offers? Is the seller open to a 12% concession, seller financing, or rate buy-down credit?
- Built in 1955 — when were the roof, HVAC, electrical panel, plumbing, and water heater last replaced?
- Why hasn't it sold? Are there any deal-killer items the seller is aware of (foundation, flood, title, zoning, code violations)?
- Is there a deadline driving the sale (1031 exchange, divorce, estate, relocation)? That informs how much negotiation room exists.
- Schools are F-rated, which usually means shorter tenancies and higher turnover. Who's the typical renter profile here, and what's been the actual vacancy rate?
- Crime grade is F in this area — have there been break-ins, vandalism, or insurance claims at this property in the last 3 years? What carrier currently insures it and at what premium?
- What's the average days-on-market for RENTAL listings here right now (not sales)? A rising rental-DOM trend means longer vacancies and softer asking-rent achievability than the comps imply.
- What's the recent tenant-quality profile in this submarket — average credit score on applications, eviction rate, late-payment / NSF rate, and stable-employment percentage? A property-management company in the area should have these aggregated.
- How much new for-sale + rental construction is in the pipeline within 1–3 miles? Heavy new supply typically softens prices + rents 12–24 months out; constrained supply supports both.
Investment metrics
- 1% rule
- 1.02% ✓
- Cap rate
- 8.40%
- Cash-on-cash
- 7.52%
- DSCR
- 1.33
- GRM
- 8.2
CMA / ARV
- ARV (median comp)
- $109,946
- List price
- $115,000
- Delta
- 4.60%
- Verdict
- FAIR
- Comps
- 20 within 1.0 mi
Show comp detail 12 sales within ~0.75 mi
| Address | Dist | Beds/Ba | Sqft | Sold | Price | $/sf | Match |
|---|---|---|---|---|---|---|---|
| 1206 Lakeland Ave | 0.25mi | 3/2.0 | 1,296 (+3%) | 3mo | $145,000 | $112 | 76 |
| 1306 Ponderosa Dr | 0.33mi | 3/2.0 | 1,330 (+6%) | 0mo | $100,000 | $75 | 70 |
| 1505 Baymeadows Dr | 0.50mi | 3/2.0 | 1,332 (+6%) | 0mo | $182,000 | $137 | 62 |
| 1405 Leon Ave | 0.40mi | 3/2.0 | 1,162 (-8%) | 4mo | $150,000 | $129 | 62 |
| 2105 N Troup St | 0.49mi | 4/2.0 (+1) | 1,334 (+6%) | 1mo | $140,000 | $105 | 57 |
| 1731 Eli Pl | 0.73mi | 3/2.0 | 1,296 (+3%) | 2mo | $182,500 | $141 | 55 |
| 2102 Melrose Dr | 0.43mi | 3/2.0 | 1,404 (+12%) | 3mo | $139,000 | $99 | 54 |
| 2745 Pineview Dr | 0.74mi | 3/2.0 | 1,224 (-2%) | 4mo | $218,000 | $178 | 54 |
| 1803 N Lee St | 0.69mi | 4/2.0 (+1) | 1,241 (-1%) | 4mo | $71,500 | $58 | 54 |
| 736 Lausanne Dr | 0.54mi | 3/1.0 | 1,105 (-12%) | 4mo | $66,000 | $60 | 52 |
| 2318 Frederick Pl | 0.63mi | 4/2.0 (+1) | 1,342 (+7%) | 2mo | $150,000 | $112 | 48 |
| 904 E Brookwood Dr | 0.59mi | 3/2.0 | 1,420 (+13%) | 3mo | $134,000 | $94 | 44 |
Match score weights: distance 35% · size 25% · config 20% · recency 20%. Top-matched comps best support the ARV.
Projected returns pro-forma
-3.0% appreciation · 8.0% rent growth · sell at horizon
- IRR
- 0.3%
- Equity multiple
- 1.01×
- Total profit
- $384
- Equity at exit
- $17,147
- IRR
- 14.3%
- Equity multiple
- 2.40×
- Total profit
- $44,989
- Equity at exit
- $9,943
Cash invested: $32,200 (down + closing). Projections, not guarantees.
Landlord ↔ Tenant lean methodology
- Overall (STATE)
- 90 Strongly Landlord-Friendly
- State Georgia
- 90 Strongly Landlord-Friendly · R+3
- County
- — inherits STATE
- City
- — inherits STATE
ZIP-level market 31601
- Home prices YoY
- -31.2%
- Rents YoY
- 8.3%
- Active inventory
- 201
- Price-to-rent
- 8.2×
Monthly cashflow live
- Estimated rent
- $1,173 high interval (Pro) →
- Mortgage (P&I)
- −$603
- Tax from tax record
- −$74 /mo · $889/yr
- Insurance
- −$48
- HOA
- −$0
- Vacancy / Maint / Mgmt
- −$246
- Net cashflow
- $202
Break-even live
Sensitivity live
| Price | -10% $267 | -5% $234 | +0% $202 | +5% $169 | +10% $137 |
|---|---|---|---|---|---|
| Rent | -10% $109 | -5% $155 | +0% $202 | +5% $248 | +10% $294 |
| Rate | -1.0pp $260 | -0.5pp $231 | base $202 | +0.5pp $172 | +1.0pp $142 |
UW: 25.0% down · 7.5% · 30yr · 1.5% tax · 5.0% vac · 8.0% maint · 8.0% mgmt
Financing live
Cash to close
- Down payment
- $28,750
- Closing costs
- $3,450
- Reserves months
- —
- Total cash needed
- —
Loan-product check · same deal, 3 products live
Conventional
25% down · 7.5% · 30yr
- Down + closing
- —
- Monthly P&I
- —
- Monthly cashflow
- —
- DSCR
- —
- Eligible?
- —
Personal DTI + credit; lowest rate.
DSCR
20% down · 8.5% · 30yr
- Down + closing
- —
- Monthly P&I
- —
- Monthly cashflow
- —
- DSCR
- —
- Eligible?
- —
No personal income docs; deal must DSCR.
Hard money
10% down · 12.0% · 12mo
- Down + closing
- —
- Monthly P&I
- —
- Monthly cashflow
- —
- DSCR
- —
- Eligible?
- —
Short-term bridge; refi at stabilization.
Rent comps 35 comps
| Address | Beds | Baths | Sqft | Rent | $/sqft | DOM | Units | Dist |
|---|---|---|---|---|---|---|---|---|
| 1425 E Park Ave Valdosta, GA | 1.0–2.0 | 1.0–2.0 | 917 | $1,095 | $1.19 | 23d | 2 | 0.12mi |
| 1616 E Moore St Apt 19 Valdosta, GA | 2.0 | 1.0 | 1029 | $825 | $0.80 | 45d | 1 | 0.27mi |
| 1503 E Park Ave Valdosta, GA | 1.0–3.0 | 1.0–2.0 | 890 | $1,260 | $1.42 | 45d | 54 | 0.28mi |
| 1109 Timber Line Dr Valdosta, GA | 3.0 | 2.0 | 1436 | $1,300 | $0.91 | 45d | 1 | 0.33mi |
| 1632 Lexington Cir Valdosta, GA | 3.0 | 2.0 | 1104 | $1,395 | $1.26 | 45d | 1 | 0.38mi |
| 908 E Park Ave Valdosta, GA | 3.0 | 2.0 | 1612 | $1,650 | $1.02 | 23d | 1 | 0.39mi |
| 1235 Ponderosa Dr Valdosta, GA | 3.0 | 2.0 | 1200 | $1,295 | $1.08 | 23d | 1 | 0.43mi |
| 1005 Langdale Dr Unit B Valdosta, GA | 2.0 | 1.0 | 879 | $700 | $0.80 | 23d | 1 | 0.46mi |
| 4 Lakeland Ct Valdosta, GA | 4.0 | 2.0 | 1350 | $1,250 | $0.93 | 23d | 1 | 0.49mi |
| 2314 Pineview Dr Apt A Valdosta, GA | 2.0 | 1.0 | 940 | $900 | $0.96 | 45d | 1 | 0.53mi |
| 722 Vallotton Dr Valdosta, GA | 3.0 | 1.0 | 984 | $900 | $0.91 | 45d | 1 | 0.53mi |
| 803 Lausanne Dr Valdosta, GA | 3.0 | 1.0 | 994 | $1,095 | $1.10 | 45d | 1 | 0.54mi |
| 2324 Sterling Pl Valdosta, GA | 3.0 | 1.0 | 1124 | $1,095 | $0.97 | 23d | 1 | 0.60mi |
| 713 Lakeland Ave Valdosta, GA | 2.0 | 1.0 | 1047 | $895 | $0.85 | 45d | 1 | 0.64mi |
| 743 E Brookwood Dr Valdosta, GA | 2.0 | 1.0 | 906 | $895 | $0.99 | 45d | 1 | 0.69mi |
| 1730 Forsyth Pl Unit B Valdosta, GA | 3.0 | 3.0 | 1280 | $1,395 | $1.09 | 45d | 1 | 0.70mi |
| 2709 Pineview Dr Unit A Valdosta, GA | 2.0 | 2.5 | 1000 | $995 | $0.99 | 45d | 1 | 0.71mi |
| 1609 Marion St Unit B Valdosta, GA | 2.0 | 1.0 | 945 | $895 | $0.95 | 23d | 1 | 0.80mi |
| 2205 Bemiss Rd Valdosta, GA | 2.0 | 1.0 | 880 | $1,095 | $1.24 | 45d | 3 | 0.80mi |
| 611 Pineview Dr Valdosta, GA | 1.0–3.0 | 1.0–2.5 | 1204 | $1,600 | $1.33 | 23d | 3 | 0.92mi |
| 1778 Almond Tree Pl Valdosta, GA | 3.0 | 2.5 | 1336 | $1,300 | $0.97 | 45d | 1 | 0.94mi |
| 1717 Largo Cir Valdosta, GA | 3.0 | 2.0 | 1206 | $1,495 | $1.24 | 45d | 1 | 0.95mi |
| 304 E Cranford Ave Valdosta, GA | 2.0 | 1.0 | 980 | $850 | $0.87 | 45d | 1 | 0.99mi |
| 2305 Bemiss Rd Unit T16 Valdosta, GA | 2.0 | 1.5 | 896 | $850 | $0.95 | 45d | 1 | 1.03mi |
| 2600 Deborah Dr Valdosta, GA | 3.0 | 1.0 | 1333 | $1,495 | $1.12 | 45d | 1 | 1.03mi |
| 1506 Slater St Unit 7 Valdosta, GA | 2.0 | 1.5 | 1037 | $695 | $0.67 | 45d | 1 | 1.23mi |
| 2437 University Dr Valdosta, GA | 3.0 | 1.0 | 879 | $1,175 | $1.34 | 45d | 1 | 1.28mi |
| 1704 N Patterson St Unit 4 Valdosta, GA | 2.0 | 2.0 | 1100 | $950 | $0.86 | 45d | 1 | 1.30mi |
| 2816 Kirkwood Cir Valdosta, GA | 3.0 | 1.0 | 1168 | $1,450 | $1.24 | 23d | 1 | 1.35mi |
| 411 Northside Dr Valdosta, GA | 2.0 | 2.0 | 950 | $795 | $0.84 | 45d | 1 | 1.35mi |
| 411 Northside Dr Unit G5 Valdosta, GA | 2.0 | 1.5 | 950 | $795 | $0.84 | 45d | 1 | 1.35mi |
| 2814 Kirkwood Cir Valdosta, GA | 4.0 | 2.0 | 1392 | $1,500 | $1.08 | 23d | 1 | 1.36mi |
| 522 Green St Valdosta, GA | 2.0 | 1.0 | 1020 | $900 | $0.88 | 23d | 1 | 1.36mi |
| 5 Crestwood Cir Valdosta, GA | 2.0 | 1.5 | 1032 | $925 | $0.90 | 45d | 1 | 1.40mi |
| 200 W Cranford Ave Valdosta, GA | 2.0 | 2.0 | 950 | $1,225 | $1.29 | 23d | 3 | 1.42mi |
Listing history 20 events
-
2026-06-21days on market $115,000 Active 137 DOM
-
2026-06-19days on market $115,000 Active 135 DOM
-
2026-06-18days on market $115,000 Active 134 DOM
-
2026-06-17days on market $115,000 Active 133 DOM
-
2026-06-16days on market $115,000 Active 132 DOM
-
2026-06-15days on market $115,000 Active 131 DOM
-
2026-06-14days on market $115,000 Active 129 DOM
-
2026-06-13pricedays on market $115,000 Active 128 DOM
-
2026-06-10days on market $120,000 Active 126 DOM
-
2026-06-09days on market $120,000 Active 125 DOM
-
2026-06-08days on market $120,000 Active 124 DOM
-
2026-06-07days on market $120,000 Active 123 DOM
-
2026-06-05days on market $120,000 Active 120 DOM
-
2026-06-03days on market $120,000 Active 119 DOM
-
2026-06-02days on market $120,000 Active 118 DOM
-
2026-06-01days on market $120,000 Active 117 DOM
-
2026-05-31days on market $120,000 Active 116 DOM
-
2026-05-30days on market $120,000 Active 115 DOM
-
2026-02-04$120,000 Active 459-char remark
Show marketing remark (459 chars)
Affordable investor opportunity to purchase a home and garage apartment to add to or start your rental portfolio. They are also close proximity to retail and surrounded by commercial properties. Possible gross income is $1350/month. 1900 is a 3 bedroom, 1 bath. 1900 1/2 is garage apartment with a 1 bedroom, 1 bath. Below the garage apartment are two storage areas. Brand NEW ROOF added to main house and garage apartment in May 2025. Come take a look today!
-
2024-05-11price $125,000
ⓘ Source: listings_history table (triggers on properties + properties_extension) + one-shot
backfill from property_details.listing_events for pre-trigger history.
Tax reassessment forecast GA · Resets to sale price
- Current annual tax
- $889 · $74/mo
- Projected year-2 tax
- $1,058 · $88/mo
- Expected delta
- +$169/yr (+$14/mo · 19.0%)
ⓘ Screening estimate from a state-policy table — verify with the county assessor before closing.
Climate risk First Street
- Flood 1/10 Low FEMA zone X (unshaded) · 0% chance over 30 yrs
- Wildfire 5/10 Major
- Heat 8/10 Severe 7 d/yr ≥108°F today · 19 d/yr by 30 yrs out
- Wind 9/10 Extreme 99% chance of damaging wind over 30 yrs
- Air quality 6/10 Major 10 unhealthy d/yr today · 11 by 30 yrs out
Nearby sold comps map
Loading sold comps map…
Walkable amenities ~0.75 mi
Loading nearby amenities…
Taxation est. · year 1
- Rental income
- $14,077
- − Mortgage interest
- −$6,442
- − Property taxes
- −$889
- − Insurance
- −$575
- − Repairs & maintenance
- −$1,126
- − Management
- −$1,126
- − Depreciation
- −$3,345
- Taxable income
- $574
- Est. tax owed @ 24.0%
- −$138
- After-tax cash flow
- $2,282/yr
For passive investors: Depreciation is non-cash, so a rental often shows a tax loss while cash-flowing — sheltering income. Rental losses are passive: they offset passive income freely, and up to $25,000/yr can offset ordinary (W-2) income if you actively participate and your MAGI is under $100k (phasing out to $0 by $150k); unused losses carry forward. On sale, claimed depreciation is recaptured at up to 25%, and gains may owe capital-gains tax (a 1031 exchange can defer both). Figures are a year-1 estimate at your 24.0% rate — not tax advice; consult a CPA.
Schools (NCES district)
- District
- Valdosta City
- NCES district ID
- 1305310
- Math proficiency
- 15% ▼ -12.00%
- Reading proficiency
- 22% ▼ -7.00%
- Median HH income
- $30,634
- Composite
- 14.79/100
- National rank
- #9388
- State rank
- #149 of 174 in GA
Livability — Valdosta
- Score
- 60/100
- State rank
- #392
- US rank
- #19544
Category grades
Schools grade is shown separately in the Schools card above.
Census & demographics
- Census place
- Valdosta, GA
- County
- Lowndes County · 107,801 people
- City population
- 91,859
- Metro
- Valdosta, GA
- Population (ZIP)
- 31,302
- Household income
- $36,111
- Rent vs Own
- Severe rent burden
- 2016.0
Population outlook (Lowndes County) Hauer SSP2
- Today (2025)
- 120,348 people
- By 2030
- 123,469 · +2.6%
- By 2040
- 128,482 · +6.8%
- By 2050
- 131,907 · +9.6%
- By 2075
- 139,080 · +15.6%
- By 2100
- 133,649 · +11.1%
Race, ethnicity, and origin ACS 2023
- Neighborhood character
- Diverse neighborhood (Simpson 0.57)
- Race & ethnicity
- Black 57% White 31% Hispanic / Latino 8% Two or more races 4% Asian 1%
- Hispanic origin (detail)
- Mexican 4%
- Common ancestry
- Slovak 1% Italian 1%
- Foreign-born
- 4% · Canada, South Korea
- Languages at home
- 92% English-only · Spanish 7% Korean 1%
Political lean MEDSL · Lowndes
- 2024 margin
- R (+18.0) · D 40.8% · R 58.8%
- 2008→2024 swing
- -8.6pp toward R · 2008: -9.4pp · 2024: -18.0pp
- All cycles
- 2024: R+18.0 2020: R+12.0 2016: R+18.2 2012: R+10.5 2008: R+9.4
Not yet ingested
- Civics
- —
Market trends
- HPI YoY
- ▼ -55.12%
- Current HPI
- 121.5948
- Rent YoY
- ▲ 8.34%
- Metro
- Valdosta, GA
- State GDP YoY
- ▲ 2.66%
- F500 in state
- 28
Industry mix (Fortune 500 HQ in GA)
| Industry | F500 HQs | Revenue |
|---|---|---|
| Paper / Packaging | 2 | $29B |
|
||
| Retail | 1 | $160B |
|
||
| Transportation / Logistics | 1 | $91B |
|
||
| Airlines | 1 | $62B |
|
||
| Consumer Goods | 1 | $47B |
|
||
| Utilities | 1 | $25B |
|
||
Price history
-4.0% since first listed2 events — show timeline
- 2026-02-04 Listed $120,000 SGMLS
- 2024-05-11 Price Changed $125,000 SGMLS
Property tax history
+1.5%/yrLatest (2025): $889 · +3.2% YoY. Source: county tax records.
Cash-flow waterfall
monthlySold comps — $/sqft
last 12 mo · ≤1 miLoading sold comps…