 🏗️ New Construction
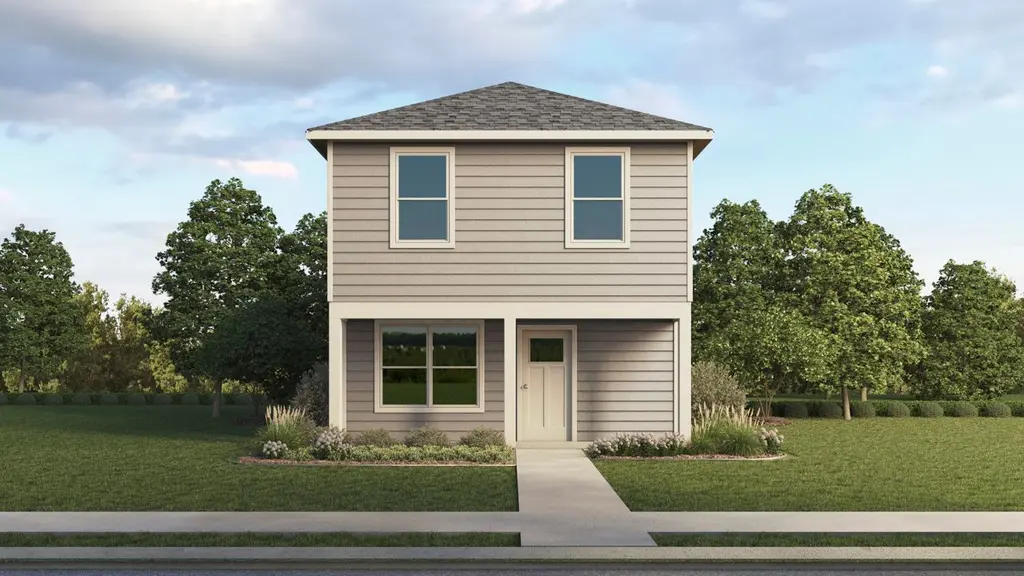
RANGER Plan · Crandall, TX
Flood risk No data
- FEMA flood zone
- —
- Chance of flooding over 30 yrs
- —
- Est. flood insurance / yr
- —
Fire risk No data
- Est. fire insurance / yr
- —
Heat risk No data
- Hot days now (above threshold)
- —
- Hot days in 30 yrs
- —
Wind risk No data
- Chance of severe wind over 30 yrs
- —
Air-quality risk No data
- Unhealthy air days now
- —
- Unhealthy air days in 30 yrs
- —
Risk factors via First Street. Map © Google.
Why this score? — see what drove the C- grade
The composite is a weighted blend of 9 inputs, each scored 0–100. Each bar is that input's sub-score; the figure is the points it added to the 100-point composite (weight × sub-score).
- Cash flow +18.5/30.0
- ARV discount +7.5/15.0
- DSCR +5.8/10.0
- 1% rule +4.9/10.0
- Condition / age +4.0/5.0
- Schools +3.6/10.0
- Livability +3.4/5.0
- Rent growth +2.5/5.0
- Appreciation +0.0/10.0
$197,990
🖨 Deal sheet 📄 Offer letter ✓ Due diligence
Listing remarks
Step into the 1206 Ranger COTTAGE SERIES floorplan! This charming Cottage Style home plan seamlessly blends elegance and practicality, perfect for a variety of family needs. The exterior of this home showcases custom architectural details with beautifully designed siding elevations, giving it a timeless and inviting curb appeal. A welcoming covered front porch leads you to the raised-panel fiberglass insulated front door, with decorative door options available to further enhance the entrance. Upon entering, you're greeted by a bright and airy foyer that opens into the heart of the home. The kitchen is a true highlight, featuring 36" cabinets with hidden hinges for a sleek look, stainle
Key facts
- Covered front porch
- 36 inch cabinets
- Listed 5 days
Tags
Property features AI
Finance
- Financial info: List price $197,990
Exterior
- Home design: Single-family plan home; Listed as active
- Exterior features: Selling from Crane Xing, Crandall, TX
Interior
- Bedrooms: 3 bedrooms
- Bathrooms: 2 full bathrooms; 1 half bathroom
- Interior features: Plan home (RANGER)
Neighborhood map
What this means for you Summary
Snapshot
- This is a 3-bed/2.5-bath single-family listed at $198k. Condition is rated good.
Deal economics
- At list price, monthly cash flow is $205 ($2k/yr) — positive.
- The deal already cash-flows at list — no discount required.
- Meets the 1% rule at list price ($2k rent vs $198k).
- Cap rate 7.4% vs local median 5.3% in Crandall — top-decile yield for the area; either an underpriced asset or a hidden risk that comps aren't pricing in. Stress-test before assuming the spread holds.
Location & tenants
- Location reads 68/100 on livability (#507 in TX) — a middle-class / working-renter tenant base. Strengths: employment A+, cost of living A+, housing A+; Watch: crime F, amenities F, commute F.
- Crandall ISD (rural): math 36% / reading 42% proficiency, ranked #351 of 826 in TX (top 42%) — families likely to look elsewhere, expect single-tenant / working-renter base with shorter leases.
- Market conditions: 787 active listings in the ZIP; 7 comparable units currently listed for rent nearby; rentals at typical pace (median 17d on market — plan ~3-4 weeks tenant-placement turnaround); solid renter incomes; 1,747 units permitted in Kaufman County in 2024 (180 in 5+ unit buildings).
Forward outlook
- Local home prices are declining (-3.0%/yr); year-one equity from $1k of loan paydown is wiped out by about $6k of value loss. Plan a longer hold.
- Kaufman County population projected at +43% by 2050 — long-run rental-demand tailwind backs the buy-and-hold thesis.
Negotiation context
- Only 5 days on market — expect competitive offers; lowballing is unlikely to land.
Questions for the listing agent
- Is there a deadline driving the sale (1031 exchange, divorce, estate, relocation)? That informs how much negotiation room exists.
- Schools are B-rated — typically a magnet for longer-tenancy family renters. What's the average tenant stay here, and is there a school-zone premium baked into asking?
- Crime grade is F in this area — have there been break-ins, vandalism, or insurance claims at this property in the last 3 years? What carrier currently insures it and at what premium?
- What's the average days-on-market for RENTAL listings here right now (not sales)? A rising rental-DOM trend means longer vacancies and softer asking-rent achievability than the comps imply.
- What's the recent tenant-quality profile in this submarket — average credit score on applications, eviction rate, late-payment / NSF rate, and stable-employment percentage? A property-management company in the area should have these aggregated.
- How much new for-sale + rental construction is in the pipeline within 1–3 miles? Heavy new supply typically softens prices + rents 12–24 months out; constrained supply supports both.
Investment metrics
- 1% rule
- 0.99% ✗
- Cap rate
- 7.43%
- Cash-on-cash
- 4.06%
- DSCR
- 1.18
- GRM
- 8.4
CMA / ARV
- ARV (on-the-fly)
- $215,874
- Comps found
- 3
Show comp detail 3 sales within ~0.75 mi
| Address | Dist | Beds/Ba | Sqft | Sold | Price | $/sf | Match |
|---|---|---|---|---|---|---|---|
| 4297 Tafoya Ln | 0.08mi | 3/2.5 | 1,206 (0%) | 7mo | $193,990 | $161 | 90 |
| 4053 Quarry St | 0.05mi | 2/2.5 (-1) | 1,130 (-6%) | 3mo | $203,990 | $181 | 80 |
| 4108 Sunridge Dr | 0.08mi | 2/2.5 (-1) | 1,130 (-6%) | 2mo | $202,490 | $179 | 79 |
Match score weights: distance 35% · size 25% · config 20% · recency 20%. Top-matched comps best support the ARV.
Projected returns pro-forma
-3.0% appreciation · 3.0% rent growth · sell at horizon
- IRR
- -9.9%
- Equity multiple
- 0.64×
- Total profit
- $-21,914
- Equity at exit
- $32,188
- IRR
- -0.5%
- Equity multiple
- 0.96×
- Total profit
- $-2,167
- Equity at exit
- $18,665
Cash invested: $60,445 (down + closing). Projections, not guarantees.
Landlord ↔ Tenant lean methodology
- Overall (STATE)
- 87 Strongly Landlord-Friendly
- State Texas
- 87 Strongly Landlord-Friendly · R+5
- County
- — inherits STATE
- City
- — inherits STATE
ZIP-level market 75114
- Home prices YoY
- -26.7%
- Active inventory
- 787
- Price-to-rent
- 7.7×
Monthly cashflow live
- Estimated rent
- $2,147 high interval (Pro) →
- Mortgage (P&I)
- −$1,132
- Tax est. 1.5%
- −$270 /mo · $3,238/yr
- Insurance
- −$90
- HOA
- −$0
- Vacancy / Maint / Mgmt
- −$451
- Net cashflow
- $205
Break-even live
UW: 25.0% down · 7.5% · 30yr · 1.5% tax · 5.0% vac · 8.0% maint · 8.0% mgmt
Financing live
Cash to close
- Down payment
- $53,968
- Closing costs
- $6,476
- Reserves months
- —
- Total cash needed
- —
Loan-product check · same deal, 3 products live
Conventional
25% down · 7.5% · 30yr
- Down + closing
- —
- Monthly P&I
- —
- Monthly cashflow
- —
- DSCR
- —
- Eligible?
- —
Personal DTI + credit; lowest rate.
DSCR
20% down · 8.5% · 30yr
- Down + closing
- —
- Monthly P&I
- —
- Monthly cashflow
- —
- DSCR
- —
- Eligible?
- —
No personal income docs; deal must DSCR.
Hard money
10% down · 12.0% · 12mo
- Down + closing
- —
- Monthly P&I
- —
- Monthly cashflow
- —
- DSCR
- —
- Eligible?
- —
Short-term bridge; refi at stabilization.
Rent comps 7 comps
| Address | Beds | Baths | Sqft | Rent | $/sqft | DOM | Units | Dist |
|---|---|---|---|---|---|---|---|---|
| 4484 Bonney Ave Crandall, TX | 3.0 | 2.5 | 1206 | $2,000 | $1.66 | 1d | 1 | 0.09mi |
| 4624 Verdin St Crandall, TX | 3.0 | 2.0 | 1390 | $1,950 | $1.40 | 1d | 1 | 0.89mi |
| 4171 Silverstein St Crandall, TX | 3.0 | 2.0 | 1311 | $1,900 | $1.45 | 12d | 1 | 1.14mi |
| 4152 Silverstein St Crandall, TX | 3.0 | 2.0 | 1266 | $1,925 | $1.52 | 24d | 1 | 1.21mi |
| 3324 Price Trl Crandall, TX | 3.0 | 2.0 | 1296 | $1,995 | $1.54 | 16d | 1 | 1.35mi |
| 2127 Ocelot St Crandall, TX | 3.0 | 2.0 | 1383 | $2,200 | $1.59 | 43d | 1 | 1.41mi |
| 2117 Ocelot St Crandall, TX | 3.0 | 2.0 | 1481 | $1,875 | $1.27 | 43d | 1 | 1.43mi |
Listing history 6 events
-
2026-06-18days on market $197,990 Active 5 DOM
-
2026-06-17days on market $197,990 Active 4 DOM
-
2026-06-16days on market $197,990 Active 3 DOM
-
2026-06-15days on market $197,990 Active 2 DOM
-
2026-06-13remarks 694-char remark
-
2026-06-13$197,990 Active 1 DOM
ⓘ Source: listings_history table (triggers on properties + properties_extension) + one-shot
backfill from property_details.listing_events for pre-trigger history.
Nearby sold comps map
Loading sold comps map…
Walkable amenities ~0.75 mi
Loading nearby amenities…
Taxation est. · year 1
- Rental income
- $25,770
- − Mortgage interest
- −$12,092
- − Property taxes
- −$3,238
- − Insurance
- −$1,079
- − Repairs & maintenance
- −$2,062
- − Management
- −$2,062
- − Depreciation
- −$6,280
- Taxable loss
- −$1,043
- Est. tax savings @ 24.0%
- +$250
- After-tax cash flow
- $2,706/yr
For passive investors: Depreciation is non-cash, so a rental often shows a tax loss while cash-flowing — sheltering income. Rental losses are passive: they offset passive income freely, and up to $25,000/yr can offset ordinary (W-2) income if you actively participate and your MAGI is under $100k (phasing out to $0 by $150k); unused losses carry forward. On sale, claimed depreciation is recaptured at up to 25%, and gains may owe capital-gains tax (a 1031 exchange can defer both). Figures are a year-1 estimate at your 24.0% rate — not tax advice; consult a CPA.
Condition & rehab AI · 7 photos
This home is in good condition with a good curb appeal and a modern interior. It has potential for further enhancing its value through exterior painting and landscaping improvements.
Value-add opportunities
- Both Painting the exterior siding — Enhances curb appeal and can increase both resale and rental value.
- Both Landscaping improvements — Enhances curb appeal and can increase both resale and rental value.
- Resale Kitchen backsplash — A backsplash can add visual interest and functionality to the kitchen, enhancing resale value.
- Rental Bathroom vanity and fixtures — Upgrading vanity and fixtures can improve the rental experience and attract tenants.
- Both Smart home integration — Adding smart home features can increase both resale and rental value by making the home more modern and convenient.
Renovation cost estimate screening
Value-add ROI direction
- Both Painting the exterior siding — Enhances curb appeal and can increase both resale and rental value. ↑
- Both Landscaping improvements — Enhances curb appeal and can increase both resale and rental value. ↑
- Resale Kitchen backsplash — A backsplash can add visual interest and functionality to the kitchen, enhancing resale value. ↑
- Rental Bathroom vanity and fixtures — Upgrading vanity and fixtures can improve the rental experience and attract tenants. ↑
- Both Smart home integration — Adding smart home features can increase both resale and rental value by making the home more modern and convenient. ↑
ⓘ Cost ranges are severity-bucket heuristics (US national rule-of-thumb). Get contractor quotes + a written scope before underwriting a rehab budget.
Schools (NCES district)
- District
- Crandall ISD
- NCES district ID
- 4815510
- Math proficiency
- 36% ▼ -13.00%
- Reading proficiency
- 42% ▼ -8.00%
- Median HH income
- $70,076
- Composite
- 35.57/100
- National rank
- #4901
- State rank
- #351 of 826 in TX
Livability — Crandall
- Score
- 68/100
- State rank
- #507
- US rank
- #10022
Category grades
Schools grade is shown separately in the Schools card above.
Census & demographics
- County
- Kaufman County · 122,338 people
- City population
- 9,333
- Metro
- Dallas-Fort Worth-Arlington, TX
- Population (ZIP)
- 9,333
- Household income
- $88,013
- Rent vs Own
- Severe rent burden
- 33.0
Population outlook (Kaufman County) Hauer SSP2
- Today (2025)
- 138,716 people
- By 2030
- 150,815 · +8.7%
- By 2040
- 174,877 · +26.1%
- By 2050
- 198,020 · +42.8%
- By 2075
- 251,908 · +81.6%
- By 2100
- 285,325 · +105.7%
Race, ethnicity, and origin ACS 2023
- Neighborhood character
- Diverse neighborhood (Simpson 0.62)
- Race & ethnicity
- White 48% Hispanic / Latino 36% Two or more races 14% Black 14%
- Hispanic origin (detail)
- Mexican 34%
- Common ancestry
- Slovak 1%
- Foreign-born
- 18% · Canada, China
- Languages at home
- 71% English-only · Spanish 27% Other Indo-European 1%
Political lean MEDSL · Kaufman
- 2024 margin
- Strong R (+27.9) · D 35.6% · R 63.5%
- 2008→2024 swing
- +7.9pp toward D · 2008: -35.8pp · 2024: -27.9pp
- All cycles
- 2024: R+27.9 2020: R+33.9 2016: R+47.0 2012: R+44.4 2008: R+35.8
Not yet ingested
- Civics
- —
Market trends
- HPI YoY
- ▼ -71.61%
- Current HPI
- 196.4773
- Rent YoY
- —
- Metro
- Dallas-Fort Worth-Arlington, TX
- State GDP YoY
- ▲ 3.95%
- F500 in state
- 110
Industry mix (Fortune 500 HQ in TX)
| Industry | F500 HQs | Revenue |
|---|---|---|
| Energy | 16 | $1,198B |
|
||
| Technology | 5 | $198B |
|
||
| Engineering / Construction | 4 | $72B |
|
||
| Energy Services | 3 | $60B |
|
||
| Utilities | 3 | $41B |
|
||
| Healthcare | 2 | $330B |
|
||
Cash-flow waterfall
monthlySold comps — $/sqft
last 12 mo · ≤1 miLoading sold comps…