 🏷️ Likely Rental
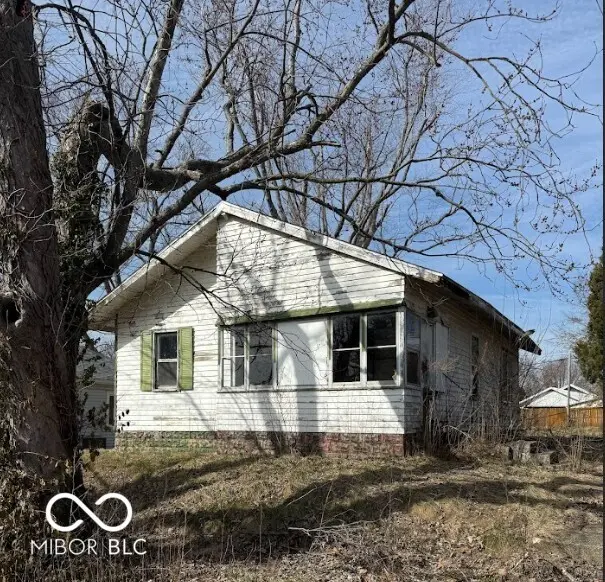
812 W 3rd St · Bicknell, IN
Flood risk 1/10 · Minimal
- FEMA flood zone
- —
- Chance of flooding over 30 yrs
- 0.0%
- Est. flood insurance / yr
- —
Fire risk 1/10 · Minimal
- Est. fire insurance / yr
- $717 – $1,331
Heat risk 4/10 · Minor
- Hot days now (above 106°F)
- 7 days/yr
- Hot days in 30 yrs
- 19 days/yr
Wind risk 2/10 · Minimal
- Chance of severe wind over 30 yrs
- 2.0%
Air-quality risk 2/10 · Minimal
- Unhealthy air days now
- 1 days/yr
- Unhealthy air days in 30 yrs
- 2 days/yr
Risk factors via First Street. Map © Google.
Why this score? — see what drove the D grade
The composite is a weighted blend of 9 inputs, each scored 0–100. Each bar is that input's sub-score; the figure is the points it added to the 100-point composite (weight × sub-score).
- Cash flow +15.0/30.0
- ARV discount +7.5/15.0
- 1% rule +5.0/10.0
- DSCR +5.0/10.0
- Livability +3.2/5.0
- Schools +3.1/10.0
- Rent growth +2.5/5.0
- Condition / age +2.5/5.0
- Appreciation +0.0/10.0
$10,000
🖨 Deal sheet 📄 Offer letter ✓ Due diligence
Listing remarks MLS
Calling All Handy Homeowners! This single-family residence emerges as an exceptional prospect, thoughtfully positioned as a great option for investors. The residence encompasses three inviting bedrooms, each providing a tranquil space for personal retreat and rest. Within its 1272 square feet of living area, this home presents a welcoming expanse, ready to accommodate varied visions and aspirations.
Key facts
- 8,015 sq ft lot
- Garage
- Built 1914
Neighborhood map
What this means for you Summary
Snapshot
- This is a 3-bed/1.0-bath single-family listed at $10k.
Deal economics
- At list price, monthly cash flow is $815 ($10k/yr) — positive.
- The deal already cash-flows at list — no discount required.
- Meets the 1% rule at list price ($1k rent vs $10k).
- Recommended offer: $9k (6.0% below list) — sets the bar for market timing.
Location & tenants
- Location reads 64/100 on livability (#373 in IN) — a middle-class / working-renter tenant base. Strengths: cost of living A+, crime A, housing A-; Watch: health & safety C-, schools F, amenities F.
- North Knox School Corporation (rural): math 28% / reading 45% proficiency, ranked #186 of 301 in IN (top 62%) — families likely to look elsewhere, expect single-tenant / working-renter base with shorter leases.
- Market conditions: 34 active listings in the ZIP; 36 units permitted in Knox County in 2024 (0 in 5+ unit buildings).
Forward outlook
- Local home prices are declining (-3.0%/yr); year-one equity from $69 of loan paydown is wiped out by about $300 of value loss. Plan a longer hold.
- Knox County population projected at -13% by 2050 — secular population decline; favor cash flow + early exit over multi-decade hold.
- At projected returns (-3.0% appreciation + 3.0% rent growth), your $3k cash investment doubles in ~1 year — after that, you're playing with house money.
Negotiation context
- It's been on market 76 days — a 6% lower offer ($9k) is reasonable based on typical stale-listing flexibility.
- 3 sale attempts since 12y ago; this cycle's ask has dropped $20k (67%) from the opening price — seller is motivated, your offer sets the floor, not the list.
Risks & watch-outs
- Watch-outs: built in 1914 — expect roof / HVAC / electrical / plumbing capex.
Questions for the listing agent
- It's been on market 76 days. Have you received any prior offers? Is the seller open to a 6% concession, seller financing, or rate buy-down credit?
- Built in 1914 — when were the roof, HVAC, electrical panel, plumbing, and water heater last replaced?
- Why hasn't it sold? Are there any deal-killer items the seller is aware of (foundation, flood, title, zoning, code violations)?
- Is there a deadline driving the sale (1031 exchange, divorce, estate, relocation)? That informs how much negotiation room exists.
- Schools are F-rated, which usually means shorter tenancies and higher turnover. Who's the typical renter profile here, and what's been the actual vacancy rate?
- The area grade is low — what's the realistic commute time and amenity access for the typical tenant pool here? Any planned neighborhood developments (good or bad) we should know about?
- What's the average days-on-market for RENTAL listings here right now (not sales)? A rising rental-DOM trend means longer vacancies and softer asking-rent achievability than the comps imply.
- What's the recent tenant-quality profile in this submarket — average credit score on applications, eviction rate, late-payment / NSF rate, and stable-employment percentage? A property-management company in the area should have these aggregated.
- How much new for-sale + rental construction is in the pipeline within 1–3 miles? Heavy new supply typically softens prices + rents 12–24 months out; constrained supply supports both.
Investment metrics
- 1% rule
- 11.19% ✓
- Cap rate
- 104.05%
- Cash-on-cash
- 349.13%
- DSCR
- 16.53
- GRM
- 0.7
CMA / ARV
- ARV (median comp)
- $161,843
- List price
- $10,000
- Delta
- -93.82%
- Verdict
- UNDERPRICED
- Comps
- 11 within 1.0 mi
Show comp detail 12 sales within ~0.75 mi
| Address | Dist | Beds/Ba | Sqft | Sold | Price | $/sf | Match |
|---|---|---|---|---|---|---|---|
| 909 W 4th St | 0.07mi | 2/2.0 (-1) | 1,244 (-2%) | 2mo | $83,000 | $67 | 82 |
| 707 W 4th St | 0.08mi | 3/2.0 | 1,320 (+4%) | 6mo | $144,900 | $110 | 81 |
| 412 W 6th St | 0.23mi | 3/2.0 | 1,224 (-4%) | 0mo | $167,000 | $136 | 79 |
| 418 W 7th St | 0.26mi | 3/2.0 | 1,140 (-10%) | 5mo | $99,900 | $88 | 62 |
| 213 W 11th St | 0.52mi | 3/1.0 | 1,328 (+4%) | 7mo | $25,000 | $19 | 62 |
| 617 S Indiana St | 0.74mi | 3/2.0 | 1,300 (+2%) | 0mo | $138,500 | $107 | 58 |
| 316 W 8th St | 0.34mi | 2/1.5 (-1) | 1,117 (-12%) | 1mo | $103,000 | $92 | 56 |
| 504 S Maple St | 0.55mi | 3/1.0 | 1,374 (+8%) | 9mo | $140,000 | $102 | 54 |
| 1008 Miami St | 0.65mi | 2/1.0 (-1) | 1,180 (-7%) | 5mo | $125,000 | $106 | 49 |
| 119 Lemon St | 0.54mi | 2/1.0 (-1) | 1,120 (-12%) | 7mo | $105,500 | $94 | 44 |
| 819 S Main St | 0.72mi | 2/1.5 (-1) | 1,162 (-9%) | 5mo | $48,000 | $41 | 41 |
| 707 S Durbin St | 0.71mi | 3/2.0 | 1,112 (-13%) | 3mo | $125,000 | $112 | 39 |
Match score weights: distance 35% · size 25% · config 20% · recency 20%. Top-matched comps best support the ARV.
Projected returns pro-forma
-3.0% appreciation · 3.0% rent growth · sell at horizon
- IRR
- —
- Equity multiple
- 18.96×
- Total profit
- $50,281
- Equity at exit
- $1,491
- IRR
- —
- Equity multiple
- 40.52×
- Total profit
- $110,663
- Equity at exit
- $865
Cash invested: $2,800 (down + closing). Projections, not guarantees.
Landlord ↔ Tenant lean methodology
- Overall (STATE)
- 90 Strongly Landlord-Friendly
- State Indiana
- 90 Strongly Landlord-Friendly · R+11
- County
- — inherits STATE
- City
- — inherits STATE
ZIP-level market 47512
- Home prices YoY
- -32.1%
- Active inventory
- 34
- Price-to-rent
- 0.7×
Monthly cashflow live
- Estimated rent
- $1,119 medium interval (Pro) →
- Mortgage (P&I)
- −$52
- Tax est. 1.5%
- −$12 /mo · $150/yr
- Insurance
- −$4
- HOA
- −$0
- Vacancy / Maint / Mgmt
- −$235
- Net cashflow
- $815
Break-even live
UW: 25.0% down · 7.5% · 30yr · 1.5% tax · 5.0% vac · 8.0% maint · 8.0% mgmt
Financing live
Cash to close
- Down payment
- $2,500
- Closing costs
- $300
- Reserves months
- —
- Total cash needed
- —
Loan-product check · same deal, 3 products live
Conventional
25% down · 7.5% · 30yr
- Down + closing
- —
- Monthly P&I
- —
- Monthly cashflow
- —
- DSCR
- —
- Eligible?
- —
Personal DTI + credit; lowest rate.
DSCR
20% down · 8.5% · 30yr
- Down + closing
- —
- Monthly P&I
- —
- Monthly cashflow
- —
- DSCR
- —
- Eligible?
- —
No personal income docs; deal must DSCR.
Hard money
10% down · 12.0% · 12mo
- Down + closing
- —
- Monthly P&I
- —
- Monthly cashflow
- —
- DSCR
- —
- Eligible?
- —
Short-term bridge; refi at stabilization.
Listing history 13 events
-
2026-06-05days on market $10,000 Active 76 DOM
-
2026-06-04days on market $10,000 Active 74 DOM
-
2026-06-02days on market $10,000 Active 73 DOM
-
2026-06-01days on market $10,000 Active 72 DOM
-
2026-05-31days on market $10,000 Active 71 DOM
-
2026-05-31days on market $10,000 Active 70 DOM
-
2026-05-14price $10,000 402-char remark
Show marketing remark (402 chars)
Calling All Handy Homeowners! This single-family residence emerges as an exceptional prospect, thoughtfully positioned as a great option for investors. The residence encompasses three inviting bedrooms, each providing a tranquil space for personal retreat and rest. Within its 1272 square feet of living area, this home presents a welcoming expanse, ready to accommodate varied visions and aspirations.
-
2026-04-29price $15,000 402-char remark
Show marketing remark (402 chars)
Calling All Handy Homeowners! This single-family residence emerges as an exceptional prospect, thoughtfully positioned as a great option for investors. The residence encompasses three inviting bedrooms, each providing a tranquil space for personal retreat and rest. Within its 1272 square feet of living area, this home presents a welcoming expanse, ready to accommodate varied visions and aspirations.
-
2026-04-24$30,000 Active 402-char remark
Show marketing remark (402 chars)
Calling All Handy Homeowners! This single-family residence emerges as an exceptional prospect, thoughtfully positioned as a great option for investors. The residence encompasses three inviting bedrooms, each providing a tranquil space for personal retreat and rest. Within its 1272 square feet of living area, this home presents a welcoming expanse, ready to accommodate varied visions and aspirations.
-
2026-03-21$30,000 Active 402-char remark
Show marketing remark (402 chars)
Calling All Handy Homeowners! This single-family residence emerges as an exceptional prospect, thoughtfully positioned as a great option for investors. The residence encompasses three inviting bedrooms, each providing a tranquil space for personal retreat and rest. Within its 1272 square feet of living area, this home presents a welcoming expanse, ready to accommodate varied visions and aspirations.
-
2014-11-21$16,000
ⓘ Source: listings_history table (triggers on properties + properties_extension) + one-shot
backfill from property_details.listing_events for pre-trigger history.
Climate risk First Street
- Flood 1/10 Low 0% chance over 30 yrs
- Wildfire 1/10 Low
- Heat 4/10 Moderate 7 d/yr ≥106°F today · 19 d/yr by 30 yrs out
- Wind 2/10 Low 2% chance of damaging wind over 30 yrs
- Air quality 2/10 Low 1 unhealthy d/yr today · 2 by 30 yrs out
Nearby sold comps map
Loading sold comps map…
Walkable amenities ~0.75 mi
Loading nearby amenities…
Taxation est. · year 1
- Rental income
- $13,424
- − Mortgage interest
- −$560
- − Property taxes
- −$150
- − Insurance
- −$50
- − Repairs & maintenance
- −$1,074
- − Management
- −$1,074
- − Depreciation
- −$291
- Taxable income
- $10,225
- Est. tax owed @ 24.0%
- −$2,454
- After-tax cash flow
- $7,322/yr
For passive investors: Depreciation is non-cash, so a rental often shows a tax loss while cash-flowing — sheltering income. Rental losses are passive: they offset passive income freely, and up to $25,000/yr can offset ordinary (W-2) income if you actively participate and your MAGI is under $100k (phasing out to $0 by $150k); unused losses carry forward. On sale, claimed depreciation is recaptured at up to 25%, and gains may owe capital-gains tax (a 1031 exchange can defer both). Figures are a year-1 estimate at your 24.0% rate — not tax advice; consult a CPA.
Schools (NCES district)
- District
- North Knox School Corporation
- NCES district ID
- 1807830
- Math proficiency
- 28% ▼ -11.00%
- Reading proficiency
- 45% ▼ -3.00%
- Median HH income
- $42,553
- Composite
- 30.82/100
- National rank
- #6139
- State rank
- #186 of 301 in IN
Livability — Bicknell
- Score
- 64/100
- State rank
- #373
- US rank
- #13970
Category grades
Schools grade is shown separately in the Schools card above.
Census & demographics
- Census place
- Bicknell, IN
- City population
- 4,216
- Population (ZIP)
- 4,216
Population outlook (Knox County) Hauer SSP2
- Today (2025)
- 37,092 people
- By 2030
- 36,271 · -2.2%
- By 2040
- 34,196 · -7.8%
- By 2050
- 32,405 · -12.6%
- By 2075
- 28,754 · -22.5%
- By 2100
- 24,110 · -35.0%
Race, ethnicity, and origin ACS 2023
- Neighborhood character
- Predominantly White (91%)
- Race & ethnicity
- White 91% Two or more races 7% Hispanic / Latino 2%
- Common ancestry
- Italian 3% Lithuanian 1% Iranian 1%
- Foreign-born
- 1%
- Languages at home
- 98% English-only · Tagalog/Filipino 1% Spanish 1%
Political lean MEDSL · Knox
- 2024 margin
- Solid R (+50.4) · D 24.0% · R 74.4% · Other 1.6%
- 2008→2024 swing
- -43.9pp toward R · 2008: -6.5pp · 2024: -50.4pp
- All cycles
- 2024: R+50.4 2020: R+47.4 2016: R+47.2 2012: R+28.9 2008: R+6.5
Not yet ingested
- Civics
- —
Market trends
- HPI YoY
- ▼ -90.85%
- Current HPI
- 191.8851
- Rent YoY
- —
- Metro
- —
- State GDP YoY
- ▲ 2.90%
- F500 in state
- 18
Industry mix (Fortune 500 HQ in IN)
| Industry | F500 HQs | Revenue |
|---|---|---|
| Industrial Machinery | 2 | $37B |
|
||
| Healthcare | 1 | $177B |
|
||
| Pharmaceuticals | 1 | $45B |
|
||
| Metals / Steel | 1 | $18B |
|
||
| Agriculture | 1 | $17B |
|
||
| Packaging | 1 | $12B |
|
||
Price history
-37.5% since first listed7 events — show timeline
- 2026-05-14 Price Changed $10,000 IRMLS
- 2026-05-14 Price Changed $10,000 MIBOR as Distributed by MLS Grid
- 2026-04-29 Price Changed $15,000 IRMLS
- 2026-04-29 Price Changed $15,000 MIBOR as Distributed by MLS Grid
- 2026-04-24 Listed $30,000 IRMLS
- 2026-03-21 Listed $30,000 MIBOR as Distributed by MLS Grid
- 2014-11-21 Listed $16,000 IRMLS
Property tax history
-7.0%/yrLatest (2024): $626 · -3.1% YoY. Source: county tax records.
Cash-flow waterfall
monthlySold comps — $/sqft
last 12 mo · ≤1 miLoading sold comps…