8623 Green Bliss · Elmendorf, TX
Flood risk 4/10 · Minor
- FEMA flood zone
- X (unshaded)
- Chance of flooding over 30 yrs
- 0.2%
- Est. flood insurance / yr
- $507 – $1,088
Fire risk 5/10 · Moderate
- Est. fire insurance / yr
- $1,222 – $2,270
Heat risk 8/10 · Major
- Hot days now (above 110°F)
- 7 days/yr
- Hot days in 30 yrs
- 21 days/yr
Wind risk 8/10 · Major
- Chance of severe wind over 30 yrs
- 80.0%
Air-quality risk 2/10 · Minimal
- Unhealthy air days now
- 0 days/yr
- Unhealthy air days in 30 yrs
- 2 days/yr
Risk factors via First Street. Map © Google.
Why this score? — see what drove the B- grade
The composite is a weighted blend of 9 inputs, each scored 0–100. Each bar is that input's sub-score; the figure is the points it added to the 100-point composite (weight × sub-score).
- Cash flow +24.5/30.0
- ARV discount +15.0/15.0
- DSCR +7.9/10.0
- 1% rule +7.1/10.0
- Condition / age +5.0/5.0
- Rent growth +3.6/5.0
- Schools +3.0/10.0
- Livability +2.9/5.0
- Appreciation +0.0/10.0
$160,999
🖨 Deal sheet (PDF) 📄 Offer letter ✓ Due diligence
Listing remarks MLS
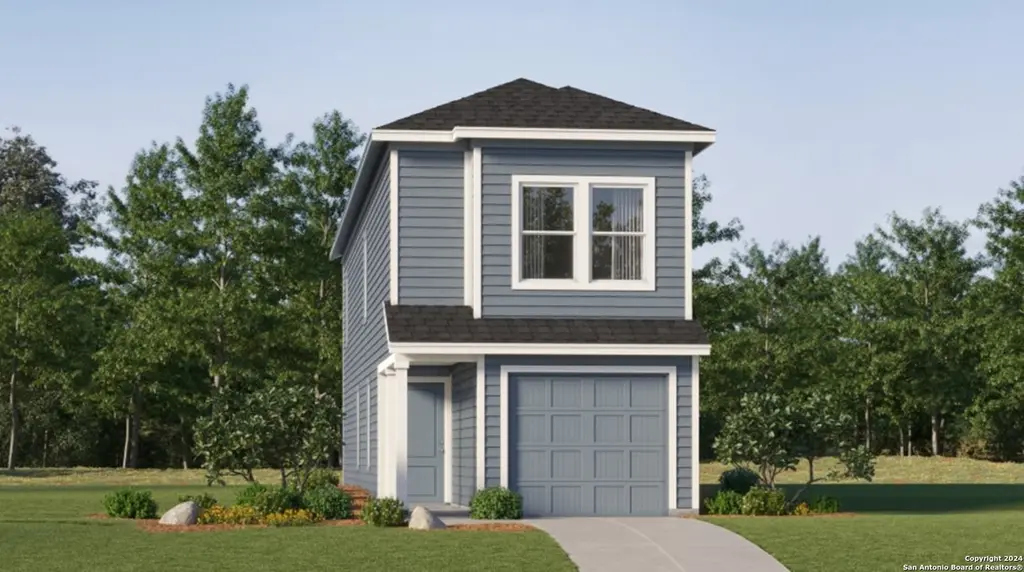
The Cibola - Upon entry of this new two-story home is a well-equipped kitchen, dining area and family room arranged in a desirable open floorplan that promotes seamless transitions between spaces. The second level showcases all four bedrooms to provide restful retreats, including the owner's suite with an adjoining bathroom and walk-in closet. Completing the home is a practical garage for storage space. Estimated Completion June 2026. The completion date, prices and features may vary and are subject to change. Please verify with Lennar directly. Photos are for illustrative purposes only.
Key facts
- 4,791 sq ft lot
- Garage
- Built 2026
Neighborhood map
What this means for you Summary
Snapshot
- This is a 4-bed/2.5-bath single-family listed at $161k. Condition is rated excellent.
Deal economics
- At list price, monthly cash flow is $331 ($4k/yr) — positive.
- The deal already cash-flows at list — no discount required.
- Meets the 1% rule at list price ($2k rent vs $161k).
- Recommended offer: $147k (9.0% below list) — sets the bar for market timing.
- Cap rate 8.8% vs local median 3.5% in Elmendorf — top-decile yield for the area; either an underpriced asset or a hidden risk that comps aren't pricing in. Stress-test before assuming the spread holds.
Location & tenants
- Location reads 58/100 on livability (#1,189 in TX) — a working-class tenant base; expect higher turnover. Strengths: cost of living A+, housing A+, crime A; Watch: amenities F, commute F, employment F.
- Floresville ISD (town): math 32% / reading 36% proficiency, ranked #504 of 826 in TX (top 61%) — families likely to look elsewhere, expect single-tenant / working-renter base with shorter leases.
- Zoned schools: Floresville Middle (math 28% / reading 33%, grade F, #1,036 of 1,662 statewide, top 63%, 904 students, 58% FRL).
- Market conditions: Rents rising fast (+4.3%/yr); 444 active listings in the ZIP; 135 units permitted in Wilson County in 2024 (0 in 5+ unit buildings).
- This rent runs 35% of the median local income ($66k/yr) — at the standard rent-burdened threshold; future hikes will face affordability resistance.
Forward outlook
- Local home prices are declining (-3.0%/yr); year-one equity from $1k of loan paydown is wiped out by about $5k of value loss. Plan a longer hold.
- Wilson County population projected at +46% by 2050 — long-run rental-demand tailwind backs the buy-and-hold thesis.
- At projected returns (-3.0% appreciation + 4.3% rent growth), your $45k cash investment doubles in ~10 years — after that, you're playing with house money.
Negotiation context
- It's been on market 109 days — a 9% lower offer ($147k) is reasonable based on typical stale-listing flexibility.
Risks & watch-outs
- Climate carrying-cost: severe wind risk, 80% chance of damaging wind over 30y; moderate wildfire risk; extreme-heat days projected 7→21/yr by 2055 (HVAC capex compounding) — expect insurance premiums to compound above CPI over the hold.
Questions for the listing agent
- It's been on market 109 days. Have you received any prior offers? Is the seller open to a 9% concession, seller financing, or rate buy-down credit?
- What does the HOA fee cover, when was the last increase, and are there any pending special assessments or reserve-fund shortfalls?
- Why hasn't it sold? Are there any deal-killer items the seller is aware of (foundation, flood, title, zoning, code violations)?
- Is there a deadline driving the sale (1031 exchange, divorce, estate, relocation)? That informs how much negotiation room exists.
- Schools are F-rated, which usually means shorter tenancies and higher turnover. Who's the typical renter profile here, and what's been the actual vacancy rate?
- What's the average days-on-market for RENTAL listings here right now (not sales)? A rising rental-DOM trend means longer vacancies and softer asking-rent achievability than the comps imply.
- What's the recent tenant-quality profile in this submarket — average credit score on applications, eviction rate, late-payment / NSF rate, and stable-employment percentage? A property-management company in the area should have these aggregated.
- How much new for-sale + rental construction is in the pipeline within 1–3 miles? Heavy new supply typically softens prices + rents 12–24 months out; constrained supply supports both.
Investment metrics
- 1% rule
- 1.21% ✓
- Cap rate
- 8.76%
- Cash-on-cash
- 8.81%
- DSCR
- 1.39
- GRM
- 6.9
CMA / ARV
- ARV (median comp)
- $197,126
- List price
- $160,999
- Delta
- -18.33%
- Verdict
- UNDERPRICED
- Comps
- 20 within 1.0 mi
Show comp detail 12 sales within ~0.75 mi
| Address | Dist | Beds/Ba | Sqft | Sold | Price | $/sf | Match |
|---|---|---|---|---|---|---|---|
| 8555 Green Bliss | 0.00mi | 4/2.5 | 1,535 (0%) | 1mo | $162,999 | $106 | 99 |
| 8535 Green Bliss | 0.00mi | 4/2.5 | 1,535 (0%) | 2mo | $163,999 | $107 | 98 |
| 8615 Willow Xing | 0.00mi | 4/2.0 | 1,483 (-3%) | 1mo | $187,999 | $127 | 91 |
| 8559 Willow Xing | 0.00mi | 4/2.0 | 1,483 (-3%) | 2mo | $194,999 | $131 | 91 |
| 8631 Willow Xing | 0.00mi | 4/2.5 | 1,692 (+10%) | 1mo | $194,999 | $115 | 82 |
| 8619 Willow Xing | 0.00mi | 4/2.5 | 1,692 (+10%) | 1mo | $199,999 | $118 | 82 |
| 8555 Willow Xing | 0.00mi | 4/2.5 | 1,692 (+10%) | 1mo | $205,999 | $122 | 82 |
| 8607 Willow Xing | 0.00mi | 4/2.5 | 1,692 (+10%) | 1mo | $222,999 | $132 | 82 |
| 8531 Willow Xing | 0.00mi | 4/2.5 | 1,692 (+10%) | 2mo | $205,999 | $122 | 81 |
| 8635 Willow Xing | 0.00mi | 3/2.0 (-1) | 1,354 (-12%) | 0mo | $174,999 | $129 | 73 |
| 8611 Willow Xing | 0.00mi | 3/2.0 (-1) | 1,354 (-12%) | 1mo | $196,999 | $145 | 73 |
| 8539 Willow Xing | 0.00mi | 3/2.0 (-1) | 1,354 (-12%) | 2mo | $181,999 | $134 | 71 |
Match score weights: distance 35% · size 25% · config 20% · recency 20%. Top-matched comps best support the ARV.
Projected returns pro-forma
-3.0% appreciation · 4.35% rent growth · sell at horizon
- IRR
- -1.3%
- Equity multiple
- 0.95×
- Total profit
- $-2,231
- Equity at exit
- $24,005
- IRR
- 9.9%
- Equity multiple
- 1.82×
- Total profit
- $36,912
- Equity at exit
- $13,920
Cash invested: $45,080 (down + closing). Projections, not guarantees.
Landlord ↔ Tenant lean methodology
- Overall (STATE)
- 87 Strongly Landlord-Friendly
- State Texas
- 87 Strongly Landlord-Friendly · R+5
- County
- — inherits STATE
- City
- — inherits STATE
ZIP-level market 78222
- Home prices YoY
- -4.8%
- Rents YoY
- 4.3%
- Active inventory
- 444
- Price-to-rent
- 6.9×
Monthly cashflow live
- Estimated rent
- $1,954 medium interval (Pro) →
- Mortgage (P&I)
- −$844
- Tax est. 1.5%
- −$201 /mo · $2,415/yr
- Insurance
- −$67
- HOA
- −$100
- Vacancy / Maint / Mgmt
- −$410
- Net cashflow
- $331
Break-even live
Sensitivity live
| Price | -10% $442 | -5% $387 | +0% $331 | +5% $275 | +10% $220 |
|---|---|---|---|---|---|
| Rent | -10% $177 | -5% $254 | +0% $331 | +5% $408 | +10% $485 |
| Rate | -1.0pp $412 | -0.5pp $372 | base $331 | +0.5pp $289 | +1.0pp $247 |
UW: 25.0% down · 7.5% · 30yr · 1.5% tax · 5.0% vac · 8.0% maint · 8.0% mgmt
Financing live
Cash to close
- Down payment
- $40,250
- Closing costs
- $4,830
- Reserves months
- —
- Total cash needed
- —
Loan-product check · same deal, 3 products live
Conventional
25% down · 7.5% · 30yr
- Down + closing
- —
- Monthly P&I
- —
- Monthly cashflow
- —
- DSCR
- —
- Eligible?
- —
Personal DTI + credit; lowest rate.
DSCR
20% down · 8.5% · 30yr
- Down + closing
- —
- Monthly P&I
- —
- Monthly cashflow
- —
- DSCR
- —
- Eligible?
- —
No personal income docs; deal must DSCR.
Hard money
10% down · 12.0% · 12mo
- Down + closing
- —
- Monthly P&I
- —
- Monthly cashflow
- —
- DSCR
- —
- Eligible?
- —
Short-term bridge; refi at stabilization.
HOA detail
- Monthly dues
- $100 · $1,200/yr
Listing history 17 events
-
2026-06-21days on market $160,999 Active 109 DOM
-
2026-06-18days on market $160,999 Active 106 DOM
-
2026-06-17days on market $160,999 Active 105 DOM
-
2026-06-16days on market $160,999 Active 104 DOM
-
2026-06-15statusdays on market $160,999 Active 103 DOM
-
2026-06-13days on market $160,999 Price Change 101 DOM
-
2026-06-09days on market $160,999 Price Change 97 DOM
-
2026-06-08days on market $160,999 Price Change 96 DOM
-
2026-06-07days on market $160,999 Price Change 95 DOM
-
2026-06-04pricedays on market $160,999 Price Change 92 DOM
-
2026-06-03days on market $184,999 Price Change 91 DOM
-
2026-06-02pricestatusdays on market $184,999 Price Change 90 DOM
-
2026-06-01days on market $185,999 Active 89 DOM
-
2026-05-31days on market $185,999 Active 88 DOM
-
2026-05-09price $185,999 594-char remark
Show marketing remark (594 chars)
The Cibola - Upon entry of this new two-story home is a well-equipped kitchen, dining area and family room arranged in a desirable open floorplan that promotes seamless transitions between spaces. The second level showcases all four bedrooms to provide restful retreats, including the owner's suite with an adjoining bathroom and walk-in closet. Completing the home is a practical garage for storage space. Estimated Completion June 2026. The completion date, prices and features may vary and are subject to change. Please verify with Lennar directly. Photos are for illustrative purposes only.
-
2026-03-24price $186,999 594-char remark
Show marketing remark (594 chars)
The Cibola - Upon entry of this new two-story home is a well-equipped kitchen, dining area and family room arranged in a desirable open floorplan that promotes seamless transitions between spaces. The second level showcases all four bedrooms to provide restful retreats, including the owner's suite with an adjoining bathroom and walk-in closet. Completing the home is a practical garage for storage space. Estimated Completion June 2026. The completion date, prices and features may vary and are subject to change. Please verify with Lennar directly. Photos are for illustrative purposes only.
-
2026-03-04$184,999 New 594-char remark
Show marketing remark (594 chars)
The Cibola - Upon entry of this new two-story home is a well-equipped kitchen, dining area and family room arranged in a desirable open floorplan that promotes seamless transitions between spaces. The second level showcases all four bedrooms to provide restful retreats, including the owner's suite with an adjoining bathroom and walk-in closet. Completing the home is a practical garage for storage space. Estimated Completion June 2026. The completion date, prices and features may vary and are subject to change. Please verify with Lennar directly. Photos are for illustrative purposes only.
ⓘ Source: listings_history table (triggers on properties + properties_extension) + one-shot
backfill from property_details.listing_events for pre-trigger history.
Climate risk First Street
- Flood 4/10 Moderate FEMA zone X (unshaded) · 20% chance over 30 yrs
- Wildfire 5/10 Major
- Heat 8/10 Severe 7 d/yr ≥110°F today · 21 d/yr by 30 yrs out
- Wind 8/10 Severe 80% chance of damaging wind over 30 yrs
- Air quality 2/10 Low 0 unhealthy d/yr today · 2 by 30 yrs out
Nearby sold comps map
Loading sold comps map…
Walkable amenities ~0.75 mi
Loading nearby amenities…
Taxation est. · year 1
- Rental income
- $23,447
- − Mortgage interest
- −$9,018
- − Property taxes
- −$2,415
- − Insurance
- −$805
- − Repairs & maintenance
- −$1,876
- − Management
- −$1,876
- − HOA
- −$1,200
- − Depreciation
- −$4,684
- Taxable income
- $1,573
- Est. tax owed @ 24.0%
- −$378
- After-tax cash flow
- $3,594/yr
For passive investors: Depreciation is non-cash, so a rental often shows a tax loss while cash-flowing — sheltering income. Rental losses are passive: they offset passive income freely, and up to $25,000/yr can offset ordinary (W-2) income if you actively participate and your MAGI is under $100k (phasing out to $0 by $150k); unused losses carry forward. On sale, claimed depreciation is recaptured at up to 25%, and gains may owe capital-gains tax (a 1031 exchange can defer both). Figures are a year-1 estimate at your 24.0% rate — not tax advice; consult a CPA.
Condition & rehab AI · 6 photos
This new two-story home is move-in ready with excellent condition and modern finishes. It offers a spacious floor plan, a practical garage, and a well-maintained exterior. Potential buyers and renters will appreciate the home's curb appeal and smart home features.
Value-add opportunities
- Both Painting the exterior and interior walls — Fresh paint enhances curb appeal and interior aesthetics.
- Both Landscaping improvements — Enhanced landscaping can increase both resale and rental value.
- Both Adding smart home features — Modern technology can increase both resale and rental appeal.
- Resale Upgrading the kitchen appliances — Modern appliances can significantly boost resale value.
- Resale Upgrading the bathrooms with smart fixtures — Smart bathroom fixtures can enhance resale value and attract tech-savvy buyers.
- Rental Adding a smart thermostat — A smart thermostat can reduce energy costs and attract renters looking for energy-efficient homes.
Renovation cost estimate screening
Value-add ROI direction
- Both Painting the exterior and interior walls — Fresh paint enhances curb appeal and interior aesthetics. ↑
- Both Landscaping improvements — Enhanced landscaping can increase both resale and rental value. ↑
- Both Adding smart home features — Modern technology can increase both resale and rental appeal. ↑
- Resale Upgrading the kitchen appliances — Modern appliances can significantly boost resale value. ↑
- Resale Upgrading the bathrooms with smart fixtures — Smart bathroom fixtures can enhance resale value and attract tech-savvy buyers. ↑
- Rental Adding a smart thermostat — A smart thermostat can reduce energy costs and attract renters looking for energy-efficient homes. ↑
ⓘ Cost ranges are severity-bucket heuristics (US national rule-of-thumb). Get contractor quotes + a written scope before underwriting a rehab budget.
Schools (NCES district)
- District
- Floresville ISD
- NCES district ID
- 4819350
- Math proficiency
- 32% ▼ -14.00%
- Reading proficiency
- 36% ▼ -5.00%
- Median HH income
- $59,736
- Composite
- 30.44/100
- National rank
- #6234
- State rank
- #504 of 826 in TX
Livability — Elmendorf
- Score
- 58/100
- State rank
- #1189
- US rank
- #20804
Category grades
Schools grade is shown separately in the Schools card above.
Census & demographics
- County
- Bexar County · 1,990,555 people
- Metro
- San Antonio-New Braunfels, TX
- Population (ZIP)
- 26,476
- Household income
- $66,362
- Rent vs Own
- Severe rent burden
- 686.0
Population outlook (Wilson County) Hauer SSP2
- Today (2025)
- 58,434 people
- By 2030
- 63,912 · +9.4%
- By 2040
- 74,704 · +27.8%
- By 2050
- 85,024 · +45.5%
- By 2075
- 111,025 · +90.0%
- By 2100
- 126,692 · +116.8%
Race, ethnicity, and origin ACS 2023
- Neighborhood character
- Majority Hispanic (64%)
- Race & ethnicity
- Hispanic / Latino 64% Two or more races 26% White 19% Black 14% Asian 1%
- Hispanic origin (detail)
- Mexican 55%
- Common ancestry
- Romanian 1% Italian 1% Slovak 1%
- Foreign-born
- 14% · Canada
- Languages at home
- 61% English-only · Spanish 37% Arabic 1%
Political lean MEDSL · Wilson
- 2024 margin
- Solid R (+53.7) · D 22.9% · R 76.6%
- 2008→2024 swing
- -19.8pp toward R · 2008: -33.9pp · 2024: -53.7pp
- All cycles
- 2024: R+53.7 2020: R+48.4 2016: R+47.8 2012: R+43.0 2008: R+33.9
Not yet ingested
- Civics
- —
Market trends
- HPI YoY
- ▼ -14.18%
- Current HPI
- 278.8429
- Rent YoY
- ▲ 4.35%
- Metro
- San Antonio-New Braunfels, TX
- State GDP YoY
- ▲ 3.95%
- F500 in state
- 110
Industry mix (Fortune 500 HQ in TX)
| Industry | F500 HQs | Revenue |
|---|---|---|
| Energy | 16 | $1,198B |
|
||
| Technology | 5 | $198B |
|
||
| Engineering / Construction | 4 | $72B |
|
||
| Energy Services | 3 | $60B |
|
||
| Utilities | 3 | $41B |
|
||
| Healthcare | 2 | $330B |
|
||
Price history
+0.5% since first listed3 events — show timeline
- 2026-05-09 Price Changed $185,999 LERA
- 2026-03-24 Price Changed $186,999 LERA
- 2026-03-04 Listed $184,999 LERA
Cash-flow waterfall
monthlySold comps — $/sqft
last 12 mo · ≤1 miLoading sold comps…