 Duplex
11002 N 27th St · McAllen, TX
Flood risk No data
- FEMA flood zone
- —
- Chance of flooding over 30 yrs
- —
- Est. flood insurance / yr
- —
Fire risk No data
- Est. fire insurance / yr
- —
Heat risk No data
- Hot days now (above threshold)
- —
- Hot days in 30 yrs
- —
Wind risk No data
- Chance of severe wind over 30 yrs
- —
Air-quality risk No data
- Unhealthy air days now
- —
- Unhealthy air days in 30 yrs
- —
Risk factors via First Street. Map © Google.
Why this score? — see what drove the D+ grade
The composite is a weighted blend of 9 inputs, each scored 0–100. Each bar is that input's sub-score; the figure is the points it added to the 100-point composite (weight × sub-score).
- ARV discount +15.0/15.0
- Cash flow +12.6/30.0
- 1% rule +3.8/10.0
- Livability +3.8/5.0
- DSCR +3.7/10.0
- Rent growth +3.1/5.0
- Schools +2.2/10.0
- Condition / age +1.0/5.0
- Appreciation +0.0/10.0
$320,000
🖨 Deal sheet 📄 Offer letter ✓ Due diligence
Multi-family units
County records classify this as Multi-Family (2-4 Unit). Listing-text estimate: 2 units. confirmed
Listing remarks
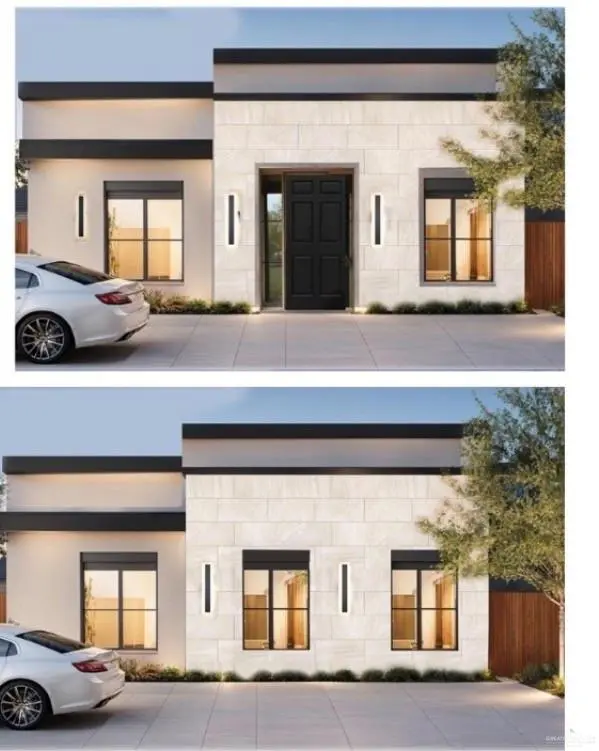
UNDER CONSTRUCTION!! PRE SALE!! Discover this beautiful duplex for sale in McAllen—designed with both homeowners and investors in mind. Live in one unit and rent out the other to help cover your mortgage and build equity faster. Each unit features 3 spacious bedrooms and 2 full bathrooms, along with 2 covered parking spaces per unit. These homes come fully equipped with appliances, including a refrigerator, stove, microwave, washer, and dryer—making them truly move-in or rent-ready. Conveniently located near top shopping centers, popular restaurants, and great schools, this property offers both comfort and strong rental potential in one of the most desirable areas of McAllen.
Key facts
- 5,900 sq ft lot
- Garage
- Built 2026
Tags
Property features AI
Finance
- Other: Living area recorded from blueprints; Green energy efficient: Other
- HOA & community: Mandatory homeowners association with annual fee of $650; POA transfer fee applies; Community features include curbs and sidewalks
Exterior
- Parking: Detached carport providing covered parking for 4 vehicles (4 total parking spaces)
- Utilities: Public water; Single water meter
- Home design: Stucco construction; Shingle roof; Slab foundation
- Construction: Stucco exterior; Sloped shingle roof; Slab foundation
- Exterior features: Wood fencing; Patio; Professional landscaping; Sidewalks; Sprinkler system; Paved road access
Interior
- Kitchen: Microwave; Refrigerator; Electric coil stove/range
- Flooring: Tile flooring
- Heating & cooling: Central heating; Central air conditioning
- Interior features: Ceiling fans; Decorative / high ceilings; Double-pane energy-efficient windows
- Laundry & utility: Laundry room with washer/dryer connections; Washer included; Dryer included; Electric water heater
Neighborhood map
What this means for you Summary
Snapshot
- This is a 2 × 3-bed/2-bath units multifamily listed at $320k. Condition is rated poor.
Deal economics
- At list price, monthly cash flow is $-42 ($-509/yr) — negative. Per door: $-21/mo.
- To cash-flow at today's rent, offer at most $314k (1.9% below list).
- To meet the 1% rule (rent ≥ 1% of price), the offer needs to be $281k (12.1% below list).
- Recommended offer: $281k (12.1% below list) — sets the bar for 1% rule.
- Cap rate 6.1% vs local median 3.7% in McAllen — top-decile yield for the area; either an underpriced asset or a hidden risk that comps aren't pricing in. Stress-test before assuming the spread holds.
Location & tenants
- Location reads 76/100 on livability (#119 in TX, #3,771 nationally) — a middle-class / working-renter tenant base. Strengths: cost of living A+, housing A+, health & safety A+; Watch: employment D, amenities F, commute F.
- Edinburg CISD (urban): math 20% / reading 34% proficiency, ranked #699 of 826 in TX (top 85%) — low school quality limits family demand, transient renter base, plan for 1-2y turnover; 62% free/reduced lunch — lower-income household profile, screen leases tightly.
- Zoned schools: Cavazos El (math 37% / reading 42%, grade F, #1,545 of 4,322 statewide, top 38%, 409 students, 83% FRL); Elias Longoria Sr Middle (math 16% / reading 35%, grade F, #1,236 of 1,662 statewide, top 76%, 804 students, 82% FRL); Robert R Vela H S (math 27% / reading 48%, grade F, #888 of 1,632 statewide, top 55%, 2,189 students, 62% FRL).
- Market conditions: Rents rising (+2.6%/yr); 888 active listings in the ZIP; 21 comparable units currently listed for rent nearby; rentals at typical pace (median 23d on market — plan ~3-4 weeks tenant-placement turnaround); solid renter incomes; 7,378 units permitted in Hidalgo County in 2024 (641 in 5+ unit buildings).
- This rent runs 41% of the median local income ($82k/yr) — at the standard rent-burdened threshold; future hikes will face affordability resistance.
Forward outlook
- Local home prices are declining (-3.0%/yr); year-one equity from $2k of loan paydown is wiped out by about $10k of value loss. Plan a longer hold.
- Hidalgo County population projected at +28% by 2050 — long-run rental-demand tailwind backs the buy-and-hold thesis.
Negotiation context
- It's been on market 48 days — a 3% lower offer ($310k) is reasonable based on typical stale-listing flexibility.
Questions for the listing agent
- What do current leases actually rent for vs. the listed asking? Can we see a recent rent roll and the last 12 months of T-12 income?
- It's been on market 48 days. Have you received any prior offers? Is the seller open to a 12% concession, seller financing, or rate buy-down credit?
- Can we see the unit-by-unit rent roll, current vacancy, and any below-market leases? What's the average tenancy length?
- What capital expenditures (roof, boiler, parking lot, exteriors) have been made in the last 5 years, and what's planned in the next 2?
- Have any recent inspections been done? Can we get a copy of the seller's disclosures and any deferred-maintenance estimates?
- What does the HOA fee cover, when was the last increase, and are there any pending special assessments or reserve-fund shortfalls?
- Is there a deadline driving the sale (1031 exchange, divorce, estate, relocation)? That informs how much negotiation room exists.
- Schools are B-rated — typically a magnet for longer-tenancy family renters. What's the average tenant stay here, and is there a school-zone premium baked into asking?
- The area grade is low — what's the realistic commute time and amenity access for the typical tenant pool here? Any planned neighborhood developments (good or bad) we should know about?
- What's the average days-on-market for RENTAL listings here right now (not sales)? A rising rental-DOM trend means longer vacancies and softer asking-rent achievability than the comps imply.
- What's the recent tenant-quality profile in this submarket — average credit score on applications, eviction rate, late-payment / NSF rate, and stable-employment percentage? A property-management company in the area should have these aggregated.
- How much new apartment / multifamily construction is in the pipeline within 1–3 miles? Heavy new supply (>2% of stock underway) typically softens rents 12–24 months out; light construction supports rent growth.
Investment metrics
- 1% rule
- 0.88% ✗
- Cap rate
- 6.13%
- Cash-on-cash
- -0.57%
- DSCR
- 0.97
- GRM
- 9.5
CMA / ARV
- ARV (median comp)
- $403,808
- List price
- $320,000
- Delta
- -20.75%
- Verdict
- UNDERPRICED
- Comps
- 2 within 2.0 mi
Projected returns pro-forma
-3.0% appreciation · 2.57% rent growth · sell at horizon
- IRR
- -17.7%
- Equity multiple
- 0.38×
- Total profit
- $-55,690
- Equity at exit
- $47,713
- IRR
- -10.6%
- Equity multiple
- 0.37×
- Total profit
- $-56,595
- Equity at exit
- $27,668
Cash invested: $89,600 (down + closing). Projections, not guarantees.
Landlord ↔ Tenant lean methodology
- Overall (STATE)
- 87 Strongly Landlord-Friendly
- State Texas
- 87 Strongly Landlord-Friendly · R+5
- County
- — inherits STATE
- City
- — inherits STATE
ZIP-level market 78504
- Home prices YoY
- -29.4%
- Rents YoY
- 2.6%
- Active inventory
- 888
- Price-to-rent
- 19.0×
Monthly cashflow live
- Estimated rent
- $2,814 high interval (Pro) →
- Mortgage (P&I)
- −$1,678
- Tax est. 1.5%
- −$400 /mo · $4,800/yr
- Insurance
- −$133
- HOA
- −$54
- Vacancy / Maint / Mgmt
- −$591
- Net cashflow
- $-42
Break-even live
2-unit breakdown (identical units grouped — click to expand)
| Units | Beds | Baths | Est. rent |
|---|---|---|---|
| 2× units | 3 | 2 | $2,814 |
| #1 | 3 | 2 | $1,407 |
| #2 | 3 | 2 | $1,407 |
| Total (2 units) | $2,814 | ||
UW: 25.0% down · 7.5% · 30yr · 1.5% tax · 5.0% vac · 8.0% maint · 8.0% mgmt
Financing live
Cash to close
- Down payment
- $80,000
- Closing costs
- $9,600
- Reserves months
- —
- Total cash needed
- —
Loan-product check · same deal, 3 products live
Conventional
25% down · 7.5% · 30yr
- Down + closing
- —
- Monthly P&I
- —
- Monthly cashflow
- —
- DSCR
- —
- Eligible?
- —
Personal DTI + credit; lowest rate.
DSCR
20% down · 8.5% · 30yr
- Down + closing
- —
- Monthly P&I
- —
- Monthly cashflow
- —
- DSCR
- —
- Eligible?
- —
No personal income docs; deal must DSCR.
Hard money
10% down · 12.0% · 12mo
- Down + closing
- —
- Monthly P&I
- —
- Monthly cashflow
- —
- DSCR
- —
- Eligible?
- —
Short-term bridge; refi at stabilization.
Rent comps 21 comps
| Address | Beds | Baths | Sqft | Rent | $/sqft | DOM | Units | Dist |
|---|---|---|---|---|---|---|---|---|
| 10315 N 26th Ln McAllen, TX | 3.0 | 2.5 | 2124 | $2,300 | $1.08 | 14d | 1 | 0.08mi |
| 3132 Zurich Ave McAllen, TX | 3.0 | 2.0 | 1400 | $1,900 | $1.36 | 19d | 1 | 0.44mi |
| 2909 Fuerte Ave McAllen, TX | 3.0 | 2.0 | 1440 | $1,600 | $1.11 | 43d | 1 | 0.49mi |
| 2908 Providence Ave McAllen, TX | 3.0 | 2.5 | 1646 | $1,750 | $1.06 | 43d | 1 | 0.67mi |
| 2920 Providence Ave McAllen, TX | 3.0 | 2.5 | 1848 | $1,600 | $0.87 | 23d | 1 | 0.68mi |
| 3213 Princeton Ave McAllen, TX | 3.0 | 2.5 | 1868 | $1,850 | $0.99 | 14d | 1 | 0.82mi |
| 9104 N 28th St McAllen, TX | 3.0 | 2.0 | 1747 | $1,900 | $1.09 | 14d | 1 | 0.89mi |
| 10333 N 15th St McAllen, TX | 3.0 | 2.0 | 1414 | $2,100 | $1.49 | 14d | 1 | 0.92mi |
| 10321 N 15th St McAllen, TX | 3.0 | 2.0 | 1502 | $2,000 | $1.33 | 14d | 1 | 0.92mi |
| 10321 N 15th St McAllen, TX | 3.0 | 2.0 | 1502 | $2,200 | $1.46 | 43d | 1 | 0.92mi |
| 10221 N 15th St McAllen, TX | 3.0 | 2.0 | 1418 | $2,200 | $1.55 | 43d | 1 | 0.92mi |
| 10218 N 15th St McAllen, TX | 3.0 | 2.5 | 1768 | $3,150 | $1.78 | 43d | 1 | 0.95mi |
| 10328 N 13th St McAllen, TX | 3.0 | 2.0 | 1963 | $2,100 | $1.07 | 19d | 1 | 1.08mi |
| 1800 Kingsborough Ave McAllen, TX | 3.0 | 2.0 | 2027 | $2,200 | $1.09 | 23d | 1 | 1.18mi |
| 1304 Providence Ave McAllen, TX | 3.0 | 2.5 | 2029 | $3,750 | $1.85 | 43d | 1 | 1.23mi |
| 4923 N 35th Ln McAllen, TX | 2.0–4.0 | 2.0–2.5 | 1373 | $1,690 | $1.23 | 14d | 11 | 1.26mi |
| 1205 Ozark Ave McAllen, TX | 3.0 | 3.0 | 1955 | $2,800 | $1.43 | 23d | 1 | 1.31mi |
| 2809 Grambling Ave McAllen, TX | 3.0 | 2.5 | 2152 | $2,500 | $1.16 | 43d | 1 | 1.32mi |
| 2613 Fairmont Ave McAllen, TX | 3.0 | 2.0 | 1735 | $2,000 | $1.15 | 43d | 1 | 1.36mi |
| 8406 N 33rd Ln McAllen, TX | 3.0 | 2.0 | 1448 | $2,000 | $1.38 | 14d | 1 | 1.40mi |
| 8330 N 34th Ln McAllen, TX | 2.0 | 3.0 | 1458 | $2,250 | $1.54 | 23d | 1 | 1.40mi |
HOA detail
- Monthly dues
- $54 · $648/yr
Listing history 16 events
-
2026-06-18days on market $320,000 Active 48 DOM
-
2026-06-17days on market $320,000 Active 47 DOM
-
2026-06-16days on market $320,000 Active 46 DOM
-
2026-06-15days on market $320,000 Active 45 DOM
-
2026-06-14days on market $320,000 Active 43 DOM
-
2026-06-13days on market $320,000 Active 42 DOM
-
2026-06-10days on market $320,000 Active 40 DOM
-
2026-06-09days on market $320,000 Active 39 DOM
-
2026-06-08days on market $320,000 Active 38 DOM
-
2026-06-07days on market $320,000 Active 37 DOM
-
2026-06-03days on market $320,000 Active 33 DOM
-
2026-06-02days on market $320,000 Active 32 DOM
-
2026-06-01days on market $320,000 Active 31 DOM
-
2026-05-31days on market $320,000 Active 30 DOM
-
2026-05-31days on market $320,000 Active 29 DOM
-
2026-05-01$320,000 Active 852-char remark
ⓘ Source: listings_history table (triggers on properties + properties_extension) + one-shot
backfill from property_details.listing_events for pre-trigger history.
Nearby sold comps map
Loading sold comps map…
Walkable amenities ~0.75 mi
Loading nearby amenities…
Taxation est. · year 1
- Rental income
- $33,768
- − Mortgage interest
- −$17,925
- − Property taxes
- −$4,800
- − Insurance
- −$1,600
- − Repairs & maintenance
- −$2,701
- − Management
- −$2,701
- − HOA
- −$648
- − Depreciation
- −$9,309
- Taxable loss
- −$5,917
- Est. tax savings @ 24.0%
- +$1,420
- After-tax cash flow
- $911/yr
For passive investors: Depreciation is non-cash, so a rental often shows a tax loss while cash-flowing — sheltering income. Rental losses are passive: they offset passive income freely, and up to $25,000/yr can offset ordinary (W-2) income if you actively participate and your MAGI is under $100k (phasing out to $0 by $150k); unused losses carry forward. On sale, claimed depreciation is recaptured at up to 25%, and gains may owe capital-gains tax (a 1031 exchange can defer both). Figures are a year-1 estimate at your 24.0% rate — not tax advice; consult a CPA.
Condition & rehab AI · 1 photo
This multi-family property is under construction and requires extensive repairs and updates to become move-in or rent-ready. Significant investments in the roof, exterior, interior, and systems are necessary to improve its condition and increase its value.
Repairs flagged
- Major roof — No visible roof in the satellite image.
- Major exterior — No visible exterior in the satellite image.
- Major flooring — No visible flooring in the satellite image.
- Major interior walls/paint — No visible interior walls/paint in the satellite image.
- Major systems — No visible systems in the satellite image.
Value-add opportunities
- Both roof replacement — A new roof would significantly improve the home's appearance and value.
- Both exterior painting and landscaping — A fresh coat of paint and landscaping would enhance curb appeal and attract potential buyers/tenants.
- Both interior painting and updates — Updating the interior paint and adding minor updates would make the home more appealing and increase its value.
- Both system upgrades — Upgrading the HVAC and other systems would improve comfort and energy efficiency, enhancing both resale and rental value.
Renovation cost estimate screening
| Repair item | Severity | Est. cost |
|---|---|---|
| roof · No visible roof in the satellite image. | Major | $15,000–50,000 |
| exterior · No visible exterior in the satellite image. | Major | $15,000–50,000 |
| flooring · No visible flooring in the satellite image. | Major | $15,000–50,000 |
| interior walls/paint · No visible interior walls/paint in the satellite image. | Major | $15,000–50,000 |
| systems · No visible systems in the satellite image. | Major | $15,000–50,000 |
| Total estimated repair cost · 5 items | $75,000–250,000 |
Value-add ROI direction
- Both roof replacement — A new roof would significantly improve the home's appearance and value. ↑
- Both exterior painting and landscaping — A fresh coat of paint and landscaping would enhance curb appeal and attract potential buyers/tenants. ↑
- Both interior painting and updates — Updating the interior paint and adding minor updates would make the home more appealing and increase its value. ↑
- Both system upgrades — Upgrading the HVAC and other systems would improve comfort and energy efficiency, enhancing both resale and rental value. ↑
ⓘ Cost ranges are severity-bucket heuristics (US national rule-of-thumb). Get contractor quotes + a written scope before underwriting a rehab budget.
Schools (NCES district)
- District
- Edinburg CISD
- NCES district ID
- 4818180
- Math proficiency
- 20% ▼ -34.00%
- Reading proficiency
- 34% ▼ -11.00%
- Median HH income
- $36,985
- Composite
- 22.42/100
- National rank
- #8114
- State rank
- #699 of 826 in TX
Livability — McAllen
- Score
- 76/100
- State rank
- #119
- US rank
- #3771
Category grades
Schools grade is shown separately in the Schools card above.
Census & demographics
- Census place
- McAllen, TX
- County
- Hidalgo County · 623,128 people
- City population
- 144,650
- Metro
- McAllen-Edinburg-Mission, TX
- Population (ZIP)
- 63,094
- Household income
- $81,905
- Rent vs Own
- Severe rent burden
- 1468.0
Population outlook (Hidalgo County) Hauer SSP2
- Today (2025)
- 955,232 people
- By 2030
- 1,009,774 · +5.7%
- By 2040
- 1,120,332 · +17.3%
- By 2050
- 1,225,036 · +28.2%
- By 2075
- 1,439,189 · +50.7%
- By 2100
- 1,533,429 · +60.5%
Race, ethnicity, and origin ACS 2023
- Neighborhood character
- Predominantly Hispanic (82%)
- Race & ethnicity
- Hispanic / Latino 82% Two or more races 39% White 11% Asian 5%
- Hispanic origin (detail)
- Mexican 75%
- Common ancestry
- Lithuanian 1% Italian 1%
- Foreign-born
- 24% · Canada, South Korea, Vietnam
- Languages at home
- 34% English-only · Spanish 62% Other Asian/Pacific 1% Tagalog/Filipino 1%
Political lean MEDSL · Hidalgo
- 2024 margin
- Toss-up / Even · D 48.1% · R 51.0%
- 2008→2024 swing
- -41.6pp toward R · 2008: 38.7pp · 2024: -2.9pp
- All cycles
- 2024: R+2.9 2020: D+17.1 2016: D+40.5 2012: D+41.8 2008: D+38.7
Not yet ingested
- Civics
- —
Market trends
- HPI YoY
- ▼ -80.87%
- Current HPI
- 194.1764
- Rent YoY
- ▲ 2.57%
- Metro
- McAllen-Edinburg-Mission, TX
- State GDP YoY
- ▲ 3.95%
- F500 in state
- 110
Industry mix (Fortune 500 HQ in TX)
| Industry | F500 HQs | Revenue |
|---|---|---|
| Energy | 16 | $1,198B |
|
||
| Technology | 5 | $198B |
|
||
| Engineering / Construction | 4 | $72B |
|
||
| Energy Services | 3 | $60B |
|
||
| Utilities | 3 | $41B |
|
||
| Healthcare | 2 | $330B |
|
||
Price history
1 event — show timeline
- 2026-05-01 Listed $320,000 MCALLENMLS
Cash-flow waterfall
monthlySold comps — $/sqft
last 12 mo · ≤1 miLoading sold comps…