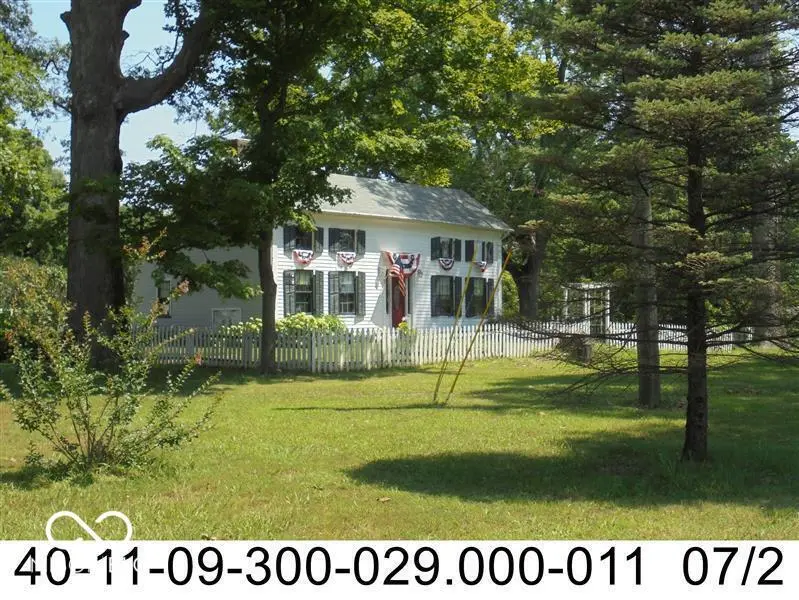
7660 W Us Highway 50 · Hayden, IN
Flood risk 1/10 · Minimal
- FEMA flood zone
- X (unshaded)
- Chance of flooding over 30 yrs
- 0.0%
- Est. flood insurance / yr
- $507 – $1,088
Fire risk 1/10 · Minimal
- Est. fire insurance / yr
- $717 – $1,331
Heat risk 4/10 · Minor
- Hot days now (above 104°F)
- 7 days/yr
- Hot days in 30 yrs
- 19 days/yr
Wind risk 2/10 · Minimal
- Chance of severe wind over 30 yrs
- 1.0%
Air-quality risk 1/10 · Minimal
- Unhealthy air days now
- 0 days/yr
- Unhealthy air days in 30 yrs
- 0 days/yr
Risk factors via First Street. Map © Google.
Why this score? — see what drove the B- grade
The composite is a weighted blend of 9 inputs, each scored 0–100. Each bar is that input's sub-score; the figure is the points it added to the 100-point composite (weight × sub-score).
- Cash flow +26.1/30.0
- ARV discount +15.0/15.0
- DSCR +8.8/10.0
- 1% rule +7.0/10.0
- Livability +3.5/5.0
- Schools +3.0/10.0
- Rent growth +2.5/5.0
- Condition / age +2.5/5.0
- Appreciation +0.0/10.0
$125,000
🖨 Deal sheet 📄 Offer letter ✓ Due diligence
Listing remarks
Real Estate Auction Saturday May 16, 2026 at 12 Noon. Personal Property Auction will be at 10:00AM. Open House Sunday May 3rd 1:00PM -3:00PM. This is a Single Family Home on 3.76 Acres with 3 Bedroom 1 Bath. Enjoy the countryside from the 320 Sq Ft Patio facing the large back yard. Property Includes 3025 Sq Ft Barn. It has Public Water & Electricity. Conveniently located between Seymour and North Vernon near Hayden on US Hwy 50. Built in 1900, this historic home offers timeless curb appeal with its charming architectural details. Don't miss this opportunity to own a part of history. Real Estate is sold "As Is".
Key facts
- Electricity
- 3.76 acres
- 320 sq ft patio
Tags
Property features AI
Exterior
- Utilities: Public water; Septic system
- Home design: Single family residence; One-and-a-half story
- Construction: Vinyl siding; Crawl space foundation
- Exterior features: Approximately 3.76 acres (3–5 acres)
Interior
- Kitchen: No appliances included
- Bedrooms: 3 bedrooms total (1 on the main level, 2 on the upper level)
- Flooring: Hardwood floors
- Bathrooms: 1 full bathroom (on main level)
- Heating & cooling: Forced air heating; Window air conditioning units
- Interior features: Hardwood floors; Accessible entrance; 36-inch wide hallway; Accessible full bathroom
- Laundry & utility: No laundry appliances listed
Neighborhood map
What this means for you Summary
Snapshot
- This is a 3-bed/1.0-bath single-family listed at $125k.
Deal economics
- At list price, monthly cash flow is $314 ($4k/yr) — positive.
- The deal already cash-flows at list — no discount required.
- Meets the 1% rule at list price ($1k rent vs $125k).
- Recommended offer: $123k (1.5% below list) — sets the bar for market timing.
Location & tenants
- Location reads 69/100 on livability (#180 in IN) — a middle-class / working-renter tenant base. Strengths: employment A+, cost of living A+, housing A; Watch: health & safety D, amenities F, commute F.
- Jennings County School Corporation (rural): math 32% / reading 38% proficiency, ranked #194 of 301 in IN (top 64%) — families likely to look elsewhere, expect single-tenant / working-renter base with shorter leases.
- Zoned schools: Jennings County High School (math 26% / reading 62%, grade F, #189 of 369 statewide, top 51%, 1,184 students, 52% FRL) — zoned schools at 52% FRL track the district average.
- Market conditions: 160 active listings in the ZIP; 84 units permitted in Jennings County in 2024 (0 in 5+ unit buildings).
Forward outlook
- Local home prices are declining (-3.0%/yr); year-one equity from $864 of loan paydown is wiped out by about $4k of value loss. Plan a longer hold.
- Jennings County population projected at -21% by 2050 — secular population decline; favor cash flow + early exit over multi-decade hold.
Negotiation context
- It's been on market 21 days — a 2% lower offer ($123k) is reasonable based on typical stale-listing flexibility.
Risks & watch-outs
- Watch-outs: built in 1900 — expect roof / HVAC / electrical / plumbing capex.
Questions for the listing agent
- Built in 1900 — when were the roof, HVAC, electrical panel, plumbing, and water heater last replaced?
- Is there a deadline driving the sale (1031 exchange, divorce, estate, relocation)? That informs how much negotiation room exists.
- What's the average days-on-market for RENTAL listings here right now (not sales)? A rising rental-DOM trend means longer vacancies and softer asking-rent achievability than the comps imply.
- What's the recent tenant-quality profile in this submarket — average credit score on applications, eviction rate, late-payment / NSF rate, and stable-employment percentage? A property-management company in the area should have these aggregated.
- How much new for-sale + rental construction is in the pipeline within 1–3 miles? Heavy new supply typically softens prices + rents 12–24 months out; constrained supply supports both.
Investment metrics
- 1% rule
- 1.20% ✓
- Cap rate
- 9.31%
- Cash-on-cash
- 10.77%
- DSCR
- 1.48
- GRM
- 7.0
CMA / ARV
- ARV (median comp)
- $208,268
- List price
- $125,000
- Delta
- -39.98%
- Verdict
- UNDERPRICED
- Comps
- 4 within 1.0 mi
Show comp detail 1 sale within ~0.75 mi
| Address | Dist | Beds/Ba | Sqft | Sold | Price | $/sf | Match |
|---|---|---|---|---|---|---|---|
| 7660 W Us Highway 50 | 0.00mi | 3/1.0 | 1,792 (0%) | 0mo | $170,050 | $95 | 100 |
Match score weights: distance 35% · size 25% · config 20% · recency 20%. Top-matched comps best support the ARV.
Projected returns pro-forma
-3.0% appreciation · 3.0% rent growth · sell at horizon
- IRR
- -0.2%
- Equity multiple
- 0.99×
- Total profit
- $-226
- Equity at exit
- $18,638
- IRR
- 9.5%
- Equity multiple
- 1.73×
- Total profit
- $25,663
- Equity at exit
- $10,808
Cash invested: $35,000 (down + closing). Projections, not guarantees.
Landlord ↔ Tenant lean methodology
- Overall (STATE)
- 90 Strongly Landlord-Friendly
- State Indiana
- 90 Strongly Landlord-Friendly · R+11
- County
- — inherits STATE
- City
- — inherits STATE
ZIP-level market 47265
- Home prices YoY
- -31.5%
- Active inventory
- 160
- Price-to-rent
- 7.0×
Monthly cashflow live
- Estimated rent
- $1,495 medium interval (Pro) →
- Mortgage (P&I)
- −$656
- Tax from tax record
- −$160 /mo · $1,915/yr
- Insurance
- −$52
- HOA
- −$0
- Vacancy / Maint / Mgmt
- −$314
- Net cashflow
- $314
Break-even live
UW: 25.0% down · 7.5% · 30yr · 1.5% tax · 5.0% vac · 8.0% maint · 8.0% mgmt
Financing live
Cash to close
- Down payment
- $31,250
- Closing costs
- $3,750
- Reserves months
- —
- Total cash needed
- —
Loan-product check · same deal, 3 products live
Conventional
25% down · 7.5% · 30yr
- Down + closing
- —
- Monthly P&I
- —
- Monthly cashflow
- —
- DSCR
- —
- Eligible?
- —
Personal DTI + credit; lowest rate.
DSCR
20% down · 8.5% · 30yr
- Down + closing
- —
- Monthly P&I
- —
- Monthly cashflow
- —
- DSCR
- —
- Eligible?
- —
No personal income docs; deal must DSCR.
Hard money
10% down · 12.0% · 12mo
- Down + closing
- —
- Monthly P&I
- —
- Monthly cashflow
- —
- DSCR
- —
- Eligible?
- —
Short-term bridge; refi at stabilization.
Listing history 2 events
-
2026-05-18status Pending 639-char remark
-
2026-04-24$125,000 Active 639-char remark
ⓘ Source: listings_history table (triggers on properties + properties_extension) + one-shot
backfill from property_details.listing_events for pre-trigger history.
Tax reassessment forecast IN · Partial reset (capped growth)
- Current annual tax
- $1,915 · $160/mo
- Projected year-2 tax
- $1,915 · $160/mo
- Expected delta
- $0/yr ($0/mo · 0.0%)
ⓘ Screening estimate from a state-policy table — verify with the county assessor before closing.
Climate risk First Street
- Flood 1/10 Low FEMA zone X (unshaded) · 0% chance over 30 yrs
- Wildfire 1/10 Low
- Heat 4/10 Moderate 7 d/yr ≥104°F today · 19 d/yr by 30 yrs out
- Wind 2/10 Low 100% chance of damaging wind over 30 yrs
- Air quality 1/10 Low 0 unhealthy d/yr today · 0 by 30 yrs out
Nearby sold comps map
Loading sold comps map…
Walkable amenities ~0.75 mi
Loading nearby amenities…
Taxation est. · year 1
- Rental income
- $17,944
- − Mortgage interest
- −$7,002
- − Property taxes
- −$1,915
- − Insurance
- −$625
- − Repairs & maintenance
- −$1,436
- − Management
- −$1,436
- − Depreciation
- −$3,636
- Taxable income
- $1,894
- Est. tax owed @ 24.0%
- −$455
- After-tax cash flow
- $3,315/yr
For passive investors: Depreciation is non-cash, so a rental often shows a tax loss while cash-flowing — sheltering income. Rental losses are passive: they offset passive income freely, and up to $25,000/yr can offset ordinary (W-2) income if you actively participate and your MAGI is under $100k (phasing out to $0 by $150k); unused losses carry forward. On sale, claimed depreciation is recaptured at up to 25%, and gains may owe capital-gains tax (a 1031 exchange can defer both). Figures are a year-1 estimate at your 24.0% rate — not tax advice; consult a CPA.
Schools (NCES district)
- District
- Jennings County School Corporation
- NCES district ID
- 1805190
- Math proficiency
- 32% ▼ -11.00%
- Reading proficiency
- 38% ▼ -6.00%
- Median HH income
- $45,418
- Composite
- 29.89/100
- National rank
- #6394
- State rank
- #194 of 301 in IN
Livability — Hayden
- Score
- 69/100
- State rank
- #180
- US rank
- #8365
Category grades
Schools grade is shown separately in the Schools card above.
Census & demographics
- Population (ZIP)
- 20,981
Population outlook (Jennings County) Hauer SSP2
- Today (2025)
- 26,584 people
- By 2030
- 25,591 · -3.7%
- By 2040
- 23,423 · -11.9%
- By 2050
- 20,973 · -21.1%
- By 2075
- 15,445 · -41.9%
- By 2100
- 10,714 · -59.7%
Race, ethnicity, and origin ACS 2023
- Neighborhood character
- Predominantly White (92%)
- Race & ethnicity
- White 92% Hispanic / Latino 4% Two or more races 3%
- Common ancestry
- Slovak 2% Romanian 1% Italian 1%
- Foreign-born
- 1% · Canada
- Languages at home
- 96% English-only · Spanish 2% German/W. Germanic 1%
Political lean MEDSL · Jennings
- 2024 margin
- Solid R (+58.8) · D 19.7% · R 78.5% · Other 1.8%
- 2008→2024 swing
- -50.8pp toward R · 2008: -8.0pp · 2024: -58.8pp
- All cycles
- 2024: R+58.8 2020: R+56.9 2016: R+52.7 2012: R+22.4 2008: R+8.0
Not yet ingested
- Civics
- —
Market trends
- HPI YoY
- ▼ -107.36%
- Current HPI
- 233.0275
- Rent YoY
- —
- Metro
- —
- State GDP YoY
- ▲ 2.90%
- F500 in state
- 18
Industry mix (Fortune 500 HQ in IN)
| Industry | F500 HQs | Revenue |
|---|---|---|
| Industrial Machinery | 2 | $37B |
|
||
| Healthcare | 1 | $177B |
|
||
| Pharmaceuticals | 1 | $45B |
|
||
| Metals / Steel | 1 | $18B |
|
||
| Agriculture | 1 | $17B |
|
||
| Packaging | 1 | $12B |
|
||
Price history
+36.0% since first listed4 events — show timeline
- 2026-06-09 Sold (MLS) $170,050 MIBOR as Distributed by MLS Grid
- 2026-05-18 Pending — MIBOR as Distributed by MLS Grid
- 2026-05-16 Price Changed $170,050 MIBOR as Distributed by MLS Grid
- 2026-04-24 Listed $125,000 MIBOR as Distributed by MLS Grid
Property tax history
+8.4%/yrLatest (2024): $1,915 · +1123.8% YoY. Source: county tax records.
Cash-flow waterfall
monthlySold comps — $/sqft
last 12 mo · ≤1 miLoading sold comps…