62475 29 Palms Hwy #26 · Joshua Tree, CA
Flood risk 4/10 · Minor
- FEMA flood zone
- X
- Chance of flooding over 30 yrs
- 0.22%
- Est. flood insurance / yr
- $507 – $1,088
Fire risk 4/10 · Minor
- Est. fire insurance / yr
- $659 – $1,223
Heat risk 7/10 · Major
- Hot days now (above 99°F)
- 7 days/yr
- Hot days in 30 yrs
- 21 days/yr
Wind risk 1/10 · Minimal
- Chance of severe wind over 30 yrs
- —
Air-quality risk 6/10 · Moderate
- Unhealthy air days now
- 10 days/yr
- Unhealthy air days in 30 yrs
- 14 days/yr
Risk factors via First Street. Map © Google.
Why this score? — see what drove the B- grade
The composite is a weighted blend of 9 inputs, each scored 0–100. Each bar is that input's sub-score; the figure is the points it added to the 100-point composite (weight × sub-score).
- Cash flow +30.0/30.0
- 1% rule +10.0/10.0
- DSCR +10.0/10.0
- ARV discount +7.5/15.0
- Livability +2.5/5.0
- Condition / age +2.5/5.0
- Rent growth +2.2/5.0
- Schools +2.2/10.0
- Appreciation +0.0/10.0
$80,000
🖨 Deal sheet (PDF) 📄 Offer letter ✓ Due diligence
Listing remarks MLS
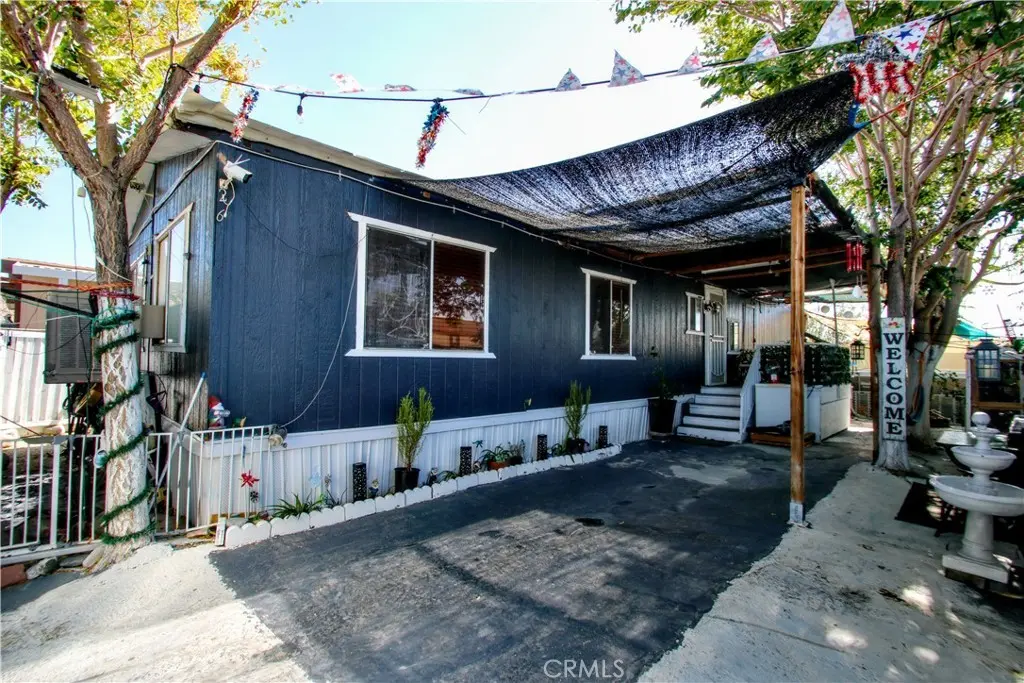
Welcome to Joshua Mobile Estates. This 2-bedroom, 2-bath manufactured home offers comfort, privacy, and convenience right in the heart of Joshua Tree. Step inside to an open layout with updated bathrooms, new laminate flooring, and a remodeled kitchen with Formica counters, refrigerator, dishwasher, and 6-burner stove included. Central air and heat keep the home comfortable year-round, and the separate laundry room comes with washer and dryer. The property is fully enclosed by a 6 foot privacy fence, giving you a private outdoor space to relax or entertain while enjoying desert and mountain views. Just steps from the community pool and walking distance to downtown Joshua Tree Village, the JT Saloon, shops, and restaurants, with the National Park only minutes away. With affordable space rent and move-in ready updates, this home is a great fit for anyone ready to make Joshua Tree their home.
Key facts
- Remodeled kitchen
- Central air and heat
- Updated bathrooms
Tags
Neighborhood map
What this means for you Summary
Snapshot
- This is a 2-bed/1.0-bath manufactured listed at $80k.
Deal economics
- At list price, monthly cash flow is $673 ($8k/yr) — positive.
- The deal already cash-flows at list — no discount required.
- Meets the 1% rule at list price ($2k rent vs $80k).
- Recommended offer: $70k (12.0% below list) — sets the bar for market timing.
- Cap rate 16.4% vs local median 2.7% in Joshua Tree — top-decile yield for the area; either an underpriced asset or a hidden risk that comps aren't pricing in. Stress-test before assuming the spread holds.
Location & tenants
- Location reads 50/100 on livability (#1,114 in CA) — a working-class tenant base; expect higher turnover. Strengths: housing A+; Watch: crime F, amenities F, commute F.
- Morongo Unified (town): math 15% / reading 38% proficiency, ranked #395 of 517 in CA (top 76%) — low school quality limits family demand, transient renter base, plan for 1-2y turnover.
- Zoned schools: Joshua Tree Elementary (math 12% / reading 22%, grade F, #1,340 of 1,571 statewide, top 88%, 276 students, 78% FRL); La Contenta Middle (math 11% / reading 27%, grade F, #426 of 498 statewide, top 86%, 650 students, 72% FRL); Yucca Valley High (math 15% / reading 49%, grade F, #674 of 1,170 statewide, top 59%, 1,264 students, 64% FRL) — zoned schools average 71% FRL vs 56% district-wide (15 pts higher); higher-poverty schools than district average — tighter screening recommended.
- Market conditions: Rents soft (-1.1%/yr); 536 active listings in the ZIP; 23 comparable units currently listed for rent nearby; rentals at typical pace (median 27d on market — plan ~3-4 weeks tenant-placement turnaround); 5,458 units permitted in San Bernardino County in 2024 (1,500 in 5+ unit buildings).
Forward outlook
- Local home prices are declining (-3.0%/yr); year-one equity from $553 of loan paydown is wiped out by about $2k of value loss. Plan a longer hold.
- San Bernardino County population projected at +15% by 2050 — modest demand growth; plan on rents tracking national, not racing it.
- At projected returns (-3.0% appreciation + 0.0% rent growth), your $22k cash investment doubles in ~4 years — after that, you're playing with house money.
Negotiation context
- It's been on market 305 days — a 12% lower offer ($70k) is reasonable based on typical stale-listing flexibility.
- 4 sale attempts since 15y ago; this cycle's ask has dropped $5k (6%) from the opening price — seller is motivated, your offer sets the floor, not the list.
- Current owner paid $12k; list at $80k implies a 592% gain — meaningful room to come down on a strong offer.
Risks & watch-outs
- Climate carrying-cost: extreme-heat days projected 7→21/yr by 2055 (HVAC capex compounding) — expect insurance premiums to compound above CPI over the hold.
Questions for the listing agent
- It's been on market 305 days. Have you received any prior offers? Is the seller open to a 12% concession, seller financing, or rate buy-down credit?
- Why hasn't it sold? Are there any deal-killer items the seller is aware of (foundation, flood, title, zoning, code violations)?
- Is there a deadline driving the sale (1031 exchange, divorce, estate, relocation)? That informs how much negotiation room exists.
- Schools are F-rated, which usually means shorter tenancies and higher turnover. Who's the typical renter profile here, and what's been the actual vacancy rate?
- Crime grade is F in this area — have there been break-ins, vandalism, or insurance claims at this property in the last 3 years? What carrier currently insures it and at what premium?
- What's the average days-on-market for RENTAL listings here right now (not sales)? A rising rental-DOM trend means longer vacancies and softer asking-rent achievability than the comps imply.
- What's the recent tenant-quality profile in this submarket — average credit score on applications, eviction rate, late-payment / NSF rate, and stable-employment percentage? A property-management company in the area should have these aggregated.
- How much new for-sale + rental construction is in the pipeline within 1–3 miles? Heavy new supply typically softens prices + rents 12–24 months out; constrained supply supports both.
Investment metrics
- 1% rule
- 1.94% ✓
- Cap rate
- 16.39%
- Cash-on-cash
- 36.07%
- DSCR
- 2.60
- GRM
- 4.3
CMA / ARV
- ARV (median comp)
- $161,671
- List price
- $80,000
- Delta
- -50.52%
- Verdict
- UNDERPRICED
- Comps
- 2 within 2.0 mi
Projected returns pro-forma
-3.0% appreciation · 0.0% rent growth · sell at horizon
- IRR
- 28.4%
- Equity multiple
- 2.13×
- Total profit
- $25,391
- Equity at exit
- $11,928
- IRR
- 34.0%
- Equity multiple
- 3.67×
- Total profit
- $59,842
- Equity at exit
- $6,917
Cash invested: $22,400 (down + closing). Projections, not guarantees.
Landlord ↔ Tenant lean methodology
- Overall (STATE)
- 18 Strongly Tenant-Friendly
- State California
- 18 Strongly Tenant-Friendly · D+13
- County
- — inherits STATE
- City
- — inherits STATE
ZIP-level market 92252
- Home prices YoY
- -7.1%
- Rents YoY
- -1.1%
- Active inventory
- 536
- Price-to-rent
- 4.3×
Monthly cashflow live
- Estimated rent
- $1,552 high interval (Pro) →
- Mortgage (P&I)
- −$420
- Tax est. 1.5%
- −$100 /mo · $1,200/yr
- Insurance
- −$33
- HOA
- −$0
- Lot rent leased land?
- −$0
- Vacancy / Maint / Mgmt
- −$326
- Net cashflow
- $673
Break-even live
Sensitivity live
| Price | -10% $729 | -5% $701 | +0% $673 | +5% $646 | +10% $618 |
|---|---|---|---|---|---|
| Rent | -10% $551 | -5% $612 | +0% $673 | +5% $735 | +10% $796 |
| Rate | -1.0pp $714 | -0.5pp $694 | base $673 | +0.5pp $653 | +1.0pp $631 |
UW: 25.0% down · 7.5% · 30yr · 1.5% tax · 5.0% vac · 8.0% maint · 8.0% mgmt
Financing live
Cash to close
- Down payment
- $20,000
- Closing costs
- $2,400
- Reserves months
- —
- Total cash needed
- —
Loan-product check · same deal, 3 products live
Conventional
25% down · 7.5% · 30yr
- Down + closing
- —
- Monthly P&I
- —
- Monthly cashflow
- —
- DSCR
- —
- Eligible?
- —
Personal DTI + credit; lowest rate.
DSCR
20% down · 8.5% · 30yr
- Down + closing
- —
- Monthly P&I
- —
- Monthly cashflow
- —
- DSCR
- —
- Eligible?
- —
No personal income docs; deal must DSCR.
Hard money
10% down · 12.0% · 12mo
- Down + closing
- —
- Monthly P&I
- —
- Monthly cashflow
- —
- DSCR
- —
- Eligible?
- —
Short-term bridge; refi at stabilization.
Rent comps 23 comps
| Address | Beds | Baths | Sqft | Rent | $/sqft | DOM | Units | Dist |
|---|---|---|---|---|---|---|---|---|
| 61974 Sunburst Cir Joshua Tree, CA | 2.0 | 2.0 | 1033 | $1,895 | $1.83 | 14d | 1 | 0.28mi |
| 62220 Verbena Rd Unit 2 Joshua Tree, CA | 2.0 | 2.0 | 975 | $1,495 | $1.53 | 46d | 1 | 0.36mi |
| 61929 Valley View Cir Joshua Tree, CA | 3.0 | 2.0 | 1404 | $1,900 | $1.35 | 7d | 1 | 0.36mi |
| 61934 Verbena Rd Joshua Tree, CA | 2.0 | 1.0 | 800 | $1,595 | $1.99 | 27d | 1 | 0.49mi |
| 6252 El Reposo St Joshua Tree, CA | 3.0 | 2.0 | 1404 | $2,000 | $1.42 | 46d | 1 | 0.59mi |
| 61814 Valley View Cir Joshua Tree, CA | 3.0 | 2.0 | 1200 | $2,200 | $1.83 | 27d | 1 | 0.60mi |
| 61874 Sunburst Cir Joshua Tree, CA | 3.0 | 2.0 | 1056 | $2,400 | $2.27 | 46d | 1 | 0.63mi |
| 6655 Sunset Rd Unit G Joshua Tree, CA | 2.0 | 1.5 | 900 | $1,300 | $1.44 | 46d | 1 | 0.65mi |
| 61638 El Reposo Cir Joshua Tree, CA | 3.0 | 1.0 | 1175 | $2,200 | $1.87 | 26d | 1 | 0.75mi |
| 61638 El Reposo Cir Joshua Tree, CA | 3.0 | 1.0 | 1175 | $2,200 | $1.87 | 27d | 1 | 0.75mi |
| 61660 Valley View Dr Joshua Tree, CA | 3.0 | 2.0 | 1153 | $2,350 | $2.04 | 46d | 1 | 0.76mi |
| 6870 Sunset Rd Joshua Tree, CA | 2.0 | 1.0 | 1026 | $2,100 | $2.05 | 27d | 1 | 0.79mi |
| 61602 Capilla Dr Joshua Tree, CA | 2.0 | 2.0 | 1040 | $1,900 | $1.83 | 22d | 1 | 0.80mi |
| 61725 Crest Circle Dr Joshua Tree, CA | 2.0 | 2.0 | 1008 | $2,200 | $2.18 | 7d | 1 | 0.89mi |
| 61721 Oleander Dr Joshua Tree, CA | 3.0 | 2.0 | 1000 | $2,000 | $2.00 | 27d | 1 | 0.89mi |
| 6886 Hillview Rd Joshua Tree, CA | 3.0 | 1.0 | 1200 | $2,000 | $1.67 | 27d | 1 | 0.91mi |
| 61627 El Cajon Dr Joshua Tree, CA | 2.0 | 1.0 | 912 | $1,900 | $2.08 | 7d | 1 | 0.91mi |
| 61493 Desert Air Rd Joshua Tree, CA | 3.0 | 1.0 | 1007 | $2,499 | $2.48 | 46d | 1 | 0.92mi |
| 61495 La Jolla Dr Unit NA Joshua Tree, CA | 3.0 | 1.5 | 1187 | $2,140 | $1.80 | 46d | 1 | 0.93mi |
| 61789 Hilltop Dr Joshua Tree, CA | 3.0 | 1.0 | 1040 | $1,650 | $1.59 | 2d | 1 | 0.94mi |
| 61606 Adobe Dr Joshua Tree, CA | 2.0 | 1.0 | 1000 | $1,900 | $1.90 | 27d | 1 | 1.02mi |
| 61471 El Cajon Dr Joshua Tree, CA | 3.0 | 2.0 | 1056 | $2,350 | $2.23 | 46d | 1 | 1.07mi |
| 61455 Adobe Dr Joshua Tree, CA | 2.0 | 2.0 | 1008 | $2,395 | $2.38 | 46d | 1 | 1.19mi |
Listing history 26 events
-
2026-06-22days on market $80,000 Active 305 DOM
-
2026-06-21days on market $80,000 Active 304 DOM
-
2026-06-18days on market $80,000 Active 301 DOM
-
2026-06-17days on market $80,000 Active 300 DOM
-
2026-06-16days on market $80,000 Active 299 DOM
-
2026-06-15days on market $80,000 Active 298 DOM
-
2026-06-13days on market $80,000 Active 296 DOM
-
2026-06-13days on market $80,000 Active 295 DOM
-
2026-06-09days on market $80,000 Active 292 DOM
-
2026-06-08days on market $80,000 Active 291 DOM
-
2026-06-07days on market $80,000 Active 290 DOM
-
2026-06-04days on market $80,000 Active 287 DOM
-
2026-06-03days on market $80,000 Active 286 DOM
-
2026-06-02days on market $80,000 Active 285 DOM
-
2026-06-01days on market $80,000 Active 284 DOM
-
2026-05-31days on market $80,000 Active 283 DOM
-
2026-02-11price $80,000 902-char remark
Show marketing remark (902 chars)
Welcome to Joshua Mobile Estates. This 2-bedroom, 2-bath manufactured home offers comfort, privacy, and convenience right in the heart of Joshua Tree. Step inside to an open layout with updated bathrooms, new laminate flooring, and a remodeled kitchen with Formica counters, refrigerator, dishwasher, and 6-burner stove included. Central air and heat keep the home comfortable year-round, and the separate laundry room comes with washer and dryer. The property is fully enclosed by a 6 foot privacy fence, giving you a private outdoor space to relax or entertain while enjoying desert and mountain views. Just steps from the community pool and walking distance to downtown Joshua Tree Village, the JT Saloon, shops, and restaurants, with the National Park only minutes away. With affordable space rent and move-in ready updates, this home is a great fit for anyone ready to make Joshua Tree their home.
-
2025-08-21$85,000 Active 902-char remark
Show marketing remark (902 chars)
Welcome to Joshua Mobile Estates. This 2-bedroom, 2-bath manufactured home offers comfort, privacy, and convenience right in the heart of Joshua Tree. Step inside to an open layout with updated bathrooms, new laminate flooring, and a remodeled kitchen with Formica counters, refrigerator, dishwasher, and 6-burner stove included. Central air and heat keep the home comfortable year-round, and the separate laundry room comes with washer and dryer. The property is fully enclosed by a 6 foot privacy fence, giving you a private outdoor space to relax or entertain while enjoying desert and mountain views. Just steps from the community pool and walking distance to downtown Joshua Tree Village, the JT Saloon, shops, and restaurants, with the National Park only minutes away. With affordable space rent and move-in ready updates, this home is a great fit for anyone ready to make Joshua Tree their home.
-
2025-07-04historical
-
2025-01-17$95,000 Active
-
2024-10-28historical
-
2024-03-04$89,900 Active
-
2012-01-21soldstatus $11,557 Closed
-
2011-11-08price $11,557
-
2011-10-13price $11,537
-
2011-08-09$15,000 Active
ⓘ Source: listings_history table (triggers on properties + properties_extension) + one-shot
backfill from property_details.listing_events for pre-trigger history.
Climate risk First Street
- Flood 4/10 Moderate FEMA zone X · 22% chance over 30 yrs
- Wildfire 4/10 Moderate
- Heat 7/10 Severe 7 d/yr ≥99°F today · 21 d/yr by 30 yrs out
- Wind 1/10 Low
- Air quality 6/10 Major 10 unhealthy d/yr today · 14 by 30 yrs out
Nearby sold comps map
Loading sold comps map…
Walkable amenities ~0.75 mi
Loading nearby amenities…
Taxation est. · year 1
- Rental income
- $18,624
- − Mortgage interest
- −$4,481
- − Property taxes
- −$1,200
- − Insurance
- −$400
- − Repairs & maintenance
- −$1,490
- − Management
- −$1,490
- − Depreciation
- −$2,327
- Taxable income
- $7,236
- Est. tax owed @ 24.0%
- −$1,737
- After-tax cash flow
- $6,342/yr
For passive investors: Depreciation is non-cash, so a rental often shows a tax loss while cash-flowing — sheltering income. Rental losses are passive: they offset passive income freely, and up to $25,000/yr can offset ordinary (W-2) income if you actively participate and your MAGI is under $100k (phasing out to $0 by $150k); unused losses carry forward. On sale, claimed depreciation is recaptured at up to 25%, and gains may owe capital-gains tax (a 1031 exchange can defer both). Figures are a year-1 estimate at your 24.0% rate — not tax advice; consult a CPA.
Schools (NCES district)
- District
- Morongo Unified
- NCES district ID
- 0625860
- Math proficiency
- 15% ▼ -12.00%
- Reading proficiency
- 38% ▼ -3.00%
- Median HH income
- $39,399
- Composite
- 22.19/100
- National rank
- #8156
- State rank
- #395 of 517 in CA
Livability — Joshua Tree
- Score
- 50/100
- State rank
- #1114
- US rank
- #25611
Category grades
Schools grade is shown separately in the Schools card above.
Census & demographics
- Census place
- Joshua Tree, CA
- County
- San Bernardino County · 2,030,291 people
- City population
- 7,538
- Metro
- Riverside-San Bernardino-Ontario, CA
- Population (ZIP)
- 7,538
- Household income
- $66,598
- Rent vs Own
- Severe rent burden
- 345.0
Population outlook (San Bernardino County) Hauer SSP2
- Today (2025)
- 2,300,329 people
- By 2030
- 2,378,907 · +3.4%
- By 2040
- 2,523,137 · +9.7%
- By 2050
- 2,642,388 · +14.9%
- By 2075
- 2,880,769 · +25.2%
- By 2100
- 2,909,436 · +26.5%
Race, ethnicity, and origin ACS 2023
- Neighborhood character
- Predominantly White (67%)
- Race & ethnicity
- White 67% Hispanic / Latino 22% Two or more races 16% Black 3% Native American 1% Asian 1%
- Hispanic origin (detail)
- Mexican 17%
- Common ancestry
- Italian 6% Lithuanian 3% Portuguese 3%
- Foreign-born
- 8% · Canada
- Languages at home
- 88% English-only · Spanish 9% Other Indo-European 1% German/W. Germanic 1%
Political lean MEDSL · San Bernardino
- 2024 margin
- Toss-up / Even · D 47.5% · R 49.7% · Other 2.8%
- 2008→2024 swing
- -8.5pp toward R · 2008: 6.3pp · 2024: -2.1pp
- All cycles
- 2024: R+2.1 2020: D+10.7 2016: D+9.8 2012: D+5.4 2008: D+6.3
Not yet ingested
- Civics
- —
Market trends
- HPI YoY
- ▼ -41.66%
- Current HPI
- 541.8347
- Rent YoY
- ▼ -1.09%
- Metro
- Riverside-San Bernardino-Ontario, CA
- State GDP YoY
- ▲ 3.21%
- F500 in state
- 116
Industry mix (Fortune 500 HQ in CA)
| Industry | F500 HQs | Revenue |
|---|---|---|
| Technology | 27 | $1,492B |
|
||
| Financial Services | 3 | $174B |
|
||
| Retail | 3 | $44B |
|
||
| Insurance | 3 | $26B |
|
||
| Media / Entertainment | 2 | $115B |
|
||
| Pharmaceuticals / Biotech | 2 | $62B |
|
||
Price history
+433.3% since first listed10 events — show timeline
- 2026-02-11 Price Changed $80,000 CRMLS
- 2025-08-21 Listed $85,000 CRMLS
- 2025-07-04 Listing Removed — CRMLS
- 2025-01-17 Listed $95,000 CRMLS
- 2024-10-28 Listing Removed — GPSMLS
- 2024-03-04 Listed $89,900 GPSMLS
- 2012-01-21 Sold (MLS) $11,557 CRMLS
- 2011-11-08 Price Changed $11,557 CRMLS
- 2011-10-13 Price Changed $11,537 CRMLS
- 2011-08-09 Listed $15,000 CRMLS
Property tax history
-1.2%/yrLatest (2025): $130 · +2.8% YoY. Source: county tax records.
Cash-flow waterfall
monthlySold comps — $/sqft
last 12 mo · ≤1 miLoading sold comps…