 Duplex
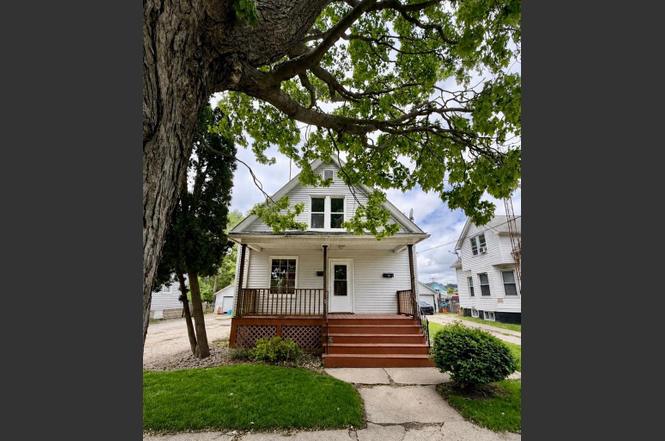
6810 27th Ave · Kenosha, WI
Flood risk 6/10 · Moderate
- FEMA flood zone
- X (unshaded)
- Chance of flooding over 30 yrs
- 0.68%
- Est. flood insurance / yr
- $473 – $860
Fire risk 1/10 · Minimal
- Est. fire insurance / yr
- $636 – $1,182
Heat risk 2/10 · Minimal
- Hot days now (above 96°F)
- 7 days/yr
- Hot days in 30 yrs
- 14 days/yr
Wind risk 2/10 · Minimal
- Chance of severe wind over 30 yrs
- —
Air-quality risk 3/10 · Minor
- Unhealthy air days now
- 2 days/yr
- Unhealthy air days in 30 yrs
- 3 days/yr
Risk factors via First Street. Map © Google.
Why this score? — see what drove the C+ grade
The composite is a weighted blend of 9 inputs, each scored 0–100. Each bar is that input's sub-score; the figure is the points it added to the 100-point composite (weight × sub-score).
- Cash flow +30.0/30.0
- 1% rule +10.0/10.0
- DSCR +10.0/10.0
- Livability +4.2/5.0
- Rent growth +2.5/5.0
- Schools +2.5/10.0
- Condition / age +2.5/5.0
- ARV discount +0.9/15.0
- Appreciation +0.0/10.0
$214,900
🖨 Deal sheet 📄 Offer letter ✓ Due diligence
Multi-family units
County records classify this as Multi-Family (2-4 Unit). Listing-text estimate: 2 units. confirmed
Listing remarks MLS
Foreclosure property being sold in the as is condition. Room sizes have been estimated
Key facts
- Tastefully updated
- Kenosha location
- Freshly painted
Tags
Property features AI
Exterior
- Utilities: Municipal water; Municipal sewer
- Home design: 2-story duplex; Multi-family property; Zoning: RG1
- Construction: Information source lists year built from assessor/public record
- Exterior features: Vinyl exterior; Lot under 1/2 acre
Interior
- Kitchen: Unit 2 kitchen on upper level; Appliances included: 2 stoves, 2 refrigerators, 1 dishwasher
- Bedrooms: Unit 1: 2 bedrooms; Unit 2: 1 bedroom (upper level)
- Bathrooms: Unit 1: 1 full bathroom; Unit 2: 1 full bathroom
- Interior features: Full basement
- Laundry & utility: Two electric meters; Two gas meters
Neighborhood map
What this means for you Summary
Snapshot
- This is a 2 × 3-bed/2.0-bath units multifamily listed at $215k.
Deal economics
- At list price, monthly cash flow is $2k ($20k/yr) — positive. Per door: $851/mo.
- The deal already cash-flows at list — no discount required.
- Meets the 1% rule at list price ($4k rent vs $215k).
- Recommended offer: $212k (1.5% below list) — sets the bar for market timing.
- Cap rate 15.8% vs local median 4.0% in Kenosha — top-decile yield for the area; either an underpriced asset or a hidden risk that comps aren't pricing in. Stress-test before assuming the spread holds.
Location & tenants
- Location reads 84/100 on livability (#31 in WI, #680 nationally) — a professional / high-income tenant draw. Strengths: commute A+, cost of living A+, housing A+; Watch: employment C-.
- Kenosha School District (suburban): math 26% / reading 31% proficiency, ranked #287 of 342 in WI (top 84%) — low school quality limits family demand, transient renter base, plan for 1-2y turnover.
- Zoned schools: Grewenow Elementary (math 22% / reading 17%, grade F, #864 of 1,041 statewide, top 85%, 273 students, 73% FRL); Tremper High (math 13% / reading 25%, grade F, #395 of 483 statewide, top 82%, 1,540 students, 45% FRL).
- Market conditions: 35 active listings in the ZIP; 18 comparable units currently listed for rent nearby; rentals at typical pace (median 19d on market — plan ~3-4 weeks tenant-placement turnaround); 259 units permitted in Kenosha County in 2024 (8 in 5+ unit buildings).
- At $3,897/mo this rent would consume 68% of the median local household income ($68k/yr) (locally 813% of renters already pay >50% of income on rent) — very limited rent-growth headroom before tenants either downsize or default.
Forward outlook
- Local home prices are declining (-3.0%/yr); year-one equity from $1k of loan paydown is wiped out by about $6k of value loss. Plan a longer hold.
- At projected returns (-3.0% appreciation + 3.0% rent growth), your $60k cash investment doubles in ~4 years — after that, you're playing with house money.
Negotiation context
- It's been on market 28 days — a 2% lower offer ($212k) is reasonable based on typical stale-listing flexibility.
- 3 sale attempts since 14y ago with the ask held roughly flat each time — persistent listings suggest the price (not the market) is what's stuck; bring a comps-based counter.
- Current owner paid $29k; list at $215k implies a 641% gain — meaningful room to come down on a strong offer.
Risks & watch-outs
- Watch-outs: built in 1902 — expect roof / HVAC / electrical / plumbing capex.
- Climate carrying-cost: major flood risk — expect insurance premiums to compound above CPI over the hold.
Questions for the listing agent
- Can we see the unit-by-unit rent roll, current vacancy, and any below-market leases? What's the average tenancy length?
- What capital expenditures (roof, boiler, parking lot, exteriors) have been made in the last 5 years, and what's planned in the next 2?
- Built in 1902 — when were the roof, HVAC, electrical panel, plumbing, and water heater last replaced?
- Is there a deadline driving the sale (1031 exchange, divorce, estate, relocation)? That informs how much negotiation room exists.
- Schools are D-rated, which usually means shorter tenancies and higher turnover. Who's the typical renter profile here, and what's been the actual vacancy rate?
- What's the average days-on-market for RENTAL listings here right now (not sales)? A rising rental-DOM trend means longer vacancies and softer asking-rent achievability than the comps imply.
- What's the recent tenant-quality profile in this submarket — average credit score on applications, eviction rate, late-payment / NSF rate, and stable-employment percentage? A property-management company in the area should have these aggregated.
- How much new apartment / multifamily construction is in the pipeline within 1–3 miles? Heavy new supply (>2% of stock underway) typically softens rents 12–24 months out; light construction supports rent growth.
Investment metrics
- 1% rule
- 1.81% ✓
- Cap rate
- 15.80%
- Cash-on-cash
- 33.94%
- DSCR
- 2.51
- GRM
- 4.6
CMA / ARV
- ARV (on-the-fly)
- $187,530
- Comps found
- 9
Show comp detail 9 sales within ~0.75 mi
| Address | Dist | Beds/Ba | Sqft | Sold | Price | $/sf | Match |
|---|---|---|---|---|---|---|---|
| 2428 71st St | 0.22mi | 4/2.0 (+1) | 1,344 (+1%) | 20mo | $190,000 | $141 | 67 |
| 6046 31st Ave | 0.60mi | 3/2.0 | 1,477 (+11%) | 3mo | $212,000 | $144 | 51 |
| 6017 31st Ave | 0.64mi | 2/2.0 (-1) | 1,285 (-3%) | 10mo | $155,000 | $121 | 51 |
| 6218 32nd Ave | 0.56mi | 4/2.0 (+1) | 1,304 (-2%) | 21mo | $205,000 | $157 | 48 |
| 3511 64th St #3513 | 0.61mi | 4/2.0 (+1) | 1,440 (+8%) | 11mo | $187,777 | $130 | 44 |
| 6020 31st Ave | 0.64mi | 4/2.0 (+1) | 1,368 (+3%) | 20mo | $198,000 | $145 | 43 |
| 6617 18th Ave | 0.59mi | 4/2.0 (+1) | 1,408 (+6%) | 20mo | $160,000 | $114 | 41 |
| 6208 37th Ave | 0.75mi | 4/2.0 (+1) | 1,260 (-5%) | 20mo | $140,000 | $111 | 35 |
| 7514 33rd Ave | 0.55mi | 2/2.0 (-1) | 1,498 (+13%) | 22mo | $250,000 | $167 | 30 |
Match score weights: distance 35% · size 25% · config 20% · recency 20%. Top-matched comps best support the ARV.
Projected returns pro-forma
-3.0% appreciation · 3.0% rent growth · sell at horizon
- IRR
- 29.3%
- Equity multiple
- 2.22×
- Total profit
- $73,550
- Equity at exit
- $32,042
- IRR
- 36.6%
- Equity multiple
- 4.38×
- Total profit
- $203,572
- Equity at exit
- $18,581
Cash invested: $60,172 (down + closing). Projections, not guarantees.
Landlord ↔ Tenant lean methodology
- Overall (STATE)
- 73 Landlord-Friendly
- State Wisconsin
- 73 Landlord-Friendly · R+2
- County
- — inherits STATE
- City
- — inherits STATE
ZIP-level market 53143
- Active inventory
- 35
- Price-to-rent
- 9.2×
Monthly cashflow live
- Estimated rent
- $3,897 medium interval (Pro) →
- Mortgage (P&I)
- −$1,127
- Tax from tax record
- −$160 /mo · $1,925/yr
- Insurance
- −$90
- HOA
- −$0
- Vacancy / Maint / Mgmt
- −$818
- Net cashflow
- $1,702
Break-even live
2-unit breakdown (identical units grouped — click to expand)
| Units | Beds | Baths | Est. rent |
|---|---|---|---|
| 2× units | 3 | 2 | $3,896 |
| #1 | 3 | 2 | $1,948 |
| #2 | 3 | 2 | $1,948 |
| Total (2 units) | $3,897 | ||
UW: 25.0% down · 7.5% · 30yr · 1.5% tax · 5.0% vac · 8.0% maint · 8.0% mgmt
Financing live
Cash to close
- Down payment
- $53,725
- Closing costs
- $6,447
- Reserves months
- —
- Total cash needed
- —
Loan-product check · same deal, 3 products live
Conventional
25% down · 7.5% · 30yr
- Down + closing
- —
- Monthly P&I
- —
- Monthly cashflow
- —
- DSCR
- —
- Eligible?
- —
Personal DTI + credit; lowest rate.
DSCR
20% down · 8.5% · 30yr
- Down + closing
- —
- Monthly P&I
- —
- Monthly cashflow
- —
- DSCR
- —
- Eligible?
- —
No personal income docs; deal must DSCR.
Hard money
10% down · 12.0% · 12mo
- Down + closing
- —
- Monthly P&I
- —
- Monthly cashflow
- —
- DSCR
- —
- Eligible?
- —
Short-term bridge; refi at stabilization.
Rent comps 18 comps
| Address | Beds | Baths | Sqft | Rent | $/sqft | DOM | Units | Dist |
|---|---|---|---|---|---|---|---|---|
| 2614 63rd St #2 Kenosha, WI | 2.0 | 1.0 | 900 | $1,295 | $1.44 | 24d | 1 | 0.40mi |
| 1809 60th St Kenosha, WI | 3.0 | 1.0 | 1100 | $1,500 | $1.36 | 43d | 1 | 0.79mi |
| 5807 20th Ave Unit 2 Kenosha, WI | 3.0 | 1.0 | 1064 | $2,400 | $2.26 | 18d | 1 | 0.81mi |
| 5807 20th Ave Unit 1 Kenosha, WI | 2.0 | 1.0 | 1064 | $2,000 | $1.88 | 18d | 1 | 0.81mi |
| 7733 37th Ave Kenosha, WI | 2.0 | 1.0 | 1200 | $2,000 | $1.67 | 12d | 1 | 0.83mi |
| 5432 23rd Ave Kenosha, WI | 4.0 | 2.0 | 1400 | $1,695 | $1.21 | 3d | 1 | 0.94mi |
| 1510 57th St Unit 2 Kenosha, WI | 4.0 | 2.0 | 1700 | $1,800 | $1.06 | 43d | 1 | 1.02mi |
| 5103 24th Ave Kenosha, WI | 2.0 | 1.0 | 980 | $1,095 | $1.12 | 4d | 1 | 1.22mi |
| 6018 8th Ave Apt 33 Kenosha, WI | 2.0 | 1.5 | 975 | $1,425 | $1.46 | 7d | 1 | 1.23mi |
| 5945 6th Ave Kenosha, WI | 2.0 | 1.0–2.0 | 800 | $2,575 | $3.22 | 1d | 13 | 1.41mi |
| 5522 7th Ave Kenosha, WI | 2.0 | 1.0–2.0 | 858 | $2,660 | $3.10 | 2d | 60 | 1.43mi |
| 2708 48th St Kenosha, WI | 4.0 | 2.0 | 1200 | $2,500 | $2.08 | 21d | 1 | 1.45mi |
| 5900 4th Ave Apt 414 Kenosha, WI | 2.0 | 2.0 | 1160 | $2,675 | $2.31 | 12d | 1 | 1.49mi |
| 5900 4th Ave Unit 512 Kenosha, WI | 2.0 | 2.0 | 1224 | $2,495 | $2.04 | 19d | 1 | 1.49mi |
| 5900 4th Ave Unit 217 Kenosha, WI | 2.0 | 2.0 | 1083 | $2,195 | $2.03 | 18d | 1 | 1.49mi |
| 5900 4th Ave Unit 509 Kenosha, WI | 2.0 | 2.0 | 1083 | $2,035 | $1.88 | 24d | 1 | 1.49mi |
| 5900 4th Ave Unit 212 Kenosha, WI | 2.0 | 2.0 | 1224 | $1,999 | $1.63 | 43d | 1 | 1.49mi |
| 5900 4th Ave Unit 309 Kenosha, WI | 2.0 | 2.0 | 1083 | $1,895 | $1.75 | 19d | 1 | 1.49mi |
Listing history 21 events
-
2026-06-18status $214,900 Pending 28 DOM
-
2026-06-18days on market $214,900 Contingent 28 DOM
-
2026-06-17days on market $214,900 Contingent 27 DOM
-
2026-06-16days on market $214,900 Contingent 26 DOM
-
2026-06-15days on market $214,900 Contingent 25 DOM
-
2026-06-13days on market $214,900 Contingent 23 DOM
-
2026-06-09days on market $214,900 Contingent 19 DOM
-
2026-06-08days on market $214,900 Contingent 18 DOM
-
2026-06-07days on market $214,900 Contingent 17 DOM
-
2026-06-04days on market $214,900 Contingent 14 DOM
-
2026-06-03days on market $214,900 Contingent 13 DOM
-
2026-06-02days on market $214,900 Contingent 12 DOM
-
2026-06-01days on market $214,900 Contingent 11 DOM
-
2026-05-31days on market $214,900 Contingent 10 DOM
-
2026-05-20$214,900 Active
-
2013-02-16$35,900 86-char remark
Show marketing remark (86 chars)
Foreclosure property being sold in the as is condition. Room sizes have been estimated
-
2013-02-16historical 86-char remark
Show marketing remark (86 chars)
Foreclosure property being sold in the as is condition. Room sizes have been estimated
-
2012-03-11$55,000 118-char remark
Show marketing remark (118 chars)
APPROVED BANK SHORT SALE! Two unit with vinyl siding. investor cash flow at great price. property being sold ''as-is''
-
2012-03-11historical 118-char remark
Show marketing remark (118 chars)
APPROVED BANK SHORT SALE! Two unit with vinyl siding. investor cash flow at great price. property being sold ''as-is''
-
2010-08-19soldstatus $29,000 86-char remark
Show marketing remark (86 chars)
Foreclosure property being sold in the as is condition. Room sizes have been estimated
-
1998-02-01soldstatus $60,900
ⓘ Source: listings_history table (triggers on properties + properties_extension) + one-shot
backfill from property_details.listing_events for pre-trigger history.
Tax reassessment forecast WI · Partial reset (capped growth)
- Current annual tax
- $1,925 · $160/mo
- Projected year-2 tax
- $2,951 · $246/mo
- Expected delta
- +$1,025/yr (+$85/mo · 53.2%)
ⓘ Screening estimate from a state-policy table — verify with the county assessor before closing.
Climate risk First Street
- Flood 6/10 Major FEMA zone X (unshaded) · 68% chance over 30 yrs
- Wildfire 1/10 Low
- Heat 2/10 Low 7 d/yr ≥96°F today · 14 d/yr by 30 yrs out
- Wind 2/10 Low
- Air quality 3/10 Moderate 2 unhealthy d/yr today · 3 by 30 yrs out
Nearby sold comps map
Loading sold comps map…
Walkable amenities ~0.75 mi
Loading nearby amenities…
Taxation est. · year 1
- Rental income
- $46,764
- − Mortgage interest
- −$12,038
- − Property taxes
- −$1,925
- − Insurance
- −$1,074
- − Repairs & maintenance
- −$3,741
- − Management
- −$3,741
- − Depreciation
- −$6,252
- Taxable income
- $17,992
- Est. tax owed @ 24.0%
- −$4,318
- After-tax cash flow
- $16,102/yr
For passive investors: Depreciation is non-cash, so a rental often shows a tax loss while cash-flowing — sheltering income. Rental losses are passive: they offset passive income freely, and up to $25,000/yr can offset ordinary (W-2) income if you actively participate and your MAGI is under $100k (phasing out to $0 by $150k); unused losses carry forward. On sale, claimed depreciation is recaptured at up to 25%, and gains may owe capital-gains tax (a 1031 exchange can defer both). Figures are a year-1 estimate at your 24.0% rate — not tax advice; consult a CPA.
Schools (NCES district)
- District
- Kenosha School District
- NCES district ID
- 5507320
- Math proficiency
- 26% ▼ -9.00%
- Reading proficiency
- 31% ▼ -6.00%
- Median HH income
- $52,407
- Composite
- 25.17/100
- National rank
- #7516
- State rank
- #287 of 342 in WI
Livability — Kenosha
- Score
- 84/100
- State rank
- #31
- US rank
- #680
Category grades
Schools grade is shown separately in the Schools card above.
Census & demographics
- Census place
- Kenosha, WI
- County
- Kenosha County · 130,343 people
- City population
- 85,271
- Metro
- Chicago-Naperville-Elgin, IL-IN-WI
- Population (ZIP)
- 20,889
- Household income
- $68,343
- Rent vs Own
- Severe rent burden
- 813.0
Population outlook (Kenosha County) Hauer SSP2
- Today (2025)
- 174,032 people
- By 2030
- 174,923 · +0.5%
- By 2040
- 173,895 · -0.1%
- By 2050
- 170,102 · -2.3%
- By 2075
- 162,952 · -6.4%
- By 2100
- 154,781 · -11.1%
Race, ethnicity, and origin ACS 2023
- Neighborhood character
- Diverse neighborhood (Simpson 0.59)
- Race & ethnicity
- White 59% Hispanic / Latino 21% Two or more races 18% Black 11% Asian 1%
- Hispanic origin (detail)
- Mexican 16% Puerto Rican 2%
- Common ancestry
- Romanian 6% Portuguese 5% Lithuanian 2%
- Foreign-born
- 6% · Canada, China
- Languages at home
- 89% English-only · Spanish 10% Chinese 1%
Political lean MEDSL · Kenosha
- 2024 margin
- Lean R (+6.2) · D 46.2% · R 52.5% · Other 1.3%
- 2008→2024 swing
- -24.3pp toward R · 2008: 18.1pp · 2024: -6.2pp
- All cycles
- 2024: R+6.2 2020: R+3.1 2016: R+0.3 2012: D+12.3 2008: D+18.1
Not yet ingested
- Civics
- —
Market trends
- HPI YoY
- ▼ -220.75%
- Current HPI
- 229.2067
- Rent YoY
- —
- Metro
- Chicago-Naperville-Elgin, IL-IN-WI
- State GDP YoY
- ▲ 2.10%
- F500 in state
- 20
Industry mix (Fortune 500 HQ in WI)
| Industry | F500 HQs | Revenue |
|---|---|---|
| Industrial Machinery | 4 | $23B |
|
||
| Industrial Technology | 2 | $36B |
|
||
| Insurance | 1 | $36B |
|
||
| Professional Services | 1 | $19B |
|
||
| Utilities | 1 | $9B |
|
||
| Consumer Goods | 1 | $3B |
|
||
Price history
+252.9% since first listed7 events — show timeline
- 2026-05-20 Listed $214,900 METROMLS
- 2013-02-16 Listing Removed — METROMLS
- 2013-02-16 Listed $35,900 METROMLS
- 2012-03-11 Listing Removed — METROMLS
- 2012-03-11 Listed $55,000 METROMLS
- 2010-08-19 Sold (MLS) $29,000 METROMLS
- 1998-02-01 Sold (Public Records) $60,900 Public Records
Property tax history
+1.7%/yrLatest (2025): $1,925 · +5.6% YoY. Source: county tax records.
Cash-flow waterfall
monthlySold comps — $/sqft
last 12 mo · ≤1 miLoading sold comps…