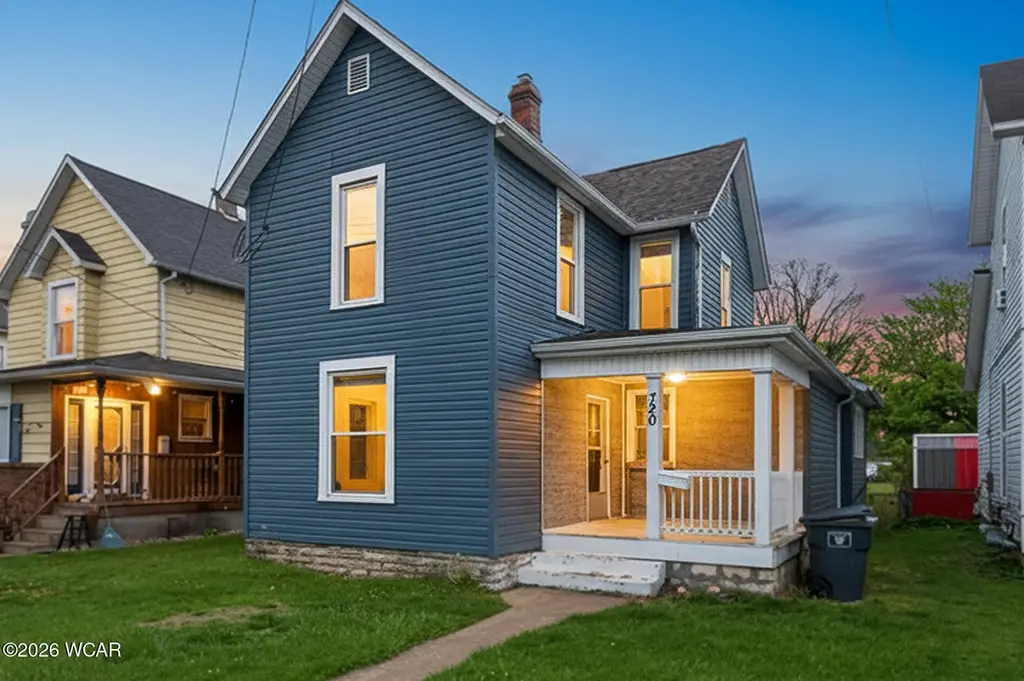
720 N West St · Lima, OH
Flood risk 1/10 · Minimal
- FEMA flood zone
- X (unshaded)
- Chance of flooding over 30 yrs
- 0.0%
- Est. flood insurance / yr
- $473 – $860
Fire risk 1/10 · Minimal
- Est. fire insurance / yr
- $713 – $1,323
Heat risk 3/10 · Minor
- Hot days now (above 100°F)
- 7 days/yr
- Hot days in 30 yrs
- 18 days/yr
Wind risk 2/10 · Minimal
- Chance of severe wind over 30 yrs
- —
Air-quality risk 2/10 · Minimal
- Unhealthy air days now
- 1 days/yr
- Unhealthy air days in 30 yrs
- 2 days/yr
Risk factors via First Street. Map © Google.
Why this score? — see what drove the C+ grade
The composite is a weighted blend of 9 inputs, each scored 0–100. Each bar is that input's sub-score; the figure is the points it added to the 100-point composite (weight × sub-score).
- Cash flow +30.0/30.0
- 1% rule +10.0/10.0
- DSCR +10.0/10.0
- Livability +3.2/5.0
- ARV discount +2.6/15.0
- Schools +2.6/10.0
- Rent growth +2.5/5.0
- Condition / age +2.5/5.0
- Appreciation +0.0/10.0
$99,000
🖨 Deal sheet (PDF) 📄 Offer letter ✓ Due diligence
Listing remarks MLS
3 Bedroom/2 Bath North-end home with both full baths newly updated. Features a large updated Eat-in-Kitchen. Original hardwood floors throughout. First floor Laundry Room. New roof 2021, updated mechanicals, replacement windows and Vinyl Siding. Move-in ready for the First-time home buyer or Investor looking for an updated property.
Key facts
- Off-street parking
- Backyard space
- Built 1920
Tags
Property features AI
Finance
- Other: Listed by Howard Hanna - Sidney
Exterior
- Parking: Other parking
- Utilities: Public water; Public sewer
- Home design: Single-family residence; Residential property
- Construction: Vinyl siding; Other foundation
- Exterior features: Residential zoning
Interior
- Kitchen: Range; Refrigerator
- Bedrooms: Total rooms: 8
- Flooring: Hardwood
- Bathrooms: 2 full bathrooms
- Heating & cooling: Forced air heating; Natural gas heating; No cooling
- Interior features: Range; Refrigerator; Water heater; Hardwood flooring; Full unfinished concrete basement
- Laundry & utility: Water heater
Neighborhood map
What this means for you Summary
Snapshot
- This is a 3-bed/2.0-bath single-family listed at $99k.
Deal economics
- At list price, monthly cash flow is $541 ($6k/yr) — positive.
- The deal already cash-flows at list — no discount required.
- Meets the 1% rule at list price ($2k rent vs $99k).
- Recommended offer: $96k (3.0% below list) — sets the bar for market timing.
- Cap rate 12.9% vs local median 7.4% in Lima — top-decile yield for the area; either an underpriced asset or a hidden risk that comps aren't pricing in. Stress-test before assuming the spread holds.
Location & tenants
- Location reads 64/100 on livability (#787 in OH) — a middle-class / working-renter tenant base. Strengths: cost of living A+, housing A+, health & safety A-; Watch: crime F, amenities F, commute F.
- Lima City (urban): math 29% / reading 36% proficiency, ranked #575 of 656 in OH (top 88%) — families likely to look elsewhere, expect single-tenant / working-renter base with shorter leases; 83% free/reduced lunch — lower-income household profile, screen leases tightly.
- Zoned schools: Liberty Arts Magnet K-8 (math 40% / reading 46%, grade F, #1,023 of 1,584 statewide, top 65%, 416 students, 0% FRL); Lima West Middle School (math 22% / reading 24%, grade F, #600 of 654 statewide, top 92%, 352 students, 0% FRL); Lima Senior High School (math 16% / reading 42%, grade F, #627 of 781 statewide, top 81%, 1,013 students, 0% FRL) — zoned schools average 0% FRL vs 83% district-wide (83 pts lower); this property's tenant base skews higher-income than the district average.
- Market conditions: 74 active listings in the ZIP; 8 comparable units currently listed for rent nearby; rentals lingering (median 46d on market — plan ~5-8 weeks vacancy on turnover, expect pricing pressure); 100% of comp listings sitting > 30 days — soft ceiling on asking rent; 88 units permitted in Allen County in 2024 (0 in 5+ unit buildings).
- This rent runs 35% of the median local income ($52k/yr) — at the standard rent-burdened threshold; future hikes will face affordability resistance.
Forward outlook
- Local home prices are declining (-3.0%/yr); year-one equity from $684 of loan paydown is wiped out by about $3k of value loss. Plan a longer hold.
- Allen County population projected at -14% by 2050 — secular population decline; favor cash flow + early exit over multi-decade hold.
- At projected returns (-3.0% appreciation + 3.0% rent growth), your $28k cash investment doubles in ~6 years — after that, you're playing with house money.
Negotiation context
- It's been on market 36 days — a 3% lower offer ($96k) is reasonable based on typical stale-listing flexibility.
- 7 sale attempts since 11y ago; this cycle's ask has dropped $16k (14%) from the opening price — seller is motivated, your offer sets the floor, not the list.
Risks & watch-outs
- Watch-outs: built in 1920 — expect roof / HVAC / electrical / plumbing capex.
Questions for the listing agent
- It's been on market 36 days. Have you received any prior offers? Is the seller open to a 3% concession, seller financing, or rate buy-down credit?
- Built in 1920 — when were the roof, HVAC, electrical panel, plumbing, and water heater last replaced?
- Is there a deadline driving the sale (1031 exchange, divorce, estate, relocation)? That informs how much negotiation room exists.
- Crime grade is F in this area — have there been break-ins, vandalism, or insurance claims at this property in the last 3 years? What carrier currently insures it and at what premium?
- What's the average days-on-market for RENTAL listings here right now (not sales)? A rising rental-DOM trend means longer vacancies and softer asking-rent achievability than the comps imply.
- What's the recent tenant-quality profile in this submarket — average credit score on applications, eviction rate, late-payment / NSF rate, and stable-employment percentage? A property-management company in the area should have these aggregated.
- How much new for-sale + rental construction is in the pipeline within 1–3 miles? Heavy new supply typically softens prices + rents 12–24 months out; constrained supply supports both.
Investment metrics
- 1% rule
- 1.52% ✓
- Cap rate
- 12.85%
- Cash-on-cash
- 23.42%
- DSCR
- 2.04
- GRM
- 5.5
CMA / ARV
- ARV (median comp)
- $89,299
- List price
- $99,000
- Delta
- 10.86%
- Verdict
- OVERPRICED
- Comps
- 20 within 1.0 mi
Show comp detail 12 sales within ~0.75 mi
| Address | Dist | Beds/Ba | Sqft | Sold | Price | $/sf | Match |
|---|---|---|---|---|---|---|---|
| 720 N West St | 0.00mi | 3/2.0 | 1,496 (0%) | 0mo | $90,000 | $60 | 100 |
| 416 Hazel Ave | 0.21mi | 3/2.0 | 1,494 (-0%) | 2mo | $158,000 | $106 | 89 |
| 222 W Grand Ave | 0.04mi | 2/1.0 (-1) | 1,440 (-4%) | 7mo | $45,000 | $31 | 77 |
| 635 W Ashton Ave | 0.44mi | 3/2.0 | 1,485 (-1%) | 2mo | $188,000 | $127 | 76 |
| 606 N West St | 0.24mi | 3/1.0 | 1,391 (-7%) | 5mo | $82,400 | $59 | 69 |
| 735 N Main St | 0.24mi | 3/1.0 | 1,638 (+10%) | 6mo | $161,000 | $98 | 64 |
| 1200 N Main St | 0.56mi | 3/2.0 | 1,352 (-10%) | 0mo | $114,900 | $85 | 57 |
| 765 W O'connor Ave | 0.63mi | 3/2.0 | 1,401 (-6%) | 7mo | $160,000 | $114 | 54 |
| 439 E Mckibben St | 0.70mi | 4/2.0 (+1) | 1,520 (+2%) | 7mo | $143,500 | $94 | 54 |
| 622 N Jefferson St | 0.59mi | 3/2.0 | 1,292 (-14%) | 4mo | $115,000 | $89 | 46 |
| 676 Cortlandt Ave | 0.61mi | 2/2.0 (-1) | 1,321 (-12%) | 6mo | $142,000 | $107 | 42 |
| 824 Rice Ave | 0.70mi | 4/2.0 (+1) | 1,667 (+11%) | 4mo | $28,000 | $17 | 40 |
Match score weights: distance 35% · size 25% · config 20% · recency 20%. Top-matched comps best support the ARV.
Projected returns pro-forma
-3.0% appreciation · 3.0% rent growth · sell at horizon
- IRR
- 16.5%
- Equity multiple
- 1.66×
- Total profit
- $18,419
- Equity at exit
- $14,761
- IRR
- 25.1%
- Equity multiple
- 3.18×
- Total profit
- $60,413
- Equity at exit
- $8,560
Cash invested: $27,720 (down + closing). Projections, not guarantees.
Landlord ↔ Tenant lean methodology
- Overall (STATE)
- 73 Landlord-Friendly
- State Ohio
- 73 Landlord-Friendly · R+6
- County
- — inherits STATE
- City
- — inherits STATE
ZIP-level market 45801
- Active inventory
- 74
- Price-to-rent
- 5.5×
Monthly cashflow live
- Estimated rent
- $1,503 high interval (Pro) →
- Mortgage (P&I)
- −$519
- Tax from tax record
- −$86 /mo · $1,033/yr
- Insurance
- −$41
- HOA
- −$0
- Vacancy / Maint / Mgmt
- −$316
- Net cashflow
- $541
Break-even live
Sensitivity live
| Price | -10% $597 | -5% $569 | +0% $541 | +5% $513 | +10% $485 |
|---|---|---|---|---|---|
| Rent | -10% $422 | -5% $482 | +0% $541 | +5% $600 | +10% $660 |
| Rate | -1.0pp $591 | -0.5pp $566 | base $541 | +0.5pp $515 | +1.0pp $489 |
UW: 25.0% down · 7.5% · 30yr · 1.5% tax · 5.0% vac · 8.0% maint · 8.0% mgmt
Financing live
Cash to close
- Down payment
- $24,750
- Closing costs
- $2,970
- Reserves months
- —
- Total cash needed
- —
Loan-product check · same deal, 3 products live
Conventional
25% down · 7.5% · 30yr
- Down + closing
- —
- Monthly P&I
- —
- Monthly cashflow
- —
- DSCR
- —
- Eligible?
- —
Personal DTI + credit; lowest rate.
DSCR
20% down · 8.5% · 30yr
- Down + closing
- —
- Monthly P&I
- —
- Monthly cashflow
- —
- DSCR
- —
- Eligible?
- —
No personal income docs; deal must DSCR.
Hard money
10% down · 12.0% · 12mo
- Down + closing
- —
- Monthly P&I
- —
- Monthly cashflow
- —
- DSCR
- —
- Eligible?
- —
Short-term bridge; refi at stabilization.
Rent comps 8 comps
| Address | Beds | Baths | Sqft | Rent | $/sqft | DOM | Units | Dist |
|---|---|---|---|---|---|---|---|---|
| 330 W Ashton Ave Lima, OH | 3.0 | 1.0 | 1288 | $2,000 | $1.55 | 46d | 1 | 0.27mi |
| 420 N Baxter St Lima, OH | 3.0 | 2.0 | 1386 | $1,200 | $0.87 | 46d | 1 | 0.68mi |
| 43 Town Sq Lima, OH | 2.0–3.0 | 1.0–2.0 | 1100 | $1,413 | $1.28 | 46d | 9 | 0.82mi |
| 545 W Market St Unit 340 1/2 Mcpheron Lima, OH | 2.0 | 1.0 | 900 | $800 | $0.89 | 46d | 1 | 0.88mi |
| 228 Nye St Lima, OH | 4.0 | 2.0 | 1686 | $675 | $0.40 | 46d | 1 | 1.05mi |
| 138 Harrison Ave Lima, OH | 3.0 | 1.0 | 1152 | $975 | $0.85 | 46d | 1 | 1.19mi |
| 405 N Kenilworth Ave Lima, OH | 3.0 | 1.0 | 1352 | $1,795 | $1.33 | 46d | 1 | 1.26mi |
| 1436 W High St Lima, OH | 2.0 | 1.0 | 1205 | $895 | $0.74 | 46d | 1 | 1.47mi |
Listing history 17 events
-
2026-05-13price $99,000 949-char remark
-
2026-04-20$115,000 Active 949-char remark
-
2025-10-14price $71,500 334-char remark
Show marketing remark (334 chars)
3 Bedroom/2 Bath North-end home with both full baths newly updated. Features a large updated Eat-in-Kitchen. Original hardwood floors throughout. First floor Laundry Room. New roof 2021, updated mechanicals, replacement windows and Vinyl Siding. Move-in ready for the First-time home buyer or Investor looking for an updated property.
-
2022-02-11soldstatus $71,500
-
2022-02-07soldstatus $71,500 Closed 334-char remark
Show marketing remark (334 chars)
3 Bedroom/2 Bath North-end home with both full baths newly updated. Features a large updated Eat-in-Kitchen. Original hardwood floors throughout. First floor Laundry Room. New roof 2021, updated mechanicals, replacement windows and Vinyl Siding. Move-in ready for the First-time home buyer or Investor looking for an updated property.
-
2022-02-07soldstatus $71,500
Show marketing remark (334 chars)
3 Bedroom/2 Bath North-end home with both full baths newly updated. Features a large updated Eat-in-Kitchen. Original hardwood floors throughout. First floor Laundry Room. New roof 2021, updated mechanicals, replacement windows and Vinyl Siding. Move-in ready for the First-time home buyer or Investor looking for an updated property.
-
2022-01-14status Pending 334-char remark
Show marketing remark (334 chars)
3 Bedroom/2 Bath North-end home with both full baths newly updated. Features a large updated Eat-in-Kitchen. Original hardwood floors throughout. First floor Laundry Room. New roof 2021, updated mechanicals, replacement windows and Vinyl Siding. Move-in ready for the First-time home buyer or Investor looking for an updated property.
-
2022-01-03historical Contingent 334-char remark
Show marketing remark (334 chars)
3 Bedroom/2 Bath North-end home with both full baths newly updated. Features a large updated Eat-in-Kitchen. Original hardwood floors throughout. First floor Laundry Room. New roof 2021, updated mechanicals, replacement windows and Vinyl Siding. Move-in ready for the First-time home buyer or Investor looking for an updated property.
-
2021-11-27$76,500 Active 334-char remark
Show marketing remark (334 chars)
3 Bedroom/2 Bath North-end home with both full baths newly updated. Features a large updated Eat-in-Kitchen. Original hardwood floors throughout. First floor Laundry Room. New roof 2021, updated mechanicals, replacement windows and Vinyl Siding. Move-in ready for the First-time home buyer or Investor looking for an updated property.
-
2021-11-22historical $76,500 334-char remark
Show marketing remark (334 chars)
3 Bedroom/2 Bath North-end home with both full baths newly updated. Features a large updated Eat-in-Kitchen. Original hardwood floors throughout. First floor Laundry Room. New roof 2021, updated mechanicals, replacement windows and Vinyl Siding. Move-in ready for the First-time home buyer or Investor looking for an updated property.
-
2021-11-22$76,500
Show marketing remark (334 chars)
3 Bedroom/2 Bath North-end home with both full baths newly updated. Features a large updated Eat-in-Kitchen. Original hardwood floors throughout. First floor Laundry Room. New roof 2021, updated mechanicals, replacement windows and Vinyl Siding. Move-in ready for the First-time home buyer or Investor looking for an updated property.
-
2021-07-06soldstatus $116,000
-
2021-03-31$99,900
-
2018-07-12soldstatus $21,500
-
2017-11-17$26,000
-
2015-11-23$42,100
-
2015-01-17$29,995
ⓘ Source: listings_history table (triggers on properties + properties_extension) + one-shot
backfill from property_details.listing_events for pre-trigger history.
Tax reassessment forecast OH · Partial reset (capped growth)
- Current annual tax
- $1,033 · $86/mo
- Projected year-2 tax
- $1,289 · $107/mo
- Expected delta
- +$256/yr (+$21/mo · 24.7%)
ⓘ Screening estimate from a state-policy table — verify with the county assessor before closing.
Climate risk First Street
- Flood 1/10 Low FEMA zone X (unshaded) · 0% chance over 30 yrs
- Wildfire 1/10 Low
- Heat 3/10 Moderate 7 d/yr ≥100°F today · 18 d/yr by 30 yrs out
- Wind 2/10 Low
- Air quality 2/10 Low 1 unhealthy d/yr today · 2 by 30 yrs out
Nearby sold comps map
Loading sold comps map…
Walkable amenities ~0.75 mi
Loading nearby amenities…
Taxation est. · year 1
- Rental income
- $18,040
- − Mortgage interest
- −$5,546
- − Property taxes
- −$1,033
- − Insurance
- −$495
- − Repairs & maintenance
- −$1,443
- − Management
- −$1,443
- − Depreciation
- −$2,880
- Taxable income
- $5,199
- Est. tax owed @ 24.0%
- −$1,248
- After-tax cash flow
- $5,245/yr
For passive investors: Depreciation is non-cash, so a rental often shows a tax loss while cash-flowing — sheltering income. Rental losses are passive: they offset passive income freely, and up to $25,000/yr can offset ordinary (W-2) income if you actively participate and your MAGI is under $100k (phasing out to $0 by $150k); unused losses carry forward. On sale, claimed depreciation is recaptured at up to 25%, and gains may owe capital-gains tax (a 1031 exchange can defer both). Figures are a year-1 estimate at your 24.0% rate — not tax advice; consult a CPA.
Schools (NCES district)
- District
- Lima City
- NCES district ID
- 3904422
- Math proficiency
- 29% ▼ -13.00%
- Reading proficiency
- 36% ▼ -6.00%
- Median HH income
- $29,685
- Composite
- 26.31/100
- National rank
- #7243
- State rank
- #575 of 656 in OH
Livability — Lima
- Score
- 64/100
- State rank
- #787
- US rank
- #14288
Category grades
Schools grade is shown separately in the Schools card above.
Census & demographics
- Census place
- Lima, OH
- County
- Allen County · 21,739 people
- City population
- 21,739
- Metro
- Lima, OH
- Population (ZIP)
- 21,739
- Household income
- $51,731
- Rent vs Own
- Severe rent burden
- 1141.0
Population outlook (Allen County) Hauer SSP2
- Today (2025)
- 100,321 people
- By 2030
- 97,693 · -2.6%
- By 2040
- 91,802 · -8.5%
- By 2050
- 86,152 · -14.1%
- By 2075
- 73,659 · -26.6%
- By 2100
- 58,716 · -41.5%
Race, ethnicity, and origin ACS 2023
- Neighborhood character
- Predominantly White (71%)
- Race & ethnicity
- White 71% Black 14% Two or more races 8% Hispanic / Latino 6% Asian 1%
- Hispanic origin (detail)
- Mexican 5%
- Common ancestry
- Lithuanian 2% Italian 1% Iranian 1%
- Foreign-born
- 2% · Canada, China
- Languages at home
- 96% English-only · Spanish 2%
Political lean MEDSL · Allen
- 2024 margin
- Solid R (+44.1) · D 27.5% · R 71.6%
- 2008→2024 swing
- -23.4pp toward R · 2008: -20.7pp · 2024: -44.1pp
- All cycles
- 2024: R+44.1 2020: R+39.5 2016: R+38.2 2012: R+25.7 2008: R+20.7
Not yet ingested
- Civics
- —
Market trends
- HPI YoY
- ▼ -164.79%
- Current HPI
- 219.5329
- Rent YoY
- —
- Metro
- Lima, OH
- State GDP YoY
- ▲ 1.98%
- F500 in state
- 48
Industry mix (Fortune 500 HQ in OH)
| Industry | F500 HQs | Revenue |
|---|---|---|
| Insurance | 3 | $145B |
|
||
| Industrial Machinery | 3 | $49B |
|
||
| Financial Services | 3 | $24B |
|
||
| Consumer Goods | 2 | $93B |
|
||
| Aerospace / Defense | 2 | $47B |
|
||
| Utilities | 2 | $33B |
|
||
Price history
+200.1% since first listed19 events — show timeline
- 2026-06-10 Sold (MLS) $90,000 WCARE
- 2026-05-27 Pending — WCARE
- 2026-05-13 Price Changed $99,000 WCARE
- 2026-04-20 Listed $115,000 WCARE
- 2025-10-14 Price Changed $71,500 NORIS
- 2022-02-11 Sold (Public Records) $71,500 Public Records
- 2022-02-07 Sold (MLS) $71,500 WCARE
- 2022-02-07 Sold (MLS) $71,500 NORIS
- 2022-01-14 Pending — NORIS
- 2022-01-03 Contingent — NORIS
- 2021-11-27 Listed $76,500 NORIS
- 2021-11-22 Coming Soon $76,500 NORIS
- 2021-11-22 Listed $76,500 WCARE
- 2021-07-06 Sold (MLS) $116,000 WCARE
- 2021-03-31 Listed $99,900 WCARE
- 2018-07-12 Sold (MLS) $21,500 WCARE
- 2017-11-17 Listed $26,000 WCARE
- 2015-11-23 Listed $42,100 WCARE
- 2015-01-17 Listed $29,995 WCARE
Property tax history
+12.6%/yrLatest (2025): $1,033 · +0.3% YoY. Source: county tax records.
Cash-flow waterfall
monthlySold comps — $/sqft
last 12 mo · ≤1 miLoading sold comps…