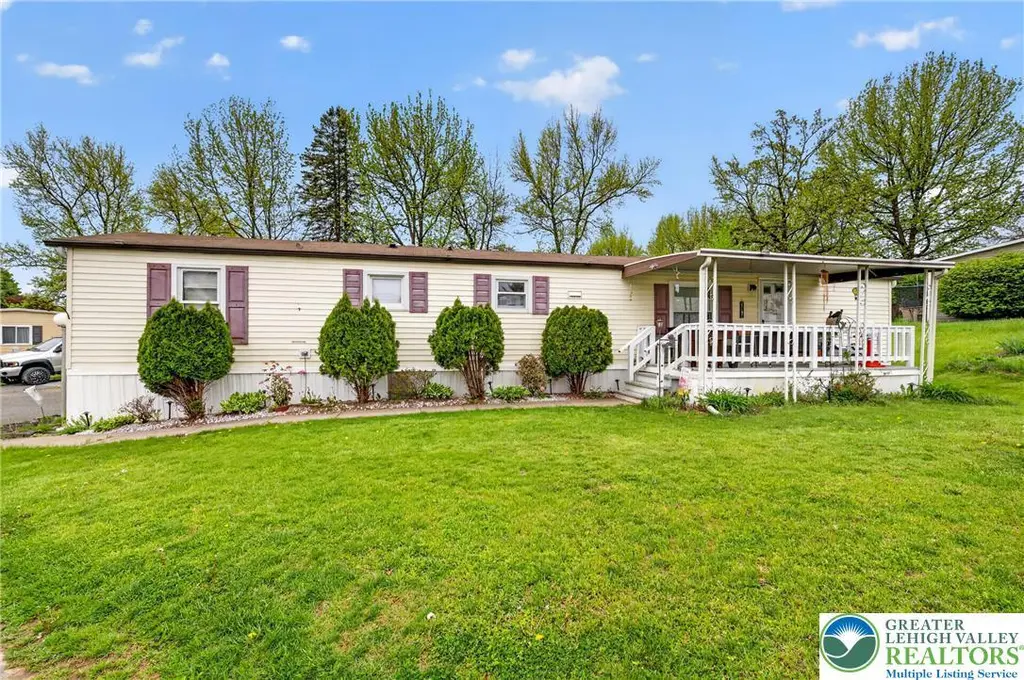
8766 Turkey Ridge Rd · Upper Macungie, PA
Flood risk 8/10 · Major
- FEMA flood zone
- X (unshaded)
- Chance of flooding over 30 yrs
- 0.99%
- Est. flood insurance / yr
- $507 – $1,088
Fire risk 1/10 · Minimal
- Est. fire insurance / yr
- $511 – $949
Heat risk 4/10 · Minor
- Hot days now (above 100°F)
- 7 days/yr
- Hot days in 30 yrs
- 15 days/yr
Wind risk 4/10 · Minor
- Chance of severe wind over 30 yrs
- 17.0%
Air-quality risk 3/10 · Minor
- Unhealthy air days now
- 2 days/yr
- Unhealthy air days in 30 yrs
- 3 days/yr
Risk factors via First Street. Map © Google.
Why this score? — see what drove the B grade
The composite is a weighted blend of 9 inputs, each scored 0–100. Each bar is that input's sub-score; the figure is the points it added to the 100-point composite (weight × sub-score).
- Cash flow +23.3/30.0
- ARV discount +15.0/15.0
- 1% rule +10.0/10.0
- DSCR +7.5/10.0
- Schools +5.7/10.0
- Appreciation +4.6/10.0
- Rent growth +3.0/5.0
- Livability +2.5/5.0
- Condition / age +2.5/5.0
$47,000
🖨 Deal sheet 📄 Offer letter ✓ Due diligence
Listing remarks
This 2 bedroom, 2 full bathroom manufactured home in Green Acres (Parkland school district) is anxiously awaiting its new owner. Built in 1992, this home features an open concept family room, kitchen combination with LVP and laminate flooring throughout most of the home. Cathedral ceilings give the home an open, airy feel. The home features a split bedroom floor plan with the primary bedroom and bathroom on one end of the home and the other bedroom and full bathroom on the other end of the home, allowing for some privacy. The kitchen features modern appliances, ample cabinet space and an eat-in area for meals. Forced air oil heat and window units for AC in the summer (there is a central AC
Key facts
- Covered decks
- Modern appliances
- 2 car driveway
Tags
Property features AI
Finance
- HOA & community: Monthly association fee of $1,134
Exterior
- Parking: Driveway
- Utilities: Circuit breaker electric panel; Community/Cooperative water; Community/Cooperative sewer
- Home design: Single-story; Vinyl siding
- Construction: Built with vinyl siding; Asphalt/fiberglass roof
- Exterior features: Mobile home; Estimated 1,500 sq ft lot
Interior
- Kitchen: Dishwasher; Electric oven; Electric range; Refrigerator
- Bathrooms: 2 full bathrooms
- Heating & cooling: Forced air heating; Oil heating; Wall/Window cooling units
- Interior features: Eat-in kitchen
- Laundry & utility: Washer; Dryer; Electric water heater
Neighborhood map
What this means for you Summary
Snapshot
- This is a 2-bed/2.0-bath land listed at $47k.
Deal economics
- At list price, monthly cash flow is $20 ($239/yr) — positive.
- The deal already cash-flows at list — no discount required.
- Meets the 1% rule at list price ($2k rent vs $47k).
- Recommended offer: $46k (3.0% below list) — sets the bar for market timing.
Location & tenants
- Location reads: area grade B — affects rentability + tenant quality, not the cash-flow math above.
- Parkland SD (suburban): math 59% / reading 70% proficiency, ranked #40 of 539 in PA (top 7%) — acceptable for families but not a draw, mixed tenant base, ~2y average lease; only 15% free/reduced lunch — higher-income household profile.
- Market conditions: Rents rising (+1.9%/yr); 123 active listings in the ZIP; 6 comparable units currently listed for rent nearby; rentals at typical pace (median 14d on market — plan ~3-4 weeks tenant-placement turnaround); high-income renter base; 765 units permitted in Lehigh County in 2024 (286 in 5+ unit buildings).
Forward outlook
- Local home prices are declining (-0.7%/yr); year-one equity from $325 of loan paydown is wiped out by about $337 of value loss. Plan a longer hold.
- Lehigh County population projected at +21% by 2050 — long-run rental-demand tailwind backs the buy-and-hold thesis.
Negotiation context
- It's been on market 50 days — a 3% lower offer ($46k) is reasonable based on typical stale-listing flexibility.
Risks & watch-outs
- Watch-outs: flood insurance adds $66/mo; HOA is 59% of rent.
- Climate carrying-cost: severe flood risk — expect insurance premiums to compound above CPI over the hold.
Questions for the listing agent
- It's been on market 50 days. Have you received any prior offers? Is the seller open to a 3% concession, seller financing, or rate buy-down credit?
- What's the actual annual flood-insurance premium (NFIP or private), and is the property in a SFHA with mandatory coverage?
- What does the HOA fee cover, when was the last increase, and are there any pending special assessments or reserve-fund shortfalls?
- Is there a deadline driving the sale (1031 exchange, divorce, estate, relocation)? That informs how much negotiation room exists.
- What's the average days-on-market for RENTAL listings here right now (not sales)? A rising rental-DOM trend means longer vacancies and softer asking-rent achievability than the comps imply.
- What's the recent tenant-quality profile in this submarket — average credit score on applications, eviction rate, late-payment / NSF rate, and stable-employment percentage? A property-management company in the area should have these aggregated.
- How much new for-sale + rental construction is in the pipeline within 1–3 miles? Heavy new supply typically softens prices + rents 12–24 months out; constrained supply supports both.
Investment metrics
- 1% rule
- 4.09% ✓
- Cap rate
- 8.50%
- Cash-on-cash
- 7.87%
- DSCR
- 1.35
- GRM
- 2.0
CMA / ARV
- ARV (median comp)
- $63,606
- List price
- $47,000
- Delta
- -26.11%
- Verdict
- UNDERPRICED
- Comps
- 9 within 1.0 mi
Projected returns pro-forma
-0.72% appreciation · 1.92% rent growth · sell at horizon
- IRR
- -5.2%
- Equity multiple
- 0.77×
- Total profit
- $-2,988
- Equity at exit
- $11,984
- IRR
- -1.5%
- Equity multiple
- 0.87×
- Total profit
- $-1,766
- Equity at exit
- $13,138
Cash invested: $13,160 (down + closing). Projections, not guarantees.
Landlord ↔ Tenant lean methodology
- Overall (STATE)
- 62 Landlord-Friendly
- State Pennsylvania
- 62 Landlord-Friendly · EVEN
- County
- — inherits STATE
- City
- — inherits STATE
ZIP-level market 18031
- Home prices YoY
- -0.3%
- Rents YoY
- 1.9%
- Active inventory
- 123
- Price-to-rent
- 2.0×
Monthly cashflow live
- Estimated rent
- $1,923 high interval (Pro) →
- Mortgage (P&I)
- −$246
- Tax from tax record
- −$33 /mo · $395/yr
- Insurance
- −$20
- Flood insurance flood zone
- −$66 /mo · $798/yr
- HOA
- −$1,134
- Vacancy / Maint / Mgmt
- −$404
- Net cashflow
- $20
Break-even live
UW: 25.0% down · 7.5% · 30yr · 1.5% tax · 5.0% vac · 8.0% maint · 8.0% mgmt
Financing live
Cash to close
- Down payment
- $11,750
- Closing costs
- $1,410
- Reserves months
- —
- Total cash needed
- —
Loan-product check · same deal, 3 products live
Conventional
25% down · 7.5% · 30yr
- Down + closing
- —
- Monthly P&I
- —
- Monthly cashflow
- —
- DSCR
- —
- Eligible?
- —
Personal DTI + credit; lowest rate.
DSCR
20% down · 8.5% · 30yr
- Down + closing
- —
- Monthly P&I
- —
- Monthly cashflow
- —
- DSCR
- —
- Eligible?
- —
No personal income docs; deal must DSCR.
Hard money
10% down · 12.0% · 12mo
- Down + closing
- —
- Monthly P&I
- —
- Monthly cashflow
- —
- DSCR
- —
- Eligible?
- —
Short-term bridge; refi at stabilization.
Rent comps 6 comps
| Address | Beds | Baths | Sqft | Rent | $/sqft | DOM | Units | Dist |
|---|---|---|---|---|---|---|---|---|
| 8749 Breinig Run Cir Breinigsville, PA | 2.0 | 2.0 | 1029 | $1,695 | $1.65 | 2d | 1 | 0.16mi |
| 8395 Saylor Ct Breinigsville, PA | 3.0 | 1.5 | 1056 | $2,100 | $1.99 | 14d | 1 | 0.66mi |
| 1447 Artisan Ct Breinigsville, PA | 2.0 | 1.5 | 1056 | $2,150 | $2.04 | 14d | 1 | 0.67mi |
| 1055 Cetronia Rd Breinigsville, PA | 1.0–2.0 | 1.0–2.0 | 1094 | $2,355 | $2.15 | 2d | 8 | 1.07mi |
| 7744 Hamilton Blvd Breinigsville, PA | 2.0 | 1.0 | 613 | $1,700 | $2.77 | 43d | 1 | 1.16mi |
| 7740 Hamilton Blvd Breinigsville, PA | 1.0 | 1.0 | 756 | $1,700 | $2.25 | 14d | 1 | 1.17mi |
HOA detail
- Monthly dues
- $1,134 · $13,608/yr
Listing history 17 events
-
2026-06-18days on market $47,000 Active 50 DOM
-
2026-06-17days on market $47,000 Active 49 DOM
-
2026-06-16days on market $47,000 Active 48 DOM
-
2026-06-15days on market $47,000 Active 47 DOM
-
2026-06-14days on market $47,000 Active 45 DOM
-
2026-06-13days on market $47,000 Active 44 DOM
-
2026-06-10pricedays on market $47,000 Active 42 DOM
-
2026-06-09days on market $52,500 Active 41 DOM
-
2026-06-08days on market $52,500 Active 40 DOM
-
2026-06-07days on market $52,500 Active 39 DOM
-
2026-06-03days on market $52,500 Active 35 DOM
-
2026-06-02days on market $52,500 Active 34 DOM
-
2026-06-01days on market $52,500 Active 33 DOM
-
2026-05-31days on market $52,500 Active 32 DOM
-
2026-05-31days on market $52,500 Active 31 DOM
-
2026-05-16price $52,500 1231-char remark
-
2026-04-29$55,000 Active 1231-char remark
ⓘ Source: listings_history table (triggers on properties + properties_extension) + one-shot
backfill from property_details.listing_events for pre-trigger history.
Tax reassessment forecast PA · Partial reset (capped growth)
- Current annual tax
- $395 · $33/mo
- Projected year-2 tax
- $569 · $47/mo
- Expected delta
- +$174/yr (+$14/mo · 44.0%)
ⓘ Screening estimate from a state-policy table — verify with the county assessor before closing.
Climate risk First Street
- Flood 8/10 Severe FEMA zone X (unshaded) · 99% chance over 30 yrs
- Wildfire 1/10 Low
- Heat 4/10 Moderate 7 d/yr ≥100°F today · 15 d/yr by 30 yrs out
- Wind 4/10 Moderate 17% chance of damaging wind over 30 yrs
- Air quality 3/10 Moderate 2 unhealthy d/yr today · 3 by 30 yrs out
Nearby sold comps map
Loading sold comps map…
Walkable amenities ~0.75 mi
Loading nearby amenities…
Taxation est. · year 1
- Rental income
- $23,078
- − Mortgage interest
- −$2,633
- − Property taxes
- −$395
- − Insurance
- −$1,032
- − Repairs & maintenance
- −$1,846
- − Management
- −$1,846
- − HOA
- −$13,608
- − Depreciation
- −$1,367
- Taxable income
- $350
- Est. tax owed @ 24.0%
- −$84
- After-tax cash flow
- $155/yr
For passive investors: Depreciation is non-cash, so a rental often shows a tax loss while cash-flowing — sheltering income. Rental losses are passive: they offset passive income freely, and up to $25,000/yr can offset ordinary (W-2) income if you actively participate and your MAGI is under $100k (phasing out to $0 by $150k); unused losses carry forward. On sale, claimed depreciation is recaptured at up to 25%, and gains may owe capital-gains tax (a 1031 exchange can defer both). Figures are a year-1 estimate at your 24.0% rate — not tax advice; consult a CPA.
Schools (NCES district)
- District
- Parkland SD
- NCES district ID
- 4218510
- Math proficiency
- 59% ▼ -11.00%
- Reading proficiency
- 70% ▼ -12.00%
- Median HH income
- $77,976
- Composite
- 57.44/100
- National rank
- #1074
- State rank
- #40 of 539 in PA
Livability — Upper Macungie
No livability data for this city. (Only ~50 U.S. cities are tracked.)
Census & demographics
- Census place
- Breinigsville, PA
- County
- Lehigh County · 333,019 people
- Metro
- Allentown-Bethlehem-Easton, PA-NJ
- Population (ZIP)
- 11,570
- Household income
- $113,625
- Rent vs Own
- Severe rent burden
- 52.0
Population outlook (Lehigh County) Hauer SSP2
- Today (2025)
- 392,957 people
- By 2030
- 408,319 · +3.9%
- By 2040
- 440,007 · +12.0%
- By 2050
- 475,940 · +21.1%
- By 2075
- 590,448 · +50.3%
- By 2100
- 690,314 · +75.7%
Race, ethnicity, and origin ACS 2023
- Neighborhood character
- Diverse neighborhood (Simpson 0.58)
- Race & ethnicity
- White 61% Hispanic / Latino 19% Two or more races 17% Asian 12% Black 5%
- Hispanic origin (detail)
- Mexican 6% Puerto Rican 7% Dominican 3%
- Common ancestry
- Polish 4% Lithuanian 3% Scandinavian 3%
- Foreign-born
- 19% · Canada, United Kingdom, China
- Languages at home
- 76% English-only · Spanish 10% Other Indo-European 8% Other Asian/Pacific 2%
Political lean MEDSL · Lehigh
- 2024 margin
- Toss-up / Even · D 50.7% · R 48.0% · Other 1.2%
- 2008→2024 swing
- -12.9pp toward R · 2008: 15.6pp · 2024: 2.7pp
- All cycles
- 2024: D+2.7 2020: D+7.6 2016: D+4.4 2012: D+7.5 2008: D+15.6
Not yet ingested
- Civics
- —
Market trends
- HPI YoY
- ▼ -0.72%
- Current HPI
- 267.8218
- Rent YoY
- ▲ 1.92%
- Metro
- Allentown-Bethlehem-Easton, PA-NJ
- State GDP YoY
- ▲ 1.68%
- F500 in state
- 34
Industry mix (Fortune 500 HQ in PA)
| Industry | F500 HQs | Revenue |
|---|---|---|
| Healthcare | 2 | $309B |
|
||
| Insurance | 2 | $27B |
|
||
| Telecommunications / Media | 1 | $124B |
|
||
| Industrial Distribution | 1 | $22B |
|
||
| Financial Services | 1 | $20B |
|
||
| Chemicals / Materials | 1 | $18B |
|
||
Price history
-14.5% since first listed3 events — show timeline
- 2026-06-10 Price Changed $47,000 GLVRMLS
- 2026-05-16 Price Changed $52,500 GLVRMLS
- 2026-04-29 Listed $55,000 GLVRMLS
Property tax history
+2.0%/yrLatest (2026): $395 · +3.1% YoY. Source: county tax records.
Cash-flow waterfall
monthlySold comps — $/sqft
last 12 mo · ≤1 miLoading sold comps…