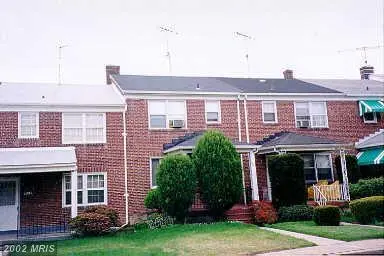
3113 Mondawmin Ave · Baltimore, MD
Flood risk 6/10 · Moderate
- FEMA flood zone
- X (unshaded)
- Chance of flooding over 30 yrs
- 0.75%
- Est. flood insurance / yr
- $473 – $860
Fire risk 1/10 · Minimal
- Est. fire insurance / yr
- $755 – $1,403
Heat risk 7/10 · Major
- Hot days now (above 103°F)
- 7 days/yr
- Hot days in 30 yrs
- 15 days/yr
Wind risk 6/10 · Moderate
- Chance of severe wind over 30 yrs
- 27.0%
Air-quality risk 3/10 · Minor
- Unhealthy air days now
- 3 days/yr
- Unhealthy air days in 30 yrs
- 4 days/yr
Risk factors via First Street. Map © Google.
Why this score? — see what drove the C grade
The composite is a weighted blend of 9 inputs, each scored 0–100. Each bar is that input's sub-score; the figure is the points it added to the 100-point composite (weight × sub-score).
- Cash flow +21.1/30.0
- ARV discount +15.0/15.0
- DSCR +6.7/10.0
- 1% rule +5.7/10.0
- Rent growth +4.0/5.0
- Livability +3.8/5.0
- Condition / age +2.5/5.0
- Schools +1.0/10.0
- Appreciation +0.0/10.0
$170,000
🖨 Deal sheet (PDF) 📄 Offer letter ✓ Due diligence
Listing remarks
Drastically reduced. This charming Colonial townhouse, built in 1926, offers a warm and inviting atmosphere with 1,216 sq. ft. of living space. Inside, you'll find three cozy bedrooms and a full bath, complemented by traditional wood floors and a ceiling fan for comfort. A formal dining room adds an elegant touch for entertaining. Step outside to enjoy the rear yard, ideal for relaxation or gardening. Located in the desirable Hanlon community, residents benefit from nearby parks and convenient access to public transportation, with bus stops and metro stations just a short distance away. The neighborhood is close proximity to local schools, ensuring a supportive environment for all. Experien
Key facts
- Built 1926
- Listed 28 days
Property features AI
Finance
- Other: Not in a federal flood zone; Pets allowed with no restrictions
Exterior
- Parking: On-street parking
- Utilities: Public water; Public sewer; Natural gas hot water
- Home design: Interior townhouse/rowhouse; Fee simple ownership; Located in city limits (Baltimore City)
- Construction: Brick construction; Brick/mortar foundation; Good condition
- Exterior features: Rear yard; Above-grade and below-grade structures
Interior
- Kitchen: Dishwasher; Disposal; Refrigerator; Stove
- Bedrooms: Three bedrooms on the upper level
- Flooring: Wood floors
- Bathrooms: One full bathroom
- Heating & cooling: Radiator heating (natural gas); Ceiling fans; Window air conditioning units
- Interior features: Ceiling fans; Formal dining room; Traditional floor plan; Eat-in kitchen / table space; Wood floors; Partially finished basement
- Laundry & utility: Laundry on lower floor; Dryer
Neighborhood map
What this means for you Summary
Snapshot
- This is a 3-bed/1.0-bath townhouse listed at $170k.
Deal economics
- At list price, monthly cash flow is $244 ($3k/yr) — positive.
- The deal already cash-flows at list — no discount required.
- Meets the 1% rule at list price ($2k rent vs $170k).
- Recommended offer: $167k (1.5% below list) — sets the bar for market timing.
Location & tenants
- Location reads 76/100 on livability (#90 in MD, #3,396 nationally) — a middle-class / working-renter tenant base. Strengths: amenities A+, commute A+, housing A+; Watch: crime F.
- Baltimore City Public Schools (urban): math 7% / reading 16% proficiency, ranked #24 of 24 in MD (top 100%) — low school quality limits family demand, transient renter base, plan for 1-2y turnover; 79% free/reduced lunch — lower-income household profile, screen leases tightly.
- Zoned schools: Elmer A. Henderson: A Johns Hopkins Partnership (math 2% / reading 16%, grade F, #650 of 860 statewide, top 77%, 642 students, 80% FRL); Vanguard Collegiate Middle (math 3% / reading 15%, grade F, #212 of 225 statewide, top 95%, 343 students, 84% FRL); Baltimore Polytechnic Institute (math 71% / reading 84%, grade A-, #22 of 222 statewide, top 10%, 1,555 students, 43% FRL).
- Zoned-school proficiency averages 32% at this address vs 12% district-wide (+20 pts) — the actual schools serving this property are materially stronger than the Baltimore City Public Schools average implies; a family-tenant draw the district grade alone would hide.
- Market conditions: Rents rising fast (+6.1%/yr); 253 active listings in the ZIP; 40 comparable units currently listed for rent nearby; rentals at typical pace (median 27d on market — plan ~3-4 weeks tenant-placement turnaround); lower-income renter base — watch delinquency; 1,273 units permitted in Baltimore city in 2024 (1,104 in 5+ unit buildings).
Forward outlook
- Local home prices are declining (-3.0%/yr); year-one equity from $1k of loan paydown is wiped out by about $5k of value loss. Plan a longer hold.
- Baltimore County population projected to shrink 4% by 2050 — rents likely to lag national; underwrite the cash flow, not the appreciation.
- At projected returns (-3.0% appreciation + 6.1% rent growth), your $48k cash investment doubles in ~10 years — after that, you're playing with house money.
Negotiation context
- It's been on market 29 days — a 2% lower offer ($167k) is reasonable based on typical stale-listing flexibility.
- 2 sale attempts since 29y ago; this cycle's ask has dropped $15k (8%) from the opening price — seller is motivated, your offer sets the floor, not the list.
- Current owner paid $60k; list at $170k implies a 183% gain — meaningful room to come down on a strong offer.
Risks & watch-outs
- Watch-outs: built in 1926 — expect roof / HVAC / electrical / plumbing capex.
- Climate carrying-cost: major flood risk; major wind risk, 27% chance of damaging wind over 30y; extreme-heat days projected 7→15/yr by 2055 (HVAC capex compounding) — expect insurance premiums to compound above CPI over the hold.
Questions for the listing agent
- Built in 1926 — when were the roof, HVAC, electrical panel, plumbing, and water heater last replaced?
- Is there a deadline driving the sale (1031 exchange, divorce, estate, relocation)? That informs how much negotiation room exists.
- Schools are D-rated, which usually means shorter tenancies and higher turnover. Who's the typical renter profile here, and what's been the actual vacancy rate?
- Crime grade is F in this area — have there been break-ins, vandalism, or insurance claims at this property in the last 3 years? What carrier currently insures it and at what premium?
- What's the average days-on-market for RENTAL listings here right now (not sales)? A rising rental-DOM trend means longer vacancies and softer asking-rent achievability than the comps imply.
- What's the recent tenant-quality profile in this submarket — average credit score on applications, eviction rate, late-payment / NSF rate, and stable-employment percentage? A property-management company in the area should have these aggregated.
- How much new for-sale + rental construction is in the pipeline within 1–3 miles? Heavy new supply typically softens prices + rents 12–24 months out; constrained supply supports both.
Investment metrics
- 1% rule
- 1.07% ✓
- Cap rate
- 8.01%
- Cash-on-cash
- 6.14%
- DSCR
- 1.27
- GRM
- 7.8
CMA / ARV
- ARV (median comp)
- $233,752
- List price
- $170,000
- Delta
- -27.27%
- Verdict
- UNDERPRICED
- Comps
- 20 within 1.0 mi
Show comp detail 12 sales within ~0.75 mi
| Address | Dist | Beds/Ba | Sqft | Sold | Price | $/sf | Match |
|---|---|---|---|---|---|---|---|
| 2326 Braddish Ave | 0.45mi | 3/1.5 | 1,500 (-1%) | 2mo | $159,000 | $106 | 74 |
| 3015 Windsor Ave | 0.23mi | 3/2.5 | 1,674 (+10%) | 2mo | $240 | — | 64 |
| 1625 N Rosedale St | 0.58mi | 3/1.0 | 1,396 (-8%) | 2mo | $36,000 | $26 | 59 |
| 3014 Tioga Pkwy | 0.58mi | 3/1.0 | 1,360 (-10%) | 4mo | $180,000 | $132 | 53 |
| 2920 Brighton St | 0.69mi | 3/2.5 | 1,440 (-5%) | 2mo | $247,500 | $172 | 52 |
| 3104 Tioga Pkwy | 0.62mi | 3/2.0 | 1,640 (+8%) | 3mo | $217,000 | $132 | 51 |
| 2829 Baker St | 0.70mi | 4/3.5 (+1) | 1,460 (-4%) | 2mo | $215,400 | $148 | 45 |
| 3020 Brighton St | 0.68mi | 4/2.5 (+1) | 1,406 (-7%) | 2mo | $209,000 | $149 | 44 |
| 3018 Presstman St | 0.72mi | 4/2.0 (+1) | 1,400 (-8%) | 1mo | $108,000 | $77 | 43 |
| 3004 Brighton St | 0.68mi | 3/1.0 | 1,288 (-15%) | 1mo | $44,000 | $34 | 42 |
| 1528 N Ellamont St | 0.68mi | 3/2.5 | 1,328 (-12%) | 1mo | $209,000 | $157 | 41 |
| 3300 Brighton St | 0.69mi | 2/2.0 (-1) | 1,344 (-11%) | 4mo | $130,000 | $97 | 37 |
Match score weights: distance 35% · size 25% · config 20% · recency 20%. Top-matched comps best support the ARV.
Projected returns pro-forma
-3.0% appreciation · 6.1% rent growth · sell at horizon
- IRR
- -3.3%
- Equity multiple
- 0.87×
- Total profit
- $-6,116
- Equity at exit
- $25,348
- IRR
- 9.6%
- Equity multiple
- 1.85×
- Total profit
- $40,502
- Equity at exit
- $14,698
Cash invested: $47,600 (down + closing). Projections, not guarantees.
Landlord ↔ Tenant lean methodology
- Overall (CITY)
- 12 Strongly Tenant-Friendly
- State Maryland
- 27 Tenant-Leaning · D+14
- County
- — inherits STATE
- City Baltimore
- 12 Strongly Tenant-Friendly · D+58
ZIP-level market 21216
- Rents YoY
- 6.1%
- Active inventory
- 253
- Price-to-rent
- 7.8×
Monthly cashflow live
- Estimated rent
- $1,825 high interval (Pro) →
- Mortgage (P&I)
- −$891
- Tax from tax record
- −$236 /mo · $2,833/yr
- Insurance
- −$71
- HOA
- −$0
- Lot rent
- −$0
- Vacancy / Maint / Mgmt
- −$383
- Net cashflow
- $244
Break-even live
Sensitivity live
| Price | -10% $340 | -5% $292 | +0% $244 | +5% $196 | +10% $147 |
|---|---|---|---|---|---|
| Rent | -10% $99 | -5% $172 | +0% $244 | +5% $316 | +10% $388 |
| Rate | -1.0pp $329 | -0.5pp $287 | base $244 | +0.5pp $200 | +1.0pp $155 |
UW: 25.0% down · 7.5% · 30yr · 1.5% tax · 5.0% vac · 8.0% maint · 8.0% mgmt
Financing live
Cash to close
- Down payment
- $42,500
- Closing costs
- $5,100
- Reserves months
- —
- Total cash needed
- —
Loan-product check · same deal, 3 products live
Conventional
25% down · 7.5% · 30yr
- Down + closing
- —
- Monthly P&I
- —
- Monthly cashflow
- —
- DSCR
- —
- Eligible?
- —
Personal DTI + credit; lowest rate.
DSCR
20% down · 8.5% · 30yr
- Down + closing
- —
- Monthly P&I
- —
- Monthly cashflow
- —
- DSCR
- —
- Eligible?
- —
No personal income docs; deal must DSCR.
Hard money
10% down · 12.0% · 12mo
- Down + closing
- —
- Monthly P&I
- —
- Monthly cashflow
- —
- DSCR
- —
- Eligible?
- —
Short-term bridge; refi at stabilization.
Rent comps 40 comps
| Address | Beds | Baths | Sqft | Rent | $/sqft | DOM | Units | Dist |
|---|---|---|---|---|---|---|---|---|
| 3028 Hanlon Ave Baltimore, MD | 3.0 | 2.0 | 1200 | $1,711 | $1.43 | 26d | 1 | 0.09mi |
| 3030 Windsor Ave Baltimore, MD | 4.0 | 1.5 | 2124 | $1,995 | $0.94 | 7d | 1 | 0.19mi |
| 2917 Clifton Ave Baltimore, MD | 4.0 | 4.0 | 1700 | $2,150 | $1.26 | 26d | 1 | 0.33mi |
| 2812 Clifton Ave Baltimore, MD | 3.0 | 1.5 | 1650 | $1,850 | $1.12 | 46d | 1 | 0.37mi |
| 3403 Carlisle Ave Apt 1 Baltimore, MD | 2.0 | 1.0 | 1100 | $1,600 | $1.45 | 14d | 1 | 0.40mi |
| 1633 N Hilton St Baltimore, MD | 4.0 | 2.5 | 1920 | $2,600 | $1.35 | 20d | 1 | 0.58mi |
| 3507 Powhatan Ave Unit 1 Baltimore, MD | 2.0 | 1.0 | 1500 | $1,700 | $1.13 | 0d | 1 | 0.59mi |
| 2103 Chelsea Ter Unit 2 Baltimore, MD | 3.0 | 1.5 | 1500 | $2,100 | $1.40 | 17d | 1 | 0.61mi |
| 2103 Chelsea Ter Unit 1 Baltimore, MD | 2.0 | 2.0 | 1500 | $2,200 | $1.47 | 17d | 1 | 0.61mi |
| 3104 Tioga Pkwy Baltimore, MD | 3.0 | 2.0 | 1640 | $2,050 | $1.25 | 24d | 1 | 0.62mi |
| 2636 W North Ave Baltimore, MD | 2.0–3.0 | 1.0–2.0 | 975 | $1,475 | $1.51 | 7d | 1 | 0.62mi |
| 3904 Gwynns Falls Pkwy Baltimore, MD | 3.0 | 2.0 | 1772 | $2,600 | $1.47 | 46d | 1 | 0.64mi |
| 1530 N Rosedale St Baltimore, MD | 3.0 | 2.0 | 1641 | $1,795 | $1.09 | 1d | 1 | 0.66mi |
| 1513 N Ellamont St Baltimore, MD | 3.0 | 1.0 | 1700 | $1,700 | $1.00 | 26d | 1 | 0.70mi |
| 3309 Brighton St Baltimore, MD | 3.0 | 1.0 | 1134 | $1,700 | $1.50 | 46d | 1 | 0.71mi |
| 3709 Nortonia Rd #2 Baltimore, MD | 2.0 | 1.0 | 1289 | $1,450 | $1.12 | 20d | 1 | 0.74mi |
| 3003 Presstman St Unit 1 Baltimore, MD | 2.0 | 2.0 | 1450 | $1,400 | $0.97 | 47d | 1 | 0.75mi |
| 3003 Presstman St Unit 2 Baltimore, MD | 2.0 | 1.0 | 1450 | $1,300 | $0.90 | 26d | 1 | 0.75mi |
| 2800 Presstman St Baltimore, MD | 3.0 | 2.5 | 1460 | $1,799 | $1.23 | 26d | 1 | 0.77mi |
| 1402 Poplar Grove St Baltimore, MD | 4.0 | 1.5 | 1540 | $800 | $0.52 | 46d | 1 | 0.81mi |
| 2405 W North Ave Baltimore, MD | 4.0 | 3.0 | 1826 | $1,900 | $1.04 | 7d | 1 | 0.84mi |
| 2305 Wichita Ave Unit 1 Baltimore, MD | 3.0 | 1.0 | 1950 | $1,250 | $0.64 | 1d | 1 | 0.89mi |
| 2204 Clifton Ave Baltimore, MD | 3.0 | 1.0 | 1400 | $1,450 | $1.04 | 7d | 1 | 0.91mi |
| 2910 Reisterstown Rd Baltimore, MD | 1.0–3.0 | 1.0 | 950 | $1,414 | $1.49 | 17d | 4 | 0.91mi |
| 1617-A Moreland Ave Unit 2nd Flr Baltimore, MD | 2.0 | 1.0 | 1500 | $1,400 | $0.93 | 46d | 1 | 0.92mi |
| 1816 N Bentalou St Baltimore, MD | 3.0 | 2.0 | 1350 | $1,700 | $1.26 | 13d | 1 | 0.94mi |
| 1816 N Bentalou St Baltimore, MD | 3.0 | 2.0 | 1350 | $1,700 | $1.26 | 26d | 1 | 0.94mi |
| 3204 Sequoia Ave Baltimore, MD | 4.0 | 2.5 | 1791 | $2,600 | $1.45 | 46d | 1 | 0.95mi |
| 3238 Westmont Ave Baltimore, MD | 3.0 | 1.0 | 1280 | $1,600 | $1.25 | 46d | 1 | 0.96mi |
| 3508 Grantley Rd Baltimore, MD | 2.0 | 1.0 | 1250 | $1,350 | $1.08 | 26d | 1 | 0.97mi |
| 2128 N Pulaski St Baltimore, MD | 4.0 | 3.0 | 2166 | $2,200 | $1.02 | 46d | 1 | 0.99mi |
| 2728 Winchester St Baltimore, MD | 3.0 | 1.5 | 1260 | $1,800 | $1.43 | 6d | 1 | 1.00mi |
| 2806 Riggs Ave Baltimore, MD | 3.0 | 2.5 | 1412 | $1,900 | $1.35 | 6d | 1 | 1.05mi |
| 2732 Riggs Ave Baltimore, MD | 3.0 | 1.0 | 1730 | $1,700 | $0.98 | 1d | 1 | 1.07mi |
| 2744 W Mosher St Baltimore, MD | 4.0 | 2.0 | 1412 | $2,100 | $1.49 | 26d | 1 | 1.13mi |
| 3914 Maine Ave Unit 3 Baltimore, MD | 2.0 | 1.0 | 2127 | $1,150 | $0.54 | 46d | 1 | 1.14mi |
| 2201 Whittier Ave Baltimore, MD | 4.0 | 2.0 | 1750 | $1,700 | $0.97 | 46d | 1 | 1.15mi |
| 2201 Whittier Ave Baltimore, MD | 4.0 | 2.0 | 1750 | $1,700 | $0.97 | 20d | 1 | 1.15mi |
| 3935 Stokes Dr #1 Baltimore, MD | 2.0 | 1.0 | 1150 | $1,400 | $1.22 | 46d | 1 | 1.18mi |
| 4309 Norfolk Ave Unit 1st Floor Baltimore, MD | 2.0 | 1.0 | 1470 | $1,500 | $1.02 | 14d | 1 | 1.18mi |
Listing history 20 events
-
2026-06-22days on market $170,000 Active 29 DOM
-
2026-06-21days on market $170,000 Active 28 DOM
-
2026-06-18days on market $170,000 Active 25 DOM
-
2026-06-17days on market $170,000 Active 24 DOM
-
2026-06-16days on market $170,000 Active 23 DOM
-
2026-06-15days on market $170,000 Active 22 DOM
-
2026-06-13pricedays on market $170,000 Active 20 DOM
-
2026-06-09days on market $185,000 Active 16 DOM
-
2026-06-08days on market $185,000 Active 15 DOM
-
2026-06-07days on market $185,000 Active 14 DOM
-
2026-06-04days on market $185,000 Active 11 DOM
-
2026-06-03days on market $185,000 Active 10 DOM
-
2026-06-02days on market $185,000 Active 9 DOM
-
2026-06-01days on market $185,000 Active 8 DOM
-
2026-05-31days on market $185,000 Active 7 DOM
-
2026-04-29historical $185,000 814-char remark
-
1998-07-06soldstatus $60,100
-
1998-06-29soldstatus $60,000
-
1998-05-29historical
-
1997-04-15$68,000
ⓘ Source: listings_history table (triggers on properties + properties_extension) + one-shot
backfill from property_details.listing_events for pre-trigger history.
Tax reassessment forecast MD · Partial reset (capped growth)
- Current annual tax
- $2,833 · $236/mo
- Projected year-2 tax
- $2,833 · $236/mo
- Expected delta
- $0/yr ($0/mo · -0.0%)
ⓘ Screening estimate from a state-policy table — verify with the county assessor before closing.
Climate risk First Street
- Flood 6/10 Major FEMA zone X (unshaded) · 75% chance over 30 yrs
- Wildfire 1/10 Low
- Heat 7/10 Severe 7 d/yr ≥103°F today · 15 d/yr by 30 yrs out
- Wind 6/10 Major 27% chance of damaging wind over 30 yrs
- Air quality 3/10 Moderate 3 unhealthy d/yr today · 4 by 30 yrs out
Nearby sold comps map
Loading sold comps map…
Walkable amenities ~0.75 mi
Loading nearby amenities…
Taxation est. · year 1
- Rental income
- $21,905
- − Mortgage interest
- −$9,523
- − Property taxes
- −$2,833
- − Insurance
- −$850
- − Repairs & maintenance
- −$1,752
- − Management
- −$1,752
- − Depreciation
- −$4,945
- Taxable income
- $249
- Est. tax owed @ 24.0%
- −$60
- After-tax cash flow
- $2,864/yr
For passive investors: Depreciation is non-cash, so a rental often shows a tax loss while cash-flowing — sheltering income. Rental losses are passive: they offset passive income freely, and up to $25,000/yr can offset ordinary (W-2) income if you actively participate and your MAGI is under $100k (phasing out to $0 by $150k); unused losses carry forward. On sale, claimed depreciation is recaptured at up to 25%, and gains may owe capital-gains tax (a 1031 exchange can defer both). Figures are a year-1 estimate at your 24.0% rate — not tax advice; consult a CPA.
Schools (NCES district)
- District
- Baltimore City Public Schools
- NCES district ID
- 2400090
- Math proficiency
- 7% ▼ -9.00%
- Reading proficiency
- 16% ▼ -5.00%
- Median HH income
- $42,108
- Composite
- 10.08/100
- National rank
- #9805
- State rank
- #24 of 24 in MD
Livability — Baltimore
- Score
- 76/100
- State rank
- #90
- US rank
- #3396
Category grades
Schools grade is shown separately in the Schools card above.
Census & demographics
- Census place
- Baltimore, MD
- County
- Baltimore City · 558,601 people
- City population
- 588,727
- Metro
- Baltimore-Columbia-Towson, MD
- Population (ZIP)
- 29,426
- Household income
- $42,031
- Rent vs Own
- Severe rent burden
- 2264.0
Population outlook (Baltimore County) Hauer SSP2
- Today (2025)
- 624,249 people
- By 2030
- 621,541 · -0.4%
- By 2040
- 609,756 · -2.3%
- By 2050
- 597,249 · -4.3%
- By 2075
- 552,236 · -11.5%
- By 2100
- 513,934 · -17.7%
Race, ethnicity, and origin ACS 2023
- Neighborhood character
- Predominantly Black (91%)
- Race & ethnicity
- Black 91% Hispanic / Latino 4% Two or more races 3% White 2%
- Foreign-born
- 3% · Canada
- Languages at home
- 96% English-only · Spanish 3% French/Haitian/Cajun 1%
Political lean MEDSL · Baltimore
- 2024 margin
- Solid D (+73.0) · D 85.2% · R 12.2% · Other 2.6%
- 2008→2024 swing
- -2.5pp toward R · 2008: 75.5pp · 2024: 73.0pp
- All cycles
- 2024: D+73.0 2020: D+76.6 2016: D+74.6 2012: D+76.4 2008: D+75.5
Not yet ingested
- Civics
- —
Market trends
- HPI YoY
- ▼ -107.42%
- Current HPI
- 164.3933
- Rent YoY
- ▲ 6.10%
- Metro
- Baltimore-Columbia-Towson, MD
- State GDP YoY
- ▲ 2.97%
- F500 in state
- 12
Industry mix (Fortune 500 HQ in MD)
| Industry | F500 HQs | Revenue |
|---|---|---|
| Aerospace / Defense | 1 | $71B |
|
||
| Utilities | 1 | $25B |
|
||
| Hotels | 1 | $24B |
|
||
| Consumer Goods | 1 | $7B |
|
||
| Real Estate | 1 | $6B |
|
||
| Chemicals | 1 | $2B |
|
||
Price history
+150.0% since first listed7 events — show timeline
- 2026-06-12 Price Changed $170,000 BRIGHT MLS
- 2026-05-25 Listed $185,000 BRIGHT MLS
- 2026-04-29 Coming Soon $185,000 BRIGHT MLS
- 1998-07-06 Sold (Public Records) $60,100 Public Records
- 1998-06-29 Sold (MLS) $60,000 MRIS
- 1998-05-29 Delisted — MRIS
- 1997-04-15 Listed $68,000 MRIS
Property tax history
+3.4%/yrLatest (2025): $2,833 · +8.8% YoY. Source: county tax records.
Cash-flow waterfall
monthlySold comps — $/sqft
last 12 mo · ≤1 miLoading sold comps…