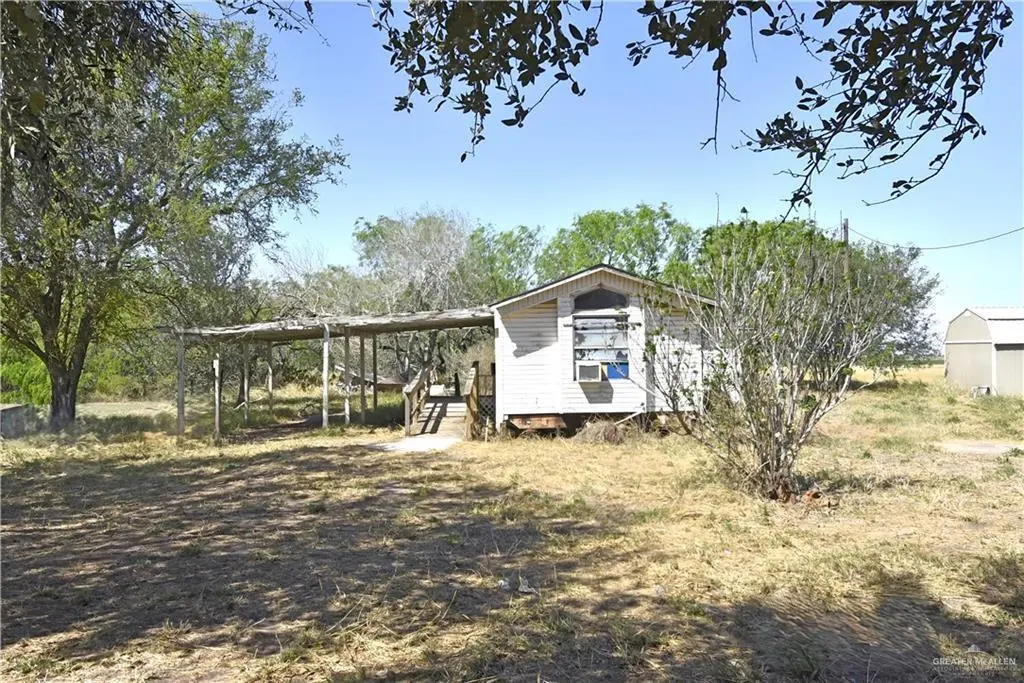
9535 Maneado Rd · San Perlita, TX
Flood risk 4/10 · Minor
- FEMA flood zone
- X (unshaded)
- Chance of flooding over 30 yrs
- 0.29%
- Est. flood insurance / yr
- $507 – $1,088
Fire risk 1/10 · Minimal
- Est. fire insurance / yr
- $1,222 – $2,270
Heat risk 10/10 · Severe
- Hot days now (above 110°F)
- 5 days/yr
- Hot days in 30 yrs
- 17 days/yr
Wind risk 9/10 · Severe
- Chance of severe wind over 30 yrs
- 99.0%
Air-quality risk 1/10 · Minimal
- Unhealthy air days now
- 0 days/yr
- Unhealthy air days in 30 yrs
- 0 days/yr
Risk factors via First Street. Map © Google.
Why this score? — see what drove the B+ grade
The composite is a weighted blend of 9 inputs, each scored 0–100. Each bar is that input's sub-score; the figure is the points it added to the 100-point composite (weight × sub-score).
- Cash flow +30.0/30.0
- 1% rule +10.0/10.0
- DSCR +10.0/10.0
- Appreciation +9.1/10.0
- ARV discount +7.5/15.0
- Livability +2.7/5.0
- Rent growth +2.5/5.0
- Condition / age +2.5/5.0
- Schools +1.9/10.0
$39,900
🖨 Deal sheet (PDF) 📄 Offer letter ✓ Due diligence
Listing remarks MLS
Dreaming of space, peace, and country living? These 1.66 acres—perfectly located outside the city limits for added privacy and tranquility. Whether you're looking to retire in a quiet “ranchito”-style setting or searching for the perfect weekend getaway, this property offers the best of both worlds. Enjoy wide open space, fresh air, and the freedom to make it your own.
Key facts
- 1.66 acre lot
- Garage
- Built 1999
Neighborhood map
What this means for you Summary
Snapshot
- This is a 3-bed/2.0-bath manufactured listed at $40k.
Deal economics
- At list price, monthly cash flow is $444 ($5k/yr) — positive.
- The deal already cash-flows at list — no discount required.
- Meets the 1% rule at list price ($934 rent vs $40k).
- Recommended offer: $39k (3.0% below list) — sets the bar for market timing.
Location & tenants
- Location reads 54/100 on livability (#1,413 in TX) — a working-class tenant base; expect higher turnover. Strengths: cost of living A+, housing A+; Watch: schools D, crime F, amenities F.
- Lyford CISD (town): math 17% / reading 31% proficiency, ranked #750 of 826 in TX (top 91%) — low school quality limits family demand, transient renter base, plan for 1-2y turnover; 69% free/reduced lunch — lower-income household profile, screen leases tightly.
- Market conditions: 29 active listings in the ZIP; 36 units permitted in Willacy County in 2024 (0 in 5+ unit buildings).
Forward outlook
- In year one you build about $4k of equity ($276 loan paydown + $3k appreciation (8.3% local appreciation)).
- Willacy County population projected to shrink 9% by 2050 — rents likely to lag national; underwrite the cash flow, not the appreciation.
- At projected returns (8.3% appreciation + 3.0% rent growth), your $11k cash investment doubles in ~2 years — after that, you're playing with house money.
- By year 9, paydown + projected appreciation supports a ~$35k cash-out refi (75% LTV) — recoverable capital for the next deal without selling this one.
Negotiation context
- It's been on market 49 days — a 3% lower offer ($39k) is reasonable based on typical stale-listing flexibility.
Risks & watch-outs
- Climate carrying-cost: severe wind risk, 99% chance of damaging wind over 30y; extreme-heat days projected 5→17/yr by 2055 (HVAC capex compounding) — expect insurance premiums to compound above CPI over the hold.
Questions for the listing agent
- It's been on market 49 days. Have you received any prior offers? Is the seller open to a 3% concession, seller financing, or rate buy-down credit?
- Is there a deadline driving the sale (1031 exchange, divorce, estate, relocation)? That informs how much negotiation room exists.
- Schools are D-rated, which usually means shorter tenancies and higher turnover. Who's the typical renter profile here, and what's been the actual vacancy rate?
- Crime grade is F in this area — have there been break-ins, vandalism, or insurance claims at this property in the last 3 years? What carrier currently insures it and at what premium?
- What's the average days-on-market for RENTAL listings here right now (not sales)? A rising rental-DOM trend means longer vacancies and softer asking-rent achievability than the comps imply.
- What's the recent tenant-quality profile in this submarket — average credit score on applications, eviction rate, late-payment / NSF rate, and stable-employment percentage? A property-management company in the area should have these aggregated.
- How much new for-sale + rental construction is in the pipeline within 1–3 miles? Heavy new supply typically softens prices + rents 12–24 months out; constrained supply supports both.
Investment metrics
- 1% rule
- 2.34% ✓
- Cap rate
- 19.65%
- Cash-on-cash
- 47.70%
- DSCR
- 3.12
- GRM
- 3.6
CMA / ARV
- ARV (median comp)
- $39,900
- List price
- $39,900
- Delta
- —
- Verdict
- FAIR
- Comps
- 1 within 2.0 mi
Show comp detail 1 sale within ~0.75 mi
| Address | Dist | Beds/Ba | Sqft | Sold | Price | $/sf | Match |
|---|---|---|---|---|---|---|---|
| 9535 Maneado Rd | 0.00mi | 3/2.0 | 952 (0%) | 0mo | $39,900 | $42 | 100 |
Match score weights: distance 35% · size 25% · config 20% · recency 20%. Top-matched comps best support the ARV.
Projected returns pro-forma
8.3% appreciation · 3.0% rent growth · sell at horizon
- IRR
- 59.6%
- Equity multiple
- 5.07×
- Total profit
- $45,509
- Equity at exit
- $31,123
- IRR
- 54.5%
- Equity multiple
- 10.95×
- Total profit
- $111,119
- Equity at exit
- $62,568
Cash invested: $11,172 (down + closing). Projections, not guarantees.
Landlord ↔ Tenant lean methodology
- Overall (STATE)
- 87 Strongly Landlord-Friendly
- State Texas
- 87 Strongly Landlord-Friendly · R+5
- County
- — inherits STATE
- City
- — inherits STATE
ZIP-level market 78569
- Home prices YoY
- 9.8%
- Active inventory
- 29
- Price-to-rent
- 3.6×
Monthly cashflow live
- Estimated rent
- $934 medium interval (Pro) →
- Mortgage (P&I)
- −$209
- Tax from tax record
- −$68 /mo · $812/yr
- Insurance
- −$17
- HOA
- −$0
- Vacancy / Maint / Mgmt
- −$196
- Net cashflow
- $444
Break-even live
Sensitivity live
| Price | -10% $467 | -5% $455 | +0% $444 | +5% $433 | +10% $422 |
|---|---|---|---|---|---|
| Rent | -10% $370 | -5% $407 | +0% $444 | +5% $481 | +10% $518 |
| Rate | -1.0pp $464 | -0.5pp $454 | base $444 | +0.5pp $434 | +1.0pp $423 |
UW: 25.0% down · 7.5% · 30yr · 1.5% tax · 5.0% vac · 8.0% maint · 8.0% mgmt
Financing live
Cash to close
- Down payment
- $9,975
- Closing costs
- $1,197
- Reserves months
- —
- Total cash needed
- —
Loan-product check · same deal, 3 products live
Conventional
25% down · 7.5% · 30yr
- Down + closing
- —
- Monthly P&I
- —
- Monthly cashflow
- —
- DSCR
- —
- Eligible?
- —
Personal DTI + credit; lowest rate.
DSCR
20% down · 8.5% · 30yr
- Down + closing
- —
- Monthly P&I
- —
- Monthly cashflow
- —
- DSCR
- —
- Eligible?
- —
No personal income docs; deal must DSCR.
Hard money
10% down · 12.0% · 12mo
- Down + closing
- —
- Monthly P&I
- —
- Monthly cashflow
- —
- DSCR
- —
- Eligible?
- —
Short-term bridge; refi at stabilization.
Listing history 4 events
-
2026-05-19status Pending 389-char remark
Show marketing remark (389 chars)
Dreaming of space, peace, and country living? These 1.66 acres—perfectly located outside the city limits for added privacy and tranquility. Whether you're looking to retire in a quiet “ranchito”-style setting or searching for the perfect weekend getaway, this property offers the best of both worlds. Enjoy wide open space, fresh air, and the freedom to make it your own.
-
2026-05-03price $39,900
-
2026-04-29price $39,900 389-char remark
Show marketing remark (389 chars)
Dreaming of space, peace, and country living? These 1.66 acres—perfectly located outside the city limits for added privacy and tranquility. Whether you're looking to retire in a quiet “ranchito”-style setting or searching for the perfect weekend getaway, this property offers the best of both worlds. Enjoy wide open space, fresh air, and the freedom to make it your own.
-
2026-03-30$44,900 Active 389-char remark
Show marketing remark (389 chars)
Dreaming of space, peace, and country living? These 1.66 acres—perfectly located outside the city limits for added privacy and tranquility. Whether you're looking to retire in a quiet “ranchito”-style setting or searching for the perfect weekend getaway, this property offers the best of both worlds. Enjoy wide open space, fresh air, and the freedom to make it your own.
ⓘ Source: listings_history table (triggers on properties + properties_extension) + one-shot
backfill from property_details.listing_events for pre-trigger history.
Tax reassessment forecast TX · Resets to sale price
- Current annual tax
- $812 · $68/mo
- Projected year-2 tax
- $812 · $68/mo
- Expected delta
- $0/yr ($0/mo · 0.0%)
ⓘ Screening estimate from a state-policy table — verify with the county assessor before closing.
Climate risk First Street
- Flood 4/10 Moderate FEMA zone X (unshaded) · 29% chance over 30 yrs
- Wildfire 1/10 Low
- Heat 10/10 Extreme 5 d/yr ≥110°F today · 17 d/yr by 30 yrs out
- Wind 9/10 Extreme 99% chance of damaging wind over 30 yrs
- Air quality 1/10 Low 0 unhealthy d/yr today · 0 by 30 yrs out
Nearby sold comps map
Loading sold comps map…
Walkable amenities ~0.75 mi
Loading nearby amenities…
Taxation est. · year 1
- Rental income
- $11,205
- − Mortgage interest
- −$2,235
- − Property taxes
- −$812
- − Insurance
- −$200
- − Repairs & maintenance
- −$896
- − Management
- −$896
- − Depreciation
- −$1,161
- Taxable income
- $5,005
- Est. tax owed @ 24.0%
- −$1,201
- After-tax cash flow
- $4,128/yr
For passive investors: Depreciation is non-cash, so a rental often shows a tax loss while cash-flowing — sheltering income. Rental losses are passive: they offset passive income freely, and up to $25,000/yr can offset ordinary (W-2) income if you actively participate and your MAGI is under $100k (phasing out to $0 by $150k); unused losses carry forward. On sale, claimed depreciation is recaptured at up to 25%, and gains may owe capital-gains tax (a 1031 exchange can defer both). Figures are a year-1 estimate at your 24.0% rate — not tax advice; consult a CPA.
Schools (NCES district)
- District
- Lyford CISD
- NCES district ID
- 4828620
- Math proficiency
- 17% ▼ -28.00%
- Reading proficiency
- 31% ▼ -8.00%
- Median HH income
- $28,509
- Composite
- 19.12/100
- National rank
- #8835
- State rank
- #750 of 826 in TX
Livability — San Perlita
- Score
- 54/100
- State rank
- #1413
- US rank
- #24191
Category grades
Schools grade is shown separately in the Schools card above.
Census & demographics
- City population
- 449
- Population (ZIP)
- 4,079
Population outlook (Willacy County) Hauer SSP2
- Today (2025)
- 21,429 people
- By 2030
- 21,075 · -1.7%
- By 2040
- 20,318 · -5.2%
- By 2050
- 19,489 · -9.1%
- By 2075
- 16,758 · -21.8%
- By 2100
- 12,735 · -40.6%
Race, ethnicity, and origin ACS 2023
- Neighborhood character
- Predominantly Hispanic (86%)
- Race & ethnicity
- Hispanic / Latino 86% Two or more races 40% White 13%
- Hispanic origin (detail)
- Mexican 83%
- Common ancestry
- Danish 1%
- Foreign-born
- 10% · Canada
- Languages at home
- 34% English-only · Spanish 66%
Political lean MEDSL · Willacy
- 2024 margin
- Toss-up / Even · D 48.0% · R 51.3%
- 2008→2024 swing
- -43.1pp toward R · 2008: 39.8pp · 2024: -3.3pp
- All cycles
- 2024: R+3.3 2020: D+12.0 2016: D+36.9 2012: D+43.1 2008: D+39.8
Not yet ingested
- Civics
- —
Market trends
- HPI YoY
- ▲ 8.30%
- Current HPI
- 92.8227
- Rent YoY
- —
- Metro
- —
- State GDP YoY
- ▲ 3.95%
- F500 in state
- 110
Industry mix (Fortune 500 HQ in TX)
| Industry | F500 HQs | Revenue |
|---|---|---|
| Energy | 16 | $1,198B |
|
||
| Technology | 5 | $198B |
|
||
| Engineering / Construction | 4 | $72B |
|
||
| Energy Services | 3 | $60B |
|
||
| Utilities | 3 | $41B |
|
||
| Healthcare | 2 | $330B |
|
||
Price history
-11.1% since first listed4 events — show timeline
- 2026-05-19 Pending — MCALLENMLS
- 2026-05-03 Price Changed $39,900 RGVMLS
- 2026-04-29 Price Changed $39,900 MCALLENMLS
- 2026-03-30 Listed $44,900 MCALLENMLS
Property tax history
+3.4%/yrLatest (2025): $812 · +5.8% YoY. Source: county tax records.
Cash-flow waterfall
monthlySold comps — $/sqft
last 12 mo · ≤1 miLoading sold comps…