 Duplex
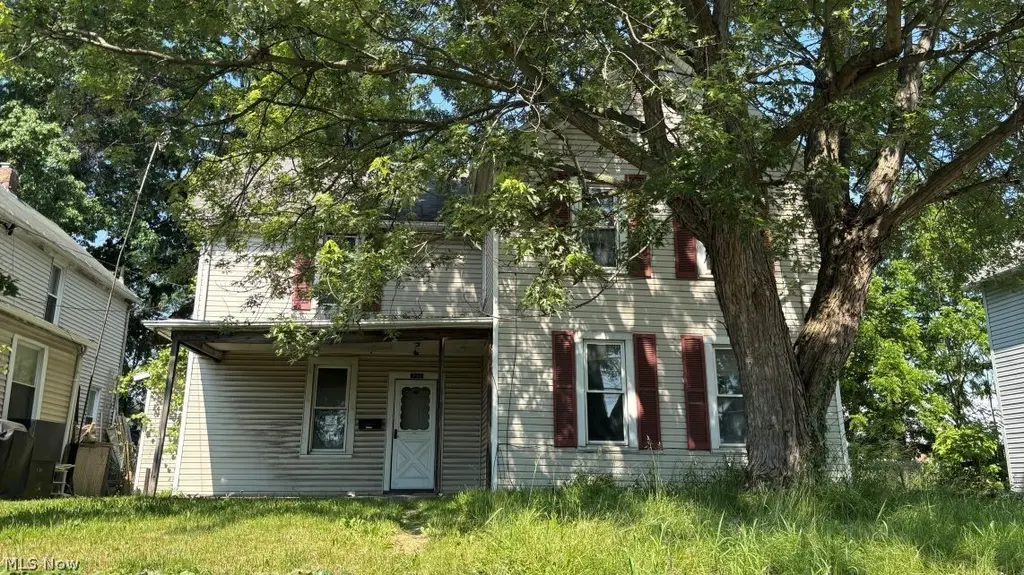
756 Brown St · Akron, OH
Flood risk 1/10 · Minimal
- FEMA flood zone
- X (unshaded)
- Chance of flooding over 30 yrs
- 0.0%
- Est. flood insurance / yr
- $473 – $860
Fire risk 1/10 · Minimal
- Est. fire insurance / yr
- $713 – $1,323
Heat risk 3/10 · Minor
- Hot days now (above 96°F)
- 7 days/yr
- Hot days in 30 yrs
- 17 days/yr
Wind risk 1/10 · Minimal
- Chance of severe wind over 30 yrs
- —
Air-quality risk 3/10 · Minor
- Unhealthy air days now
- 2 days/yr
- Unhealthy air days in 30 yrs
- 4 days/yr
Risk factors via First Street. Map © Google.
Why this score? — see what drove the B- grade
The composite is a weighted blend of 9 inputs, each scored 0–100. Each bar is that input's sub-score; the figure is the points it added to the 100-point composite (weight × sub-score).
- Cash flow +30.0/30.0
- 1% rule +10.0/10.0
- DSCR +10.0/10.0
- ARV discount +7.5/15.0
- Livability +4.0/5.0
- Rent growth +2.5/5.0
- Condition / age +2.5/5.0
- Schools +2.1/10.0
- Appreciation +0.0/10.0
$54,500
🖨 Deal sheet 📄 Offer letter ✓ Due diligence
Multi-family units
County records classify this as Multi-Family (2-4 Unit). Listing-text estimate: 2 units. confirmed
Listing remarks MLS
Investor’s dream! This spacious 5-bedroom, 3-bathroom duplex offers endless potential. With some TLC, it could shine as a fantastic rental property or a home with extra income potential. Bonus: there’s a possibility of adding a 6th bedroom! Bring your vision and tools to unlock this property’s full potential. Don’t miss out!
Key facts
- 5,301 sq ft lot
- Parking
- Built 1899
Property features AI
Finance
- Financial info: Tenant pays all utilities
Exterior
- Parking: Driveway, no garage
- Utilities: Public water; Public sewer
- Home design: 2-story house; Fixer condition
- Construction: Vinyl siding; Asphalt/fiberglass roof; Built per public records
- Exterior features: Public water; Public sewer
Interior
- Bedrooms: Total rooms: 9
- Bathrooms: 3 full bathrooms
- Heating & cooling: Hot water heating; Steam heating
- Interior features: Partial, unfinished basement
- Laundry & utility: Laundry located in basement
Neighborhood map
What this means for you Summary
Snapshot
- This is a 2 × 2-bed/1.5-bath units multifamily listed at $54k.
Deal economics
- At list price, monthly cash flow is $1k ($15k/yr) — positive. Per door: $637/mo.
- The deal already cash-flows at list — no discount required.
- Meets the 1% rule at list price ($2k rent vs $54k).
- Cap rate 34.3% vs local median 6.6% in Akron — top-decile yield for the area; either an underpriced asset or a hidden risk that comps aren't pricing in. Stress-test before assuming the spread holds.
Location & tenants
- Location reads 81/100 on livability (#104 in OH, #1,591 nationally) — a professional / high-income tenant draw. Strengths: amenities A+, commute A+, cost of living A+; Watch: crime F, employment F.
- Akron City (urban): math 22% / reading 30% proficiency, ranked #602 of 656 in OH (top 92%) — low school quality limits family demand, transient renter base, plan for 1-2y turnover; 66% free/reduced lunch — lower-income household profile, screen leases tightly.
- Market conditions: 54 active listings in the ZIP; 25 comparable units currently listed for rent nearby; rentals lingering (median 44d on market — plan ~5-8 weeks vacancy on turnover, expect pricing pressure); 52% of comp listings sitting > 30 days — soft ceiling on asking rent; lower-income renter base — watch delinquency; 1,114 units permitted in Summit County in 2024 (397 in 5+ unit buildings).
- At $2,142/mo this rent would consume 105% of the median local household income ($24k/yr) (locally 659% of renters already pay >50% of income on rent) — very limited rent-growth headroom before tenants either downsize or default.
Forward outlook
- Local home prices are declining (-3.0%/yr); year-one equity from $377 of loan paydown is wiped out by about $2k of value loss. Plan a longer hold.
- Summit County population projected to shrink 6% by 2050 — rents likely to lag national; underwrite the cash flow, not the appreciation.
- At projected returns (-3.0% appreciation + 3.0% rent growth), your $15k cash investment doubles in ~2 years — after that, you're playing with house money.
Negotiation context
- Only 13 days on market — expect competitive offers; lowballing is unlikely to land.
- 7 sale attempts since 2y ago with the ask held roughly flat each time — persistent listings suggest the price (not the market) is what's stuck; bring a comps-based counter.
- Current owner paid $36k; list at $54k implies a 51% gain — meaningful room to come down on a strong offer.
Risks & watch-outs
- Watch-outs: built in 1899 — expect roof / HVAC / electrical / plumbing capex.
Questions for the listing agent
- Can we see the unit-by-unit rent roll, current vacancy, and any below-market leases? What's the average tenancy length?
- What capital expenditures (roof, boiler, parking lot, exteriors) have been made in the last 5 years, and what's planned in the next 2?
- Built in 1899 — when were the roof, HVAC, electrical panel, plumbing, and water heater last replaced?
- Is there a deadline driving the sale (1031 exchange, divorce, estate, relocation)? That informs how much negotiation room exists.
- Crime grade is F in this area — have there been break-ins, vandalism, or insurance claims at this property in the last 3 years? What carrier currently insures it and at what premium?
- What's the average days-on-market for RENTAL listings here right now (not sales)? A rising rental-DOM trend means longer vacancies and softer asking-rent achievability than the comps imply.
- What's the recent tenant-quality profile in this submarket — average credit score on applications, eviction rate, late-payment / NSF rate, and stable-employment percentage? A property-management company in the area should have these aggregated.
- How much new apartment / multifamily construction is in the pipeline within 1–3 miles? Heavy new supply (>2% of stock underway) typically softens rents 12–24 months out; light construction supports rent growth.
Investment metrics
- 1% rule
- 3.93% ✓
- Cap rate
- 34.33%
- Cash-on-cash
- 100.13%
- DSCR
- 5.46
- GRM
- 2.1
CMA / ARV
- ARV (on-the-fly)
- $115,128
- Comps found
- 8
Show comp detail 8 sales within ~0.75 mi
| Address | Dist | Beds/Ba | Sqft | Sold | Price | $/sf | Match |
|---|---|---|---|---|---|---|---|
| 402 E South St | 0.14mi | 4/2.0 | 2,074 (-3%) | 5mo | $92,000 | $44 | 80 |
| 673 Sumner St | 0.35mi | 4/2.0 | 1,882 (-12%) | 1mo | $129,900 | $69 | 59 |
| 656 Kling St | 0.24mi | 5/2.0 (+1) | 2,251 (+6%) | 16mo | $156,500 | $70 | 57 |
| 876 Kling St | 0.22mi | 4/2.0 | 1,874 (-12%) | 19mo | $129,900 | $69 | 50 |
| 182-184 E Voris St | 0.53mi | 4/2.0 | 2,231 (+5%) | 19mo | $94,000 | $42 | 48 |
| 393 Spicer St | 0.66mi | 4/2.0 | 2,448 (+15%) | 3mo | $125,000 | $51 | 38 |
| 398 Margaret St | 0.64mi | 3/2.0 (-1) | 1,820 (-15%) | 4mo | $98,000 | $54 | 33 |
| 668 Corley St | 0.68mi | 3/3.0 (-1) | 1,836 (-14%) | 16mo | $95,000 | $52 | 27 |
Match score weights: distance 35% · size 25% · config 20% · recency 20%. Top-matched comps best support the ARV.
Projected returns pro-forma
-3.0% appreciation · 3.0% rent growth · sell at horizon
- IRR
- —
- Equity multiple
- 5.74×
- Total profit
- $72,324
- Equity at exit
- $8,126
- IRR
- —
- Equity multiple
- 11.99×
- Total profit
- $167,640
- Equity at exit
- $4,712
Cash invested: $15,260 (down + closing). Projections, not guarantees.
Landlord ↔ Tenant lean methodology
- Overall (STATE)
- 73 Landlord-Friendly
- State Ohio
- 73 Landlord-Friendly · R+6
- County
- — inherits STATE
- City
- — inherits STATE
ZIP-level market 44311
- Home prices YoY
- -28.4%
- Active inventory
- 54
- Price-to-rent
- 4.2×
Monthly cashflow live
- Estimated rent
- $2,142 high interval (Pro) →
- Mortgage (P&I)
- −$286
- Tax from tax record
- −$110 /mo · $1,324/yr
- Insurance
- −$23
- HOA
- −$0
- Vacancy / Maint / Mgmt
- −$450
- Net cashflow
- $1,273
Break-even live
2-unit breakdown (identical units grouped — click to expand)
| Units | Beds | Baths | Est. rent |
|---|---|---|---|
| 2× units | 2 | 1.5 | $2,142 |
| #1 | 2 | 1.5 | $1,071 |
| #2 | 2 | 1.5 | $1,071 |
| Total (2 units) | $2,142 | ||
UW: 25.0% down · 7.5% · 30yr · 1.5% tax · 5.0% vac · 8.0% maint · 8.0% mgmt
Financing live
Cash to close
- Down payment
- $13,625
- Closing costs
- $1,635
- Reserves months
- —
- Total cash needed
- —
Loan-product check · same deal, 3 products live
Conventional
25% down · 7.5% · 30yr
- Down + closing
- —
- Monthly P&I
- —
- Monthly cashflow
- —
- DSCR
- —
- Eligible?
- —
Personal DTI + credit; lowest rate.
DSCR
20% down · 8.5% · 30yr
- Down + closing
- —
- Monthly P&I
- —
- Monthly cashflow
- —
- DSCR
- —
- Eligible?
- —
No personal income docs; deal must DSCR.
Hard money
10% down · 12.0% · 12mo
- Down + closing
- —
- Monthly P&I
- —
- Monthly cashflow
- —
- DSCR
- —
- Eligible?
- —
Short-term bridge; refi at stabilization.
Rent comps 25 comps
| Address | Beds | Baths | Sqft | Rent | $/sqft | DOM | Units | Dist |
|---|---|---|---|---|---|---|---|---|
| 768 Beardsley St Akron, OH | 5.0 | 1.5 | 1714 | $1,500 | $0.88 | 14d | 1 | 0.15mi |
| 548 Spicer St Akron, OH | 4.0 | 2.0 | 1487 | $1,100 | $0.74 | 23d | 1 | 0.38mi |
| 1012 Brown St Akron, OH | 4.0 | 2.0 | 1518 | $1,295 | $0.85 | 44d | 1 | 0.47mi |
| 1028 Kling St Akron, OH | 4.0 | 2.0 | 1500 | $1,450 | $0.97 | 44d | 1 | 0.51mi |
| 288 Cross St Akron, OH | 4.0 | 2.0 | 1512 | $1,295 | $0.86 | 44d | 1 | 0.54mi |
| 450 Stanton Ave Akron, OH | 3.0 | 2.0 | 1927 | $1,425 | $0.74 | 44d | 1 | 0.60mi |
| 435 Margaret St Akron, OH | 4.0 | 2.0 | 1900 | $1,450 | $0.76 | 44d | 1 | 0.61mi |
| 1040 Neptune Ave Akron, OH | 4.0 | 1.0 | 1400 | $1,300 | $0.93 | 44d | 1 | 0.63mi |
| 497 Sumner St Akron, OH | 5.0 | 2.0 | 1776 | $1,295 | $0.73 | 44d | 1 | 0.64mi |
| 466 Adkins Ave Akron, OH | 4.0 | 1.5 | 1800 | $1,450 | $0.81 | 44d | 1 | 0.65mi |
| 1200 Girard St Akron, OH | 3.0 | 2.0 | 1438 | $1,100 | $0.76 | 14d | 1 | 0.85mi |
| 516 Whitney Ave Akron, OH | 4.0 | 2.0 | 1676 | $1,500 | $0.89 | 44d | 1 | 0.88mi |
| 1368 Moore St Akron, OH | 4.0 | 1.0 | 1575 | $1,300 | $0.83 | 44d | 1 | 1.04mi |
| 1076 Ackley St Akron, OH | 4.0 | 2.0 | 1998 | $2,000 | $1.00 | 14d | 1 | 1.05mi |
| 373 N Firestone Blvd Akron, OH | 4.0 | 1.5 | 1590 | $1,550 | $0.97 | 44d | 1 | 1.13mi |
| 432 N Firestone Blvd Unit 1496097P Akron, OH | 4.0 | 2.0 | 1926 | $6,253 | $3.25 | 21d | 1 | 1.15mi |
| 22 E Exchange St Apt 310 Akron, OH | 3.0 | 3.0 | 1496 | $1,962 | $1.31 | 44d | 1 | 1.16mi |
| 497 Lucy St Akron, OH | 4.0 | 1.0 | 1600 | $1,500 | $0.94 | 44d | 1 | 1.18mi |
| 78 E Mapledale Ave Akron, OH | 4.0 | 1.5 | 1600 | $1,500 | $0.94 | 14d | 1 | 1.30mi |
| 783 Boulevard St Akron, OH | 4.0 | 1.0 | 1440 | $999 | $0.69 | 23d | 1 | 1.35mi |
| 177 Kent Ct Akron, OH | 3.0 | 1.0 | 2613 | $1,150 | $0.44 | 23d | 1 | 1.40mi |
| 846 Lee Dr Akron, OH | 4.0 | 1.0 | 1433 | $1,325 | $0.92 | 14d | 1 | 1.43mi |
| 846 Lee Dr Akron, OH | 4.0 | 1.5 | 1433 | $1,325 | $0.92 | 23d | 1 | 1.43mi |
| 1070 Super Genius Cir Akron, OH | 2.0–4.0 | 1.0–2.0 | 1145 | $1,429 | $1.25 | 14d | 1 | 1.46mi |
| 156 S Main St Akron, OH | 2.0–3.0 | 2.0 | 1197 | $2,985 | $2.49 | 23d | 4 | 1.47mi |
Listing history 11 events
-
2026-06-18days on market $54,500 Active 13 DOM
-
2026-06-17days on market $54,500 Active 12 DOM
-
2026-06-16days on market $54,500 Active 11 DOM
-
2026-06-15days on market $54,500 Active 10 DOM
-
2026-06-14days on market $54,500 Active 8 DOM
-
2026-06-13days on market $54,500 Active 7 DOM
-
2026-06-10days on market $54,500 Active 5 DOM
-
2026-06-09days on market $54,500 Active 4 DOM
-
2026-06-08days on market $54,500 Active 3 DOM
-
2026-06-07remarks 583-char remark
-
2026-06-07$54,500 Active 2 DOM
ⓘ Source: listings_history table (triggers on properties + properties_extension) + one-shot
backfill from property_details.listing_events for pre-trigger history.
Tax reassessment forecast OH · Partial reset (capped growth)
- Current annual tax
- $1,324 · $110/mo
- Projected year-2 tax
- $1,324 · $110/mo
- Expected delta
- $0/yr ($0/mo · 0.0%)
ⓘ Screening estimate from a state-policy table — verify with the county assessor before closing.
Climate risk First Street
- Flood 1/10 Low FEMA zone X (unshaded) · 0% chance over 30 yrs
- Wildfire 1/10 Low
- Heat 3/10 Moderate 7 d/yr ≥96°F today · 17 d/yr by 30 yrs out
- Wind 1/10 Low
- Air quality 3/10 Moderate 2 unhealthy d/yr today · 4 by 30 yrs out
Nearby sold comps map
Loading sold comps map…
Walkable amenities ~0.75 mi
Loading nearby amenities…
Taxation est. · year 1
- Rental income
- $25,704
- − Mortgage interest
- −$3,053
- − Property taxes
- −$1,324
- − Insurance
- −$272
- − Repairs & maintenance
- −$2,056
- − Management
- −$2,056
- − Depreciation
- −$1,585
- Taxable income
- $15,356
- Est. tax owed @ 24.0%
- −$3,685
- After-tax cash flow
- $11,594/yr
For passive investors: Depreciation is non-cash, so a rental often shows a tax loss while cash-flowing — sheltering income. Rental losses are passive: they offset passive income freely, and up to $25,000/yr can offset ordinary (W-2) income if you actively participate and your MAGI is under $100k (phasing out to $0 by $150k); unused losses carry forward. On sale, claimed depreciation is recaptured at up to 25%, and gains may owe capital-gains tax (a 1031 exchange can defer both). Figures are a year-1 estimate at your 24.0% rate — not tax advice; consult a CPA.
Schools (NCES district)
- District
- Akron City
- NCES district ID
- 3904348
- Math proficiency
- 22% ▼ -17.00%
- Reading proficiency
- 30% ▼ -12.00%
- Median HH income
- $33,811
- Composite
- 21.31/100
- National rank
- #8383
- State rank
- #602 of 656 in OH
Livability — Akron
- Score
- 81/100
- State rank
- #104
- US rank
- #1591
Category grades
Schools grade is shown separately in the Schools card above.
Census & demographics
- Census place
- Akron, OH
- County
- Summit County · 440,783 people
- City population
- 174,375
- Metro
- Akron, OH
- Population (ZIP)
- 7,547
- Household income
- $24,369
- Rent vs Own
- Severe rent burden
- 659.0
Population outlook (Summit County) Hauer SSP2
- Today (2025)
- 546,583 people
- By 2030
- 544,028 · -0.5%
- By 2040
- 531,363 · -2.8%
- By 2050
- 514,923 · -5.8%
- By 2075
- 481,765 · -11.9%
- By 2100
- 432,265 · -20.9%
Race, ethnicity, and origin ACS 2023
- Neighborhood character
- Diverse neighborhood (Simpson 0.60)
- Race & ethnicity
- White 53% Black 35% Two or more races 6% Hispanic / Latino 4% Asian 3%
- Common ancestry
- Lithuanian 2% Romanian 2% Slovak 2%
- Foreign-born
- 3% · Canada, Vietnam, Philippines
- Languages at home
- 95% English-only · Spanish 2% Other Asian/Pacific 1% Other Indo-European 1%
Political lean MEDSL · Summit
- 2024 margin
- Lean D (+7.0) · D 53.0% · R 46.0%
- 2008→2024 swing
- -9.6pp toward R · 2008: 16.6pp · 2024: 7.0pp
- All cycles
- 2024: D+7.0 2020: D+9.6 2016: D+8.2 2012: D+14.8 2008: D+16.6
Not yet ingested
- Civics
- —
Market trends
- HPI YoY
- ▼ -39.01%
- Current HPI
- 98.3809
- Rent YoY
- —
- Metro
- Akron, OH
- State GDP YoY
- ▲ 1.98%
- F500 in state
- 48
Industry mix (Fortune 500 HQ in OH)
| Industry | F500 HQs | Revenue |
|---|---|---|
| Insurance | 3 | $145B |
|
||
| Industrial Machinery | 3 | $49B |
|
||
| Financial Services | 3 | $24B |
|
||
| Consumer Goods | 2 | $93B |
|
||
| Aerospace / Defense | 2 | $47B |
|
||
| Utilities | 2 | $33B |
|
||
Price history
+31.0% since first listed25 events — show timeline
- 2026-06-05 Listed $54,500 MLSNOW
- 2026-04-24 Listing Removed — MLSNOW
- 2026-02-12 Listed $59,500 MLSNOW
- 2025-03-19 Sold (MLS) $36,000 MLSNOW
- 2025-03-04 Pending — MLSNOW
- 2025-02-26 Contingent — MLSNOW
- 2025-02-03 Price Changed $42,000 MLSNOW
- 2025-01-29 Price Changed $43,000 MLSNOW
- 2025-01-14 Price Changed $45,000 MLSNOW
- 2025-01-03 Sold (Public Records) $25,000 Public Records
- 2024-12-29 Listed $49,000 MLSNOW
- 2024-12-23 Listing Removed — MLSNOW
- 2024-12-21 Relisted — MLSNOW
- 2024-11-12 Pending — MLSNOW
- 2024-10-24 Relisted — MLSNOW
- 2024-10-15 Pending — MLSNOW
- 2024-10-10 Price Changed $55,000 MLSNOW
- 2024-09-23 Listed $85,000 MLSNOW
- 2024-06-13 Sold (MLS) $25,000 MLSNOW
- 2024-05-23 Pending — MLSNOW
- 2024-05-22 Listing Removed — MLSNOW
- 2024-04-23 Price Changed $27,500 MLSNOW
- 2024-03-22 Price Changed $32,500 MLSNOW
- 2024-02-19 Price Changed $37,500 MLSNOW
- 2024-01-11 Listed $41,600 MLSNOW
Property tax history
-0.8%/yrLatest (2025): $1,324 · +0.1% YoY. Source: county tax records.
Cash-flow waterfall
monthlySold comps — $/sqft
last 12 mo · ≤1 miLoading sold comps…