1086 Cedar St · Milan, TN
Flood risk 1/10 · Minimal
- FEMA flood zone
- X (unshaded)
- Chance of flooding over 30 yrs
- 0.0%
- Est. flood insurance / yr
- $507 – $1,088
Fire risk 3/10 · Minor
- Est. fire insurance / yr
- $949 – $1,763
Heat risk 6/10 · Moderate
- Hot days now (above 109°F)
- 7 days/yr
- Hot days in 30 yrs
- 20 days/yr
Wind risk 4/10 · Minor
- Chance of severe wind over 30 yrs
- 13.0%
Air-quality risk 2/10 · Minimal
- Unhealthy air days now
- 0 days/yr
- Unhealthy air days in 30 yrs
- 1 days/yr
Risk factors via First Street. Map © Google.
Why this score? — see what drove the B- grade
The composite is a weighted blend of 9 inputs, each scored 0–100. Each bar is that input's sub-score; the figure is the points it added to the 100-point composite (weight × sub-score).
- Cash flow +30.0/30.0
- 1% rule +10.0/10.0
- DSCR +10.0/10.0
- ARV discount +7.5/15.0
- Livability +3.4/5.0
- Schools +2.6/10.0
- Rent growth +2.5/5.0
- Condition / age +2.5/5.0
- Appreciation +0.0/10.0
$64,900
🖨 Deal sheet 📄 Offer letter ✓ Due diligence
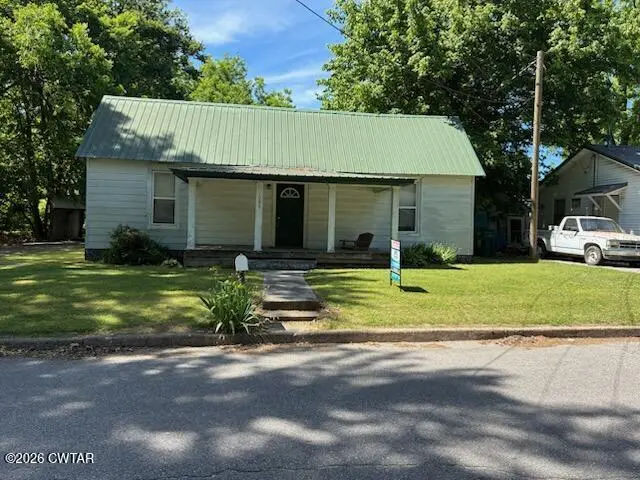
Listing remarks
Check out this 3BR, 1BA, near downtown Milan in a quiet neighborhood where everyone looks out for each other. Property has great potential. Metal roof, Central heat and air. Selling "As Is", Please bring all serious offers. Contact your local agent for your private showing today. Check out this 3BR, 1BA, near downtown Milan in a quiet neighborhood where everyone looks out for each other. Property has great potential. Metal roof, Central heat and air. Selling "As Is", Please bring all serious offers. Contact your local agent or Jeff @ [email protected] or 731-613-4675
Key facts
- Metal roof
- Central heat and air
- Quiet neighborhood
Tags
Property features AI
Exterior
- Parking: Total 2 parking spaces; 1 carport space; Open parking (2 spaces)
- Utilities: Public water; Public sewer; 200+ amp electrical service with 220V (including 220V in kitchen and laundry), circuit breakers; Natural gas available and connected; Cable available; Phone available; Water, sewer and electricity connected
- Home design: Single-family residence; One story
- Construction: Metal roof; Pillar/post/pier foundation; Residential construction
- Exterior features: Front porch; Level lot; Shed(s)
Interior
- Kitchen: Electric water heater
- Bedrooms: 3 main-level bedrooms
- Flooring: Hardwood
- Bathrooms: 1 full bathroom (main level)
- Heating & cooling: Central heating (forced air); Central air conditioning; Ceiling fans
- Interior features: Ceiling fans; Walk-in closets; Gas log ventless fireplace
- Laundry & utility: Laundry room with washer and dryer hookups (electric dryer hookup)
Neighborhood map
What this means for you Summary
Snapshot
- This is a 3-bed/1.0-bath single-family listed at $65k.
Deal economics
- At list price, monthly cash flow is $453 ($5k/yr) — positive.
- The deal already cash-flows at list — no discount required.
- Meets the 1% rule at list price ($1k rent vs $65k).
- Recommended offer: $63k (3.0% below list) — sets the bar for market timing.
Location & tenants
- Location reads 68/100 on livability (#78 in TN) — a middle-class / working-renter tenant base. Strengths: cost of living A+, health & safety A+, housing A; Watch: schools D-, crime F, amenities F.
- Milan (rural): math 36% / reading 26% proficiency, ranked #55 of 139 in TN (top 40%) — families likely to look elsewhere, expect single-tenant / working-renter base with shorter leases.
- Market conditions: 81 active listings in the ZIP; 155 units permitted in Gibson County in 2024 (0 in 5+ unit buildings).
Forward outlook
- Local home prices are declining (-3.0%/yr); year-one equity from $449 of loan paydown is wiped out by about $2k of value loss. Plan a longer hold.
- Gibson County population projected to shrink 8% by 2050 — rents likely to lag national; underwrite the cash flow, not the appreciation.
- At projected returns (-3.0% appreciation + 3.0% rent growth), your $18k cash investment doubles in ~5 years — after that, you're playing with house money.
Negotiation context
- It's been on market 31 days — a 3% lower offer ($63k) is reasonable based on typical stale-listing flexibility.
- Current owner paid $9k; list at $65k implies a 625% gain — meaningful room to come down on a strong offer.
Risks & watch-outs
- Watch-outs: built in 1914 — expect roof / HVAC / electrical / plumbing capex.
- Climate carrying-cost: extreme-heat days projected 7→20/yr by 2055 (HVAC capex compounding) — expect insurance premiums to compound above CPI over the hold.
Questions for the listing agent
- It's been on market 31 days. Have you received any prior offers? Is the seller open to a 3% concession, seller financing, or rate buy-down credit?
- Built in 1914 — when were the roof, HVAC, electrical panel, plumbing, and water heater last replaced?
- Is there a deadline driving the sale (1031 exchange, divorce, estate, relocation)? That informs how much negotiation room exists.
- Schools are D-rated, which usually means shorter tenancies and higher turnover. Who's the typical renter profile here, and what's been the actual vacancy rate?
- Crime grade is F in this area — have there been break-ins, vandalism, or insurance claims at this property in the last 3 years? What carrier currently insures it and at what premium?
- What's the average days-on-market for RENTAL listings here right now (not sales)? A rising rental-DOM trend means longer vacancies and softer asking-rent achievability than the comps imply.
- What's the recent tenant-quality profile in this submarket — average credit score on applications, eviction rate, late-payment / NSF rate, and stable-employment percentage? A property-management company in the area should have these aggregated.
- How much new for-sale + rental construction is in the pipeline within 1–3 miles? Heavy new supply typically softens prices + rents 12–24 months out; constrained supply supports both.
Investment metrics
- 1% rule
- 1.71% ✓
- Cap rate
- 14.67%
- Cash-on-cash
- 29.93%
- DSCR
- 2.33
- GRM
- 4.9
CMA / ARV
No comps found within radius.
Projected returns pro-forma
-3.0% appreciation · 3.0% rent growth · sell at horizon
- IRR
- 24.5%
- Equity multiple
- 2.01×
- Total profit
- $18,350
- Equity at exit
- $9,677
- IRR
- 32.3%
- Equity multiple
- 3.92×
- Total profit
- $53,149
- Equity at exit
- $5,611
Cash invested: $18,172 (down + closing). Projections, not guarantees.
Landlord ↔ Tenant lean methodology
- Overall (STATE)
- 87 Strongly Landlord-Friendly
- State Tennessee
- 87 Strongly Landlord-Friendly · R+13
- County
- — inherits STATE
- City
- — inherits STATE
ZIP-level market 38358
- Home prices YoY
- -24.4%
- Active inventory
- 81
- Price-to-rent
- 4.9×
Monthly cashflow live
- Estimated rent
- $1,107 medium interval (Pro) →
- Mortgage (P&I)
- −$340
- Tax from tax record
- −$54 /mo · $644/yr
- Insurance
- −$27
- HOA
- −$0
- Vacancy / Maint / Mgmt
- −$232
- Net cashflow
- $453
Break-even live
UW: 25.0% down · 7.5% · 30yr · 1.5% tax · 5.0% vac · 8.0% maint · 8.0% mgmt
Financing live
Cash to close
- Down payment
- $16,225
- Closing costs
- $1,947
- Reserves months
- —
- Total cash needed
- —
Loan-product check · same deal, 3 products live
Conventional
25% down · 7.5% · 30yr
- Down + closing
- —
- Monthly P&I
- —
- Monthly cashflow
- —
- DSCR
- —
- Eligible?
- —
Personal DTI + credit; lowest rate.
DSCR
20% down · 8.5% · 30yr
- Down + closing
- —
- Monthly P&I
- —
- Monthly cashflow
- —
- DSCR
- —
- Eligible?
- —
No personal income docs; deal must DSCR.
Hard money
10% down · 12.0% · 12mo
- Down + closing
- —
- Monthly P&I
- —
- Monthly cashflow
- —
- DSCR
- —
- Eligible?
- —
Short-term bridge; refi at stabilization.
Listing history 15 events
-
2026-06-17status $64,900 Pending 31 DOM
-
2026-06-16days on market $64,900 Active 31 DOM
-
2026-06-15days on market $64,900 Active 30 DOM
-
2026-06-13days on market $64,900 Active 28 DOM
-
2026-06-12days on market $64,900 Active 27 DOM
-
2026-06-09days on market $64,900 Active 24 DOM
-
2026-06-08days on market $64,900 Active 23 DOM
-
2026-06-08days on market $64,900 Active 22 DOM
-
2026-06-07days on market $64,900 Active 21 DOM
-
2026-06-03days on market $64,900 Active 18 DOM
-
2026-06-02days on market $64,900 Active 17 DOM
-
2026-06-01days on market $64,900 Active 16 DOM
-
2026-05-31days on market $64,900 Active 15 DOM
-
2026-05-15$74,500 Active
-
2003-06-25soldstatus $8,950
ⓘ Source: listings_history table (triggers on properties + properties_extension) + one-shot
backfill from property_details.listing_events for pre-trigger history.
Tax reassessment forecast TN · Resets to sale price
- Current annual tax
- $644 · $54/mo
- Projected year-2 tax
- $644 · $54/mo
- Expected delta
- $0/yr ($0/mo · 0.0%)
ⓘ Screening estimate from a state-policy table — verify with the county assessor before closing.
Climate risk First Street
- Flood 1/10 Low FEMA zone X (unshaded) · 0% chance over 30 yrs
- Wildfire 3/10 Moderate
- Heat 6/10 Major 7 d/yr ≥109°F today · 20 d/yr by 30 yrs out
- Wind 4/10 Moderate 13% chance of damaging wind over 30 yrs
- Air quality 2/10 Low 0 unhealthy d/yr today · 1 by 30 yrs out
Nearby sold comps map
Loading sold comps map…
Walkable amenities ~0.75 mi
Loading nearby amenities…
Taxation est. · year 1
- Rental income
- $13,280
- − Mortgage interest
- −$3,635
- − Property taxes
- −$644
- − Insurance
- −$324
- − Repairs & maintenance
- −$1,062
- − Management
- −$1,062
- − Depreciation
- −$1,888
- Taxable income
- $4,664
- Est. tax owed @ 24.0%
- −$1,119
- After-tax cash flow
- $4,320/yr
For passive investors: Depreciation is non-cash, so a rental often shows a tax loss while cash-flowing — sheltering income. Rental losses are passive: they offset passive income freely, and up to $25,000/yr can offset ordinary (W-2) income if you actively participate and your MAGI is under $100k (phasing out to $0 by $150k); unused losses carry forward. On sale, claimed depreciation is recaptured at up to 25%, and gains may owe capital-gains tax (a 1031 exchange can defer both). Figures are a year-1 estimate at your 24.0% rate — not tax advice; consult a CPA.
Schools (NCES district)
- District
- Milan
- NCES district ID
- 4702970
- Math proficiency
- 36% ▼ -16.00%
- Reading proficiency
- 26% ▼ -11.00%
- Median HH income
- $36,434
- Composite
- 25.79/100
- National rank
- #7365
- State rank
- #55 of 139 in TN
Livability — Milan
- Score
- 68/100
- State rank
- #78
- US rank
- #9084
Category grades
Schools grade is shown separately in the Schools card above.
Census & demographics
- Census place
- Milan, TN
- City population
- 12,511
- Population (ZIP)
- 12,511
Population outlook (Gibson County) Hauer SSP2
- Today (2025)
- 48,793 people
- By 2030
- 48,221 · -1.2%
- By 2040
- 46,793 · -4.1%
- By 2050
- 44,909 · -8.0%
- By 2075
- 40,191 · -17.6%
- By 2100
- 33,574 · -31.2%
Race, ethnicity, and origin ACS 2023
- Neighborhood character
- Predominantly White (74%)
- Race & ethnicity
- White 74% Black 17% Two or more races 7% Hispanic / Latino 2%
- Common ancestry
- Slovak 3% Iranian 2% Romanian 2%
- Foreign-born
- 2% · Canada
Political lean MEDSL · Gibson
- 2024 margin
- Solid R (+52.0) · D 23.6% · R 75.5%
- 2008→2024 swing
- -23.2pp toward R · 2008: -28.8pp · 2024: -52.0pp
- All cycles
- 2024: R+52.0 2020: R+47.0 2016: R+43.8 2012: R+32.1 2008: R+28.8
Not yet ingested
- Civics
- —
Market trends
- HPI YoY
- ▼ -67.28%
- Current HPI
- 208.8671
- Rent YoY
- —
- Metro
- —
- State GDP YoY
- ▲ 2.78%
- F500 in state
- 22
Industry mix (Fortune 500 HQ in TN)
| Industry | F500 HQs | Revenue |
|---|---|---|
| Healthcare | 3 | $91B |
|
||
| Retail | 3 | $72B |
|
||
| Transportation / Logistics | 1 | $88B |
|
||
| Paper / Packaging | 1 | $19B |
|
||
| Insurance | 1 | $13B |
|
||
| Energy | 1 | $12B |
|
||
Price history
+732.4% since first listed2 events — show timeline
- 2026-05-15 Listed $74,500 CWTAR
- 2003-06-25 Sold (Public Records) $8,950 Public Records
Property tax history
+3.7%/yrLatest (2025): $644 · +186.2% YoY. Source: county tax records.
Cash-flow waterfall
monthlySold comps — $/sqft
last 12 mo · ≤1 miLoading sold comps…