1609 Meadowbrook Ave · Youngstown, OH
Flood risk 1/10 · Minimal
- FEMA flood zone
- X (unshaded)
- Chance of flooding over 30 yrs
- 0.0%
- Est. flood insurance / yr
- $473 – $860
Fire risk 1/10 · Minimal
- Est. fire insurance / yr
- $713 – $1,323
Heat risk 3/10 · Minor
- Hot days now (above 97°F)
- 7 days/yr
- Hot days in 30 yrs
- 17 days/yr
Wind risk 1/10 · Minimal
- Chance of severe wind over 30 yrs
- —
Air-quality risk 3/10 · Minor
- Unhealthy air days now
- 1 days/yr
- Unhealthy air days in 30 yrs
- 4 days/yr
Risk factors via First Street. Map © Google.
Why this score? — see what drove the B grade
The composite is a weighted blend of 9 inputs, each scored 0–100. Each bar is that input's sub-score; the figure is the points it added to the 100-point composite (weight × sub-score).
- Cash flow +28.7/30.0
- ARV discount +15.0/15.0
- DSCR +10.0/10.0
- 1% rule +7.3/10.0
- Livability +4.0/5.0
- Rent growth +2.5/5.0
- Condition / age +2.5/5.0
- Schools +0.9/10.0
- Appreciation +0.0/10.0
$110,000
🖨 Deal sheet (PDF) 📄 Offer letter ✓ Due diligence
Listing remarks MLS
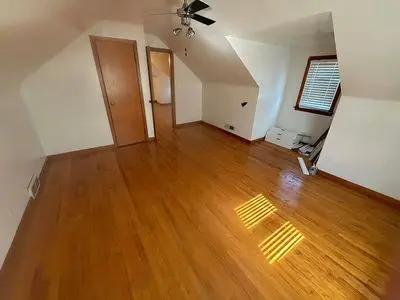
This adorable home has so much to offer. It begins with a front porch and very nice landscaping. The kitchen has an eat in space that has a skylight and sliding glass doors that leads out onto a deck. The floor in the kitchen is a wood laminate. The living room is spacious, and then leads down a hall where there is 2 bedrooms on the first floor with a full bathroom. The upstairs is very spacious, and It can be a bedroom and an office or just a very big bedroom. The basement is partially finished that includes a bar that is staying. There is a separate laundry room and a full bathroom downstairs also. There is also a detached 2 car garage.
Key facts
- Front porch
- Sliding glass doors
- Eat in space
Tags
Property features AI
Exterior
- Home design: Single-family home built in 1951; One-story layout
- Construction: Built in 1951
- Exterior features: Located in the Brownlee Woods subdivision
Interior
- Bedrooms: Bedrooms: 3
- Bathrooms: Bathrooms: 1
- Interior features: Brick and traditional interior finishes
Neighborhood map
What this means for you Summary
Snapshot
- This is a 3-bed/1.0-bath single-family listed at $110k.
Deal economics
- At list price, monthly cash flow is $364 ($4k/yr) — positive.
- The deal already cash-flows at list — no discount required.
- Meets the 1% rule at list price ($1k rent vs $110k).
- Recommended offer: $108k (1.5% below list) — sets the bar for market timing.
- Cap rate 10.3% vs local median 6.9% in Youngstown — top-decile yield for the area; either an underpriced asset or a hidden risk that comps aren't pricing in. Stress-test before assuming the spread holds.
Location & tenants
- Location reads 81/100 on livability (#99 in OH, #1,506 nationally) — a professional / high-income tenant draw. Strengths: amenities A+, commute A+, cost of living A+; Watch: crime F, employment F.
- Youngstown City (urban): math 8% / reading 17% proficiency, ranked #649 of 656 in OH (top 99%) — low school quality limits family demand, transient renter base, plan for 1-2y turnover; 88% free/reduced lunch — lower-income household profile, screen leases tightly.
- Market conditions: 155 active listings in the ZIP; 10 comparable units currently listed for rent nearby; rentals lingering (median 45d on market — plan ~5-8 weeks vacancy on turnover, expect pricing pressure); 60% of comp listings sitting > 30 days — soft ceiling on asking rent; solid renter incomes; 147 units permitted in Mahoning County in 2024 (0 in 5+ unit buildings).
Forward outlook
- Local home prices are declining (-3.0%/yr); year-one equity from $761 of loan paydown is wiped out by about $3k of value loss. Plan a longer hold.
- Mahoning County population projected at -14% by 2050 — secular population decline; favor cash flow + early exit over multi-decade hold.
- At projected returns (-3.0% appreciation + 3.0% rent growth), your $31k cash investment doubles in ~9 years — after that, you're playing with house money.
Negotiation context
- It's been on market 18 days — a 2% lower offer ($108k) is reasonable based on typical stale-listing flexibility.
- 3 sale attempts since 9y ago with the ask held roughly flat each time — persistent listings suggest the price (not the market) is what's stuck; bring a comps-based counter.
- Current owner paid $80k; 38% above their basis — modest negotiation headroom, anchor on the comps not their cost.
Risks & watch-outs
- Watch-outs: built in 1951 — expect roof / HVAC / electrical / plumbing capex.
Questions for the listing agent
- Built in 1951 — when were the roof, HVAC, electrical panel, plumbing, and water heater last replaced?
- Is there a deadline driving the sale (1031 exchange, divorce, estate, relocation)? That informs how much negotiation room exists.
- Crime grade is F in this area — have there been break-ins, vandalism, or insurance claims at this property in the last 3 years? What carrier currently insures it and at what premium?
- What's the average days-on-market for RENTAL listings here right now (not sales)? A rising rental-DOM trend means longer vacancies and softer asking-rent achievability than the comps imply.
- What's the recent tenant-quality profile in this submarket — average credit score on applications, eviction rate, late-payment / NSF rate, and stable-employment percentage? A property-management company in the area should have these aggregated.
- How much new for-sale + rental construction is in the pipeline within 1–3 miles? Heavy new supply typically softens prices + rents 12–24 months out; constrained supply supports both.
Investment metrics
- 1% rule
- 1.23% ✓
- Cap rate
- 10.27%
- Cash-on-cash
- 14.20%
- DSCR
- 1.63
- GRM
- 6.8
CMA / ARV
- ARV (on-the-fly)
- $134,640
- Comps found
- 12
Show comp detail 12 sales within ~0.75 mi
| Address | Dist | Beds/Ba | Sqft | Sold | Price | $/sf | Match |
|---|---|---|---|---|---|---|---|
| 1925 Weston Ave | 0.42mi | 3/1.0 | 1,227 (+0%) | 1mo | $89,000 | $73 | 79 |
| 1562 Medford Ave | 0.30mi | 3/1.0 | 1,170 (-4%) | 3mo | $129,156 | $110 | 76 |
| 1633 Everett Ave | 0.40mi | 3/1.0 | 1,202 (-2%) | 5mo | $125,000 | $104 | 74 |
| 1646 Everett Ave | 0.43mi | 4/1.0 (+1) | 1,152 (-6%) | 3mo | $100,000 | $87 | 62 |
| 1913 Country Club Ave | 0.37mi | 3/2.0 | 1,092 (-11%) | 0mo | $78,000 | $71 | 61 |
| 2016 Pointview Ave | 0.74mi | 3/1.0 | 1,232 (+1%) | 5mo | $34,000 | $28 | 60 |
| 1928 Palo Verde Dr | 0.40mi | 3/1.0 | 1,074 (-12%) | 3mo | $130,000 | $121 | 58 |
| 2002 Bancroft Ave | 0.38mi | 3/2.0 | 1,080 (-12%) | 4mo | $131,500 | $122 | 55 |
| 1720 Sequoya Dr | 0.35mi | 3/2.0 | 1,044 (-15%) | 4mo | $168,000 | $161 | 52 |
| 587 Edison St | 0.74mi | 2/2.0 (-1) | 1,163 (-5%) | 2mo | $160,000 | $138 | 47 |
| 612 Maplewood Ave | 0.61mi | 3/1.0 | 1,056 (-14%) | 3mo | $135,000 | $128 | 47 |
| 3551 Shirley Rd | 0.72mi | 3/2.0 | 1,341 (+10%) | 2mo | $142,000 | $106 | 44 |
Match score weights: distance 35% · size 25% · config 20% · recency 20%. Top-matched comps best support the ARV.
Projected returns pro-forma
-3.0% appreciation · 3.0% rent growth · sell at horizon
- IRR
- 4.5%
- Equity multiple
- 1.17×
- Total profit
- $5,377
- Equity at exit
- $16,401
- IRR
- 14.0%
- Equity multiple
- 2.12×
- Total profit
- $34,524
- Equity at exit
- $9,511
Cash invested: $30,800 (down + closing). Projections, not guarantees.
Landlord ↔ Tenant lean methodology
- Overall (STATE)
- 73 Landlord-Friendly
- State Ohio
- 73 Landlord-Friendly · R+6
- County
- — inherits STATE
- City
- — inherits STATE
ZIP-level market 44514
- Home prices YoY
- -23.8%
- Active inventory
- 155
- Price-to-rent
- 6.8×
Monthly cashflow live
- Estimated rent
- $1,356 high interval (Pro) →
- Mortgage (P&I)
- −$577
- Tax from tax record
- −$84 /mo · $1,013/yr
- Insurance
- −$46
- HOA
- −$0
- Vacancy / Maint / Mgmt
- −$285
- Net cashflow
- $364
Break-even live
Sensitivity live
| Price | -10% $427 | -5% $396 | +0% $364 | +5% $333 | +10% $302 |
|---|---|---|---|---|---|
| Rent | -10% $257 | -5% $311 | +0% $364 | +5% $418 | +10% $472 |
| Rate | -1.0pp $420 | -0.5pp $392 | base $364 | +0.5pp $336 | +1.0pp $307 |
UW: 25.0% down · 7.5% · 30yr · 1.5% tax · 5.0% vac · 8.0% maint · 8.0% mgmt
Financing live
Cash to close
- Down payment
- $27,500
- Closing costs
- $3,300
- Reserves months
- —
- Total cash needed
- —
Loan-product check · same deal, 3 products live
Conventional
25% down · 7.5% · 30yr
- Down + closing
- —
- Monthly P&I
- —
- Monthly cashflow
- —
- DSCR
- —
- Eligible?
- —
Personal DTI + credit; lowest rate.
DSCR
20% down · 8.5% · 30yr
- Down + closing
- —
- Monthly P&I
- —
- Monthly cashflow
- —
- DSCR
- —
- Eligible?
- —
No personal income docs; deal must DSCR.
Hard money
10% down · 12.0% · 12mo
- Down + closing
- —
- Monthly P&I
- —
- Monthly cashflow
- —
- DSCR
- —
- Eligible?
- —
Short-term bridge; refi at stabilization.
Rent comps 10 comps
| Address | Beds | Baths | Sqft | Rent | $/sqft | DOM | Units | Dist |
|---|---|---|---|---|---|---|---|---|
| 1914 S Heights Ave Youngstown, OH | 3.0 | 1.0 | 1115 | $1,950 | $1.75 | 45d | 1 | 0.60mi |
| 1803 Pointview Ave Youngstown, OH | 2.0 | 1.0 | 950 | $1,000 | $1.05 | 45d | 1 | 0.60mi |
| 610 Elm St Struthers, OH | 3.0 | 1.0 | 1050 | $1,500 | $1.43 | 15d | 1 | 0.63mi |
| 3446 Ambert Ave Youngstown, OH | 4.0 | 1.0 | 1100 | $1,250 | $1.14 | 15d | 1 | 0.79mi |
| 2523 E Midlothian Blvd Apt 5 Struthers, OH | 2.0 | 1.0 | 750 | $800 | $1.07 | 15d | 1 | 0.94mi |
| 929 Cook Ave Unit 1 Youngstown, OH | 2.0 | 1.0 | 700 | $850 | $1.21 | 45d | 1 | 1.08mi |
| 851 Cook Ave Unit 4 Youngstown, OH | 2.0 | 1.0 | 1050 | $800 | $0.76 | 45d | 1 | 1.15mi |
| 457 Mathews Rd Boardman, OH | 3.0 | 1.0 | 1200 | $1,300 | $1.08 | 45d | 1 | 1.42mi |
| 6300 South Ave Youngstown, OH | 1.0–2.0 | 1.0–2.0 | 743 | $950 | $1.28 | 15d | 1 | 1.42mi |
| 413 Mathews Rd Boardman, OH | 2.0 | 1.0 | 1000 | $1,200 | $1.20 | 45d | 1 | 1.49mi |
Listing history 15 events
-
2026-06-16status $110,000 Under Contract 18 DOM
-
2026-06-16days on market $110,000 Active 18 DOM
-
2026-06-15days on market $110,000 Active 17 DOM
-
2026-06-14days on market $110,000 Active 15 DOM
-
2026-06-13days on market $110,000 Active 14 DOM
-
2026-06-10days on market $110,000 Active 12 DOM
-
2026-06-09days on market $110,000 Active 11 DOM
-
2026-06-08days on market $110,000 Active 10 DOM
-
2026-06-07days on market $110,000 Active 9 DOM
-
2026-06-03days on market $110,000 Active 5 DOM
-
2026-06-02days on market $110,000 Active 4 DOM
-
2026-06-01days on market $110,000 Active 3 DOM
-
2026-05-31days on market $110,000 Active 2 DOM
-
2026-05-30remarks 699-char remark
-
2026-05-30$110,000 Active 1 DOM
ⓘ Source: listings_history table (triggers on properties + properties_extension) + one-shot
backfill from property_details.listing_events for pre-trigger history.
Tax reassessment forecast OH · Partial reset (capped growth)
- Current annual tax
- $1,013 · $84/mo
- Projected year-2 tax
- $1,365 · $114/mo
- Expected delta
- +$351/yr (+$29/mo · 34.7%)
ⓘ Screening estimate from a state-policy table — verify with the county assessor before closing.
Climate risk First Street
- Flood 1/10 Low FEMA zone X (unshaded) · 0% chance over 30 yrs
- Wildfire 1/10 Low
- Heat 3/10 Moderate 7 d/yr ≥97°F today · 17 d/yr by 30 yrs out
- Wind 1/10 Low
- Air quality 3/10 Moderate 1 unhealthy d/yr today · 4 by 30 yrs out
Nearby sold comps map
Loading sold comps map…
Walkable amenities ~0.75 mi
Loading nearby amenities…
Taxation est. · year 1
- Rental income
- $16,278
- − Mortgage interest
- −$6,162
- − Property taxes
- −$1,013
- − Insurance
- −$550
- − Repairs & maintenance
- −$1,302
- − Management
- −$1,302
- − Depreciation
- −$3,200
- Taxable income
- $2,748
- Est. tax owed @ 24.0%
- −$660
- After-tax cash flow
- $3,714/yr
For passive investors: Depreciation is non-cash, so a rental often shows a tax loss while cash-flowing — sheltering income. Rental losses are passive: they offset passive income freely, and up to $25,000/yr can offset ordinary (W-2) income if you actively participate and your MAGI is under $100k (phasing out to $0 by $150k); unused losses carry forward. On sale, claimed depreciation is recaptured at up to 25%, and gains may owe capital-gains tax (a 1031 exchange can defer both). Figures are a year-1 estimate at your 24.0% rate — not tax advice; consult a CPA.
Schools (NCES district)
- District
- Youngstown City
- NCES district ID
- 3904516
- Math proficiency
- 8% ▼ -15.00%
- Reading proficiency
- 17% ▼ -10.00%
- Median HH income
- $25,257
- Composite
- 9.29/100
- National rank
- #9858
- State rank
- #649 of 656 in OH
Livability — Youngstown
- Score
- 81/100
- State rank
- #99
- US rank
- #1506
Category grades
Schools grade is shown separately in the Schools card above.
Census & demographics
- Census place
- Youngstown, OH
- County
- Mahoning County · 84,956 people
- City population
- 28,503
- Metro
- Youngstown-Warren-Boardman, OH-PA
- Population (ZIP)
- 23,917
- Household income
- $79,808
- Rent vs Own
- Severe rent burden
- 411.0
Population outlook (Mahoning County) Hauer SSP2
- Today (2025)
- 223,932 people
- By 2030
- 218,387 · -2.5%
- By 2040
- 205,367 · -8.3%
- By 2050
- 193,606 · -13.5%
- By 2075
- 173,694 · -22.4%
- By 2100
- 151,147 · -32.5%
Race, ethnicity, and origin ACS 2023
- Neighborhood character
- Predominantly White (91%)
- Race & ethnicity
- White 91% Two or more races 4% Hispanic / Latino 3% Black 2%
- Common ancestry
- Romanian 6% Slovak 2% Lithuanian 2%
- Foreign-born
- 2% · Canada
- Languages at home
- 95% English-only · Other Indo-European 2% Spanish 2%
Political lean MEDSL · Mahoning
- 2024 margin
- Lean R (+9.4) · D 44.9% · R 54.4%
- 2008→2024 swing
- -36.1pp toward R · 2008: 26.6pp · 2024: -9.4pp
- All cycles
- 2024: R+9.4 2020: R+1.9 2016: D+3.0 2012: D+27.7 2008: D+26.6
Not yet ingested
- Civics
- —
Market trends
- HPI YoY
- ▼ -65.78%
- Current HPI
- 210.5511
- Rent YoY
- —
- Metro
- Youngstown-Warren-Boardman, OH-PA
- State GDP YoY
- ▲ 1.98%
- F500 in state
- 48
Industry mix (Fortune 500 HQ in OH)
| Industry | F500 HQs | Revenue |
|---|---|---|
| Insurance | 3 | $145B |
|
||
| Industrial Machinery | 3 | $49B |
|
||
| Financial Services | 3 | $24B |
|
||
| Consumer Goods | 2 | $93B |
|
||
| Aerospace / Defense | 2 | $47B |
|
||
| Utilities | 2 | $33B |
|
||
Price history
+107.5% since first listed10 events — show timeline
- 2026-05-30 Listed $110,000 FSBO.com
- 2025-05-12 Listing Removed — MLSNOW
- 2025-05-07 Listed $150,000 MLSNOW
- 2025-02-19 Sold (Public Records) $80,000 Public Records
- 2017-08-01 Sold (Public Records) $43,000 Public Records
- 2017-07-31 Pending — MLSNOW
- 2017-07-31 Sold (MLS) $43,000 MLSNOW
- 2017-06-01 Contingent — MLSNOW
- 2017-05-23 Price Changed $45,900 MLSNOW
- 2017-05-06 Listed $53,000 MLSNOW
Property tax history
+4.8%/yrLatest (2025): $1,013 · -11.9% YoY. Source: county tax records.
Cash-flow waterfall
monthlySold comps — $/sqft
last 12 mo · ≤1 miLoading sold comps…