624 N Mccomb St · Rich Hill, MO
Flood risk 1/10 · Minimal
- FEMA flood zone
- X (unshaded)
- Chance of flooding over 30 yrs
- 0.0%
- Est. flood insurance / yr
- $473 – $860
Fire risk 3/10 · Minor
- Est. fire insurance / yr
- $1,054 – $1,958
Heat risk 4/10 · Minor
- Hot days now (above 109°F)
- 7 days/yr
- Hot days in 30 yrs
- 18 days/yr
Wind risk 2/10 · Minimal
- Chance of severe wind over 30 yrs
- 1.0%
Air-quality risk 2/10 · Minimal
- Unhealthy air days now
- 0 days/yr
- Unhealthy air days in 30 yrs
- 1 days/yr
Risk factors via First Street. Map © Google.
Why this score? — see what drove the B grade
The composite is a weighted blend of 9 inputs, each scored 0–100. Each bar is that input's sub-score; the figure is the points it added to the 100-point composite (weight × sub-score).
- Cash flow +30.0/30.0
- 1% rule +10.0/10.0
- DSCR +10.0/10.0
- ARV discount +7.5/15.0
- Schools +4.2/10.0
- Appreciation +3.6/10.0
- Livability +3.4/5.0
- Rent growth +2.5/5.0
- Condition / age +2.5/5.0
$68,000
🖨 Deal sheet (PDF) 📄 Offer letter ✓ Due diligence
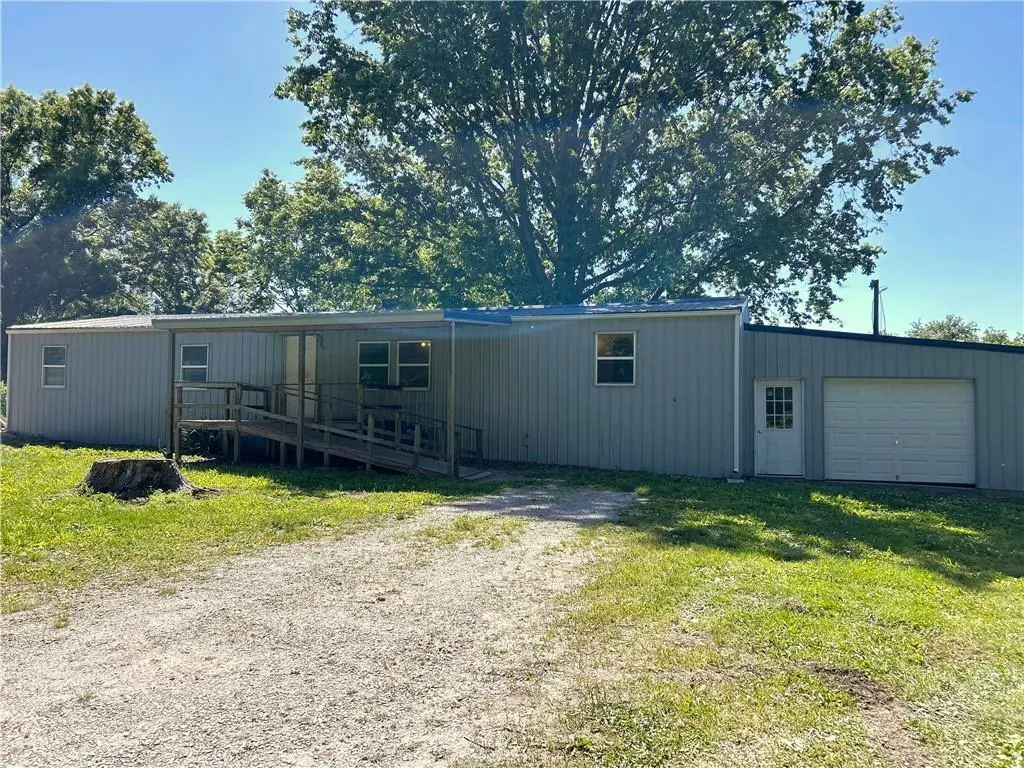
Listing remarks
This home is a handyman special but DEFINATELY worth the price! Sitting on 3 beautiful acres, at the north edge of city limits, this home is surrounded by a spacious country feel. Horses, chickens, turkey and other farm animals are on both sides of this home & the area is so peaceful and quiet! This home has had many updates over the years, with very little of the original manufactured home left. The newer covered front porch, along with a wooden ramp for easy access, is the perfect place to rest with a cool glass of ice tea to enjoy watching the birds and nature on a summer day. Add new floor covering to the living room, hallway & a few small places & the home would very
Key facts
- New metal roof
- New metal siding
- 3 beautiful acres
Tags
Property features AI
Finance
- Financial info: $200 annual tax amount
- HOA & community: No association fees
Exterior
- Parking: Attached garage that faces front; 1-car garage
- Utilities: Public water; Public sewer; High-speed internet available
- Home design: Single-family residential (manufactured); Ranch floor plan; Faces east; Located inside city limits; Fixer condition
- Construction: Metal siding; Metal roof; Crawl space foundation; Built 51–75 years ago
- Exterior features: Covered patio; Porch; Partial fencing; Satellite dish allowed; Garage(s) and outbuilding(s)
Interior
- Kitchen: Built-in features; Indirect lighting; Laminate counters
- Bedrooms: 4 bedrooms; Bedroom 2 with carpet; Bedroom 3 with carpet and walk-in closet; Bedroom 4 with built-in features and carpet
- Flooring: Carpet; Vinyl; Wood; Linoleum
- Bathrooms: 2 full bathrooms; 1 half bathroom; Bathroom with shower only; Bathroom with shower over tub
- Heating & cooling: Natural gas forced-air heating; Electric cooling (has cooling)
- Interior features: Ceiling fans; Custom cabinets with painted finish; Thermal windows; Built-in features; Formal dining area; Indirect lighting
- Laundry & utility: Laundry room with linoleum flooring; Dryer hookup (electric); Laundry closet
Neighborhood map
What this means for you Summary
Snapshot
- This is a 4-bed/2.5-bath manufactured listed at $68k.
Deal economics
- At list price, monthly cash flow is $476 ($6k/yr) — positive.
- The deal already cash-flows at list — no discount required.
- Meets the 1% rule at list price ($1k rent vs $68k).
Location & tenants
- Location reads 68/100 on livability (#173 in MO) — a middle-class / working-renter tenant base. Strengths: cost of living A+, housing A+, crime B+; Watch: employment D, amenities F, commute F.
- Rich Hill R-IV (rural): math 45% / reading 50% proficiency, ranked #167 of 535 in MO (top 31%) — families likely to look elsewhere, expect single-tenant / working-renter base with shorter leases.
- Zoned schools: Rich Hill Elem. (math 47% / reading 42%, grade F, #413 of 1,115 statewide, top 42%, 173 students, 53% FRL); Rich Hill High (math 57% / reading 47%, grade D+, #92 of 521 statewide, top 20%, 185 students, 54% FRL) — zoned schools at 54% FRL track the district average.
- Market conditions: 13 active listings in the ZIP; 2 units permitted in Bates County in 2024 (0 in 5+ unit buildings).
Forward outlook
- Local home prices are declining (-2.8%/yr); year-one equity from $470 of loan paydown is wiped out by about $2k of value loss. Plan a longer hold.
- Bates County population projected at -22% by 2050 — secular population decline; favor cash flow + early exit over multi-decade hold.
- At projected returns (-2.8% appreciation + 3.0% rent growth), your $19k cash investment doubles in ~4 years — after that, you're playing with house money.
Negotiation context
- Only 5 days on market — expect competitive offers; lowballing is unlikely to land.
Questions for the listing agent
- Built in 1970 — when were the roof, HVAC, electrical panel, plumbing, and water heater last replaced?
- Is there a deadline driving the sale (1031 exchange, divorce, estate, relocation)? That informs how much negotiation room exists.
- Schools are D-rated, which usually means shorter tenancies and higher turnover. Who's the typical renter profile here, and what's been the actual vacancy rate?
- What's the average days-on-market for RENTAL listings here right now (not sales)? A rising rental-DOM trend means longer vacancies and softer asking-rent achievability than the comps imply.
- What's the recent tenant-quality profile in this submarket — average credit score on applications, eviction rate, late-payment / NSF rate, and stable-employment percentage? A property-management company in the area should have these aggregated.
- How much new for-sale + rental construction is in the pipeline within 1–3 miles? Heavy new supply typically softens prices + rents 12–24 months out; constrained supply supports both.
Investment metrics
- 1% rule
- 1.63% ✓
- Cap rate
- 14.68%
- Cash-on-cash
- 29.97%
- DSCR
- 2.33
- GRM
- 5.1
CMA / ARV
No comps found within radius.
Projected returns pro-forma
-2.78% appreciation · 3.0% rent growth · sell at horizon
- IRR
- 25.0%
- Equity multiple
- 2.04×
- Total profit
- $19,875
- Equity at exit
- $10,813
- IRR
- 32.4%
- Equity multiple
- 3.98×
- Total profit
- $56,742
- Equity at exit
- $7,043
Cash invested: $19,040 (down + closing). Projections, not guarantees.
Landlord ↔ Tenant lean methodology
- Overall (STATE)
- 81 Strongly Landlord-Friendly
- State Missouri
- 81 Strongly Landlord-Friendly · R+10
- County
- — inherits STATE
- City
- — inherits STATE
ZIP-level market 64779
- Home prices YoY
- -1.0%
- Active inventory
- 13
- Price-to-rent
- 5.1×
Monthly cashflow live
- Estimated rent
- $1,109 medium interval (Pro) →
- Mortgage (P&I)
- −$357
- Tax from tax record
- −$15 /mo · $185/yr
- Insurance
- −$28
- HOA
- −$0
- Vacancy / Maint / Mgmt
- −$233
- Net cashflow
- $476
Break-even live
Sensitivity live
| Price | -10% $514 | -5% $495 | +0% $476 | +5% $456 | +10% $437 |
|---|---|---|---|---|---|
| Rent | -10% $388 | -5% $432 | +0% $476 | +5% $519 | +10% $563 |
| Rate | -1.0pp $510 | -0.5pp $493 | base $476 | +0.5pp $458 | +1.0pp $440 |
UW: 25.0% down · 7.5% · 30yr · 1.5% tax · 5.0% vac · 8.0% maint · 8.0% mgmt
Financing live
Cash to close
- Down payment
- $17,000
- Closing costs
- $2,040
- Reserves months
- —
- Total cash needed
- —
Loan-product check · same deal, 3 products live
Conventional
25% down · 7.5% · 30yr
- Down + closing
- —
- Monthly P&I
- —
- Monthly cashflow
- —
- DSCR
- —
- Eligible?
- —
Personal DTI + credit; lowest rate.
DSCR
20% down · 8.5% · 30yr
- Down + closing
- —
- Monthly P&I
- —
- Monthly cashflow
- —
- DSCR
- —
- Eligible?
- —
No personal income docs; deal must DSCR.
Hard money
10% down · 12.0% · 12mo
- Down + closing
- —
- Monthly P&I
- —
- Monthly cashflow
- —
- DSCR
- —
- Eligible?
- —
Short-term bridge; refi at stabilization.
Listing history 2 events
-
2026-05-20status Pending
-
2026-05-16$68,000 Active
ⓘ Source: listings_history table (triggers on properties + properties_extension) + one-shot
backfill from property_details.listing_events for pre-trigger history.
Tax reassessment forecast MO · Resets to sale price
- Current annual tax
- $185 · $15/mo
- Projected year-2 tax
- $660 · $55/mo
- Expected delta
- +$475/yr (+$40/mo · 256.8%)
ⓘ Screening estimate from a state-policy table — verify with the county assessor before closing.
Climate risk First Street
- Flood 1/10 Low FEMA zone X (unshaded) · 0% chance over 30 yrs
- Wildfire 3/10 Moderate
- Heat 4/10 Moderate 7 d/yr ≥109°F today · 18 d/yr by 30 yrs out
- Wind 2/10 Low 100% chance of damaging wind over 30 yrs
- Air quality 2/10 Low 0 unhealthy d/yr today · 1 by 30 yrs out
Nearby sold comps map
Loading sold comps map…
Walkable amenities ~0.75 mi
Loading nearby amenities…
Taxation est. · year 1
- Rental income
- $13,304
- − Mortgage interest
- −$3,809
- − Property taxes
- −$185
- − Insurance
- −$340
- − Repairs & maintenance
- −$1,064
- − Management
- −$1,064
- − Depreciation
- −$1,978
- Taxable income
- $4,863
- Est. tax owed @ 24.0%
- −$1,167
- After-tax cash flow
- $4,539/yr
For passive investors: Depreciation is non-cash, so a rental often shows a tax loss while cash-flowing — sheltering income. Rental losses are passive: they offset passive income freely, and up to $25,000/yr can offset ordinary (W-2) income if you actively participate and your MAGI is under $100k (phasing out to $0 by $150k); unused losses carry forward. On sale, claimed depreciation is recaptured at up to 25%, and gains may owe capital-gains tax (a 1031 exchange can defer both). Figures are a year-1 estimate at your 24.0% rate — not tax advice; consult a CPA.
Schools (NCES district)
- District
- Rich Hill R-IV
- NCES district ID
- 2926310
- Math proficiency
- 45% ▬ 0.00%
- Reading proficiency
- 50% ▲ 5.00%
- Median HH income
- $38,686
- Composite
- 41.74/100
- National rank
- #7176
- State rank
- #167 of 535 in MO
Livability — Rich Hill
- Score
- 68/100
- State rank
- #173
- US rank
- #9210
Category grades
Schools grade is shown separately in the Schools card above.
Census & demographics
- Census place
- Rich Hill, MO
- Population (ZIP)
- 2,926
Population outlook (Bates County) Hauer SSP2
- Today (2025)
- 15,295 people
- By 2030
- 14,644 · -4.3%
- By 2040
- 13,282 · -13.2%
- By 2050
- 11,944 · -21.9%
- By 2075
- 9,442 · -38.3%
- By 2100
- 7,372 · -51.8%
Race, ethnicity, and origin ACS 2023
- Neighborhood character
- Predominantly White (96%)
- Race & ethnicity
- White 96% Two or more races 2% Hispanic / Latino 2%
- Common ancestry
- Italian 2% Lithuanian 1% Iranian 1%
- Foreign-born
- 0%
- Languages at home
- 81% English-only · German/W. Germanic 18% Spanish 1%
Political lean MEDSL · Bates
- 2024 margin
- Solid R (+61.6) · D 18.7% · R 80.4%
- 2008→2024 swing
- -42.8pp toward R · 2008: -18.9pp · 2024: -61.6pp
- All cycles
- 2024: R+61.6 2020: R+58.5 2016: R+54.6 2012: R+31.7 2008: R+18.9
Not yet ingested
- Civics
- —
Market trends
- HPI YoY
- ▼ -2.78%
- Current HPI
- 282.2175
- Rent YoY
- —
- Metro
- —
- State GDP YoY
- ▲ 1.84%
- F500 in state
- 20
Industry mix (Fortune 500 HQ in MO)
| Industry | F500 HQs | Revenue |
|---|---|---|
| Healthcare | 1 | $163B |
|
||
| Insurance | 1 | $21B |
|
||
| Industrial Technology | 1 | $17B |
|
||
| Retail | 1 | $16B |
|
||
| Industrial Distribution | 1 | $10B |
|
||
| Utilities | 1 | $9B |
|
||
Price history
2 events — show timeline
- 2026-05-20 Pending — Heartland MLS as Distributed by MLS Grid
- 2026-05-16 Listed $68,000 Heartland MLS as Distributed by MLS Grid
Property tax history
-2.2%/yrLatest (2025): $185 · -1.2% YoY. Source: county tax records.
Cash-flow waterfall
monthlySold comps — $/sqft
last 12 mo · ≤1 miLoading sold comps…