1 Anderson Ext St · Inman, SC
Flood risk 1/10 · Minimal
- FEMA flood zone
- X (unshaded)
- Chance of flooding over 30 yrs
- 0.0%
- Est. flood insurance / yr
- $507 – $1,088
Fire risk 4/10 · Minor
- Est. fire insurance / yr
- $783 – $1,453
Heat risk 6/10 · Moderate
- Hot days now (above 105°F)
- 7 days/yr
- Hot days in 30 yrs
- 17 days/yr
Wind risk 2/10 · Minimal
- Chance of severe wind over 30 yrs
- 1.0%
Air-quality risk 4/10 · Minor
- Unhealthy air days now
- 4 days/yr
- Unhealthy air days in 30 yrs
- 4 days/yr
Risk factors via First Street. Map © Google.
Why this score? — see what drove the D- grade
The composite is a weighted blend of 9 inputs, each scored 0–100. Each bar is that input's sub-score; the figure is the points it added to the 100-point composite (weight × sub-score).
- ARV discount +9.1/15.0
- Cash flow +8.7/30.0
- Schools +4.5/10.0
- Livability +3.7/5.0
- Rent growth +2.9/5.0
- Condition / age +2.5/5.0
- DSCR +2.4/10.0
- 1% rule +1.4/10.0
- Appreciation +0.0/10.0
$273,000
🖨 Deal sheet 📄 Offer letter ✓ Due diligence
Listing remarks
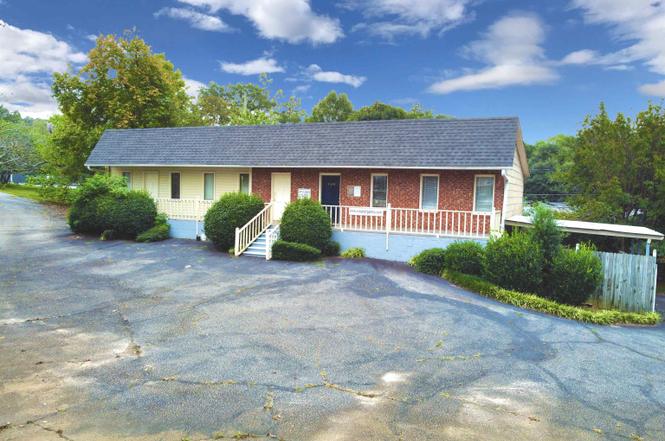
Discover an exceptional commercial property in the thriving town of Inman, strategically located just off Highway 176. Situated among numerous housing developments, industrial sites, gas stations, shopping centers, and restaurants, this property offers great visibility and accessibility. Enjoy the added benefit of being within walking distance of the future Saluda Grade Rail Trail. With a daily traffic count exceeding 25,000 vehicles on Highway 176, exposure is guaranteed. The property features ample parking and three front door entryways, allowing for easy division into multiple suites. Inside, you'll find generous office space, a full bathroom, and a fully-equipped 3-bedroom, 2-bath apart
Key facts
- Ample parking
- Full bathroom
- Great visibility
Tags
Property features AI
Finance
- Financial info: Annual property tax approximately $2,687
Exterior
- Home design: Mixed-use residential property; Single-story
- Construction: 1,482 sq ft above-grade finished area; 1,482 sq ft below-grade finished area
- Exterior features: Approximately 0.41-acre lot
Interior
- Bathrooms: 2 full bathrooms; 1 half bathroom
- Interior features: One-level living
Neighborhood map
What this means for you Summary
Snapshot
- This is a 3-bed/2.0-bath single-family listed at $273k.
Deal economics
- At list price, monthly cash flow is $-228 ($-3k/yr) — negative.
- To cash-flow at today's rent, offer at most $233k (14.7% below list).
- To meet the 1% rule (rent ≥ 1% of price), the offer needs to be $176k (35.5% below list).
- Recommended offer: $176k (35.5% below list) — sets the bar for 1% rule.
- Cap rate 5.3% vs local median 4.3% in Inman — meaningfully above typical; check what's discounted (condition, days-on-market, listing class) to confirm the premium yield is real.
Location & tenants
- Location reads 74/100 on livability (#29 in SC, #4,452 nationally) — a middle-class / working-renter tenant base. Strengths: cost of living A+, housing A+, health & safety A+; Watch: amenities D, commute F.
- Spartanburg 02 (suburban): math 49% / reading 56% proficiency, ranked #6 of 80 in SC (top 8%) — acceptable for families but not a draw, mixed tenant base, ~2y average lease.
- Zoned schools: Sugar Ridge Elementary (813 students, 60% FRL); Boiling Springs Middle (math 39% / reading 50%, grade D, #52 of 229 statewide, top 23%, 1,068 students, 70% FRL); Boiling Springs High (math 62% / reading 88%, grade A-, #37 of 196 statewide, top 18%, 2,671 students, 60% FRL) — zoned schools average 63% FRL vs 44% district-wide (19 pts higher); higher-poverty schools than district average — tighter screening recommended.
- Market conditions: Rents rising (+1.8%/yr); 693 active listings in the ZIP; 7 comparable units currently listed for rent nearby; rentals leasing fast (median 12d on market — plan ~1-2 weeks tenant-placement turnaround); solid renter incomes; 3,129 units permitted in Spartanburg County in 2024 (40 in 5+ unit buildings).
Forward outlook
- Local home prices are declining (-3.0%/yr); year-one equity from $2k of loan paydown is wiped out by about $8k of value loss. Plan a longer hold.
- Spartanburg County population projected at +18% by 2050 — long-run rental-demand tailwind backs the buy-and-hold thesis.
Negotiation context
- It's been on market 286 days — a 12% lower offer ($240k) is reasonable based on typical stale-listing flexibility.
- 2 sale attempts; this cycle's ask has dropped $77k (22%) from the opening price — seller is motivated, your offer sets the floor, not the list.
Risks & watch-outs
- Climate carrying-cost: extreme-heat days projected 7→17/yr by 2055 (HVAC capex compounding) — expect insurance premiums to compound above CPI over the hold.
Questions for the listing agent
- What do current leases actually rent for vs. the listed asking? Can we see a recent rent roll and the last 12 months of T-12 income?
- It's been on market 286 days. Have you received any prior offers? Is the seller open to a 36% concession, seller financing, or rate buy-down credit?
- Built in 1973 — when were the roof, HVAC, electrical panel, plumbing, and water heater last replaced?
- Why hasn't it sold? Are there any deal-killer items the seller is aware of (foundation, flood, title, zoning, code violations)?
- Is there a deadline driving the sale (1031 exchange, divorce, estate, relocation)? That informs how much negotiation room exists.
- The area grade is low — what's the realistic commute time and amenity access for the typical tenant pool here? Any planned neighborhood developments (good or bad) we should know about?
- What's the average days-on-market for RENTAL listings here right now (not sales)? A rising rental-DOM trend means longer vacancies and softer asking-rent achievability than the comps imply.
- What's the recent tenant-quality profile in this submarket — average credit score on applications, eviction rate, late-payment / NSF rate, and stable-employment percentage? A property-management company in the area should have these aggregated.
- How much new for-sale + rental construction is in the pipeline within 1–3 miles? Heavy new supply typically softens prices + rents 12–24 months out; constrained supply supports both.
Investment metrics
- 1% rule
- 0.64% ✗
- Cap rate
- 5.29%
- Cash-on-cash
- -3.57%
- DSCR
- 0.84
- GRM
- 12.9
CMA / ARV
- ARV (on-the-fly)
- $282,880
- Comps found
- 12
Show comp detail 12 sales within ~0.75 mi
| Address | Dist | Beds/Ba | Sqft | Sold | Price | $/sf | Match |
|---|---|---|---|---|---|---|---|
| 523 Treasure Cv | 0.18mi | 3/2.0 | 1,633 (-2%) | 10mo | $326,625 | $200 | 80 |
| 1 Dallas St | 0.22mi | 3/2.5 | 1,796 (+8%) | 2mo | $285,000 | $159 | 73 |
| 381 Split Oak Ln | 0.50mi | 3/2.0 | 1,622 (-2%) | 0mo | $260,000 | $160 | 72 |
| 203 Minnie Crain Dr | 0.44mi | 3/3.0 | 1,628 (-2%) | 4mo | $265,000 | $163 | 68 |
| 1526 Offshore Dr | 0.33mi | 3/2.0 | 1,808 (+9%) | 7mo | $307,000 | $170 | 64 |
| 1526 Offshore Dr Unit CLE 32 | 0.33mi | 3/2.0 | 1,808 (+9%) | 7mo | $307,000 | $170 | 64 |
| 253 Highland Springs Loop | 0.67mi | 3/2.0 | 1,644 (-1%) | 6mo | $274,900 | $167 | 62 |
| 12 Outter Dr | 0.34mi | 2/2.5 (-1) | 1,795 (+8%) | 5mo | $342,000 | $191 | 60 |
| 307 Burdell Ter | 0.41mi | 3/2.5 | 1,536 (-8%) | 10mo | $280,000 | $182 | 58 |
| 393 Split Oak Ln | 0.52mi | 3/2.0 | 1,426 (-14%) | 0mo | $247,000 | $173 | 52 |
| 410 Bud Farmer Pl | 0.45mi | 3/2.0 | 1,456 (-12%) | 9mo | $280,000 | $192 | 51 |
| 257 Highland Springs Loop | 0.68mi | 4/2.0 (+1) | 1,801 (+8%) | 11mo | $307,000 | $170 | 41 |
Match score weights: distance 35% · size 25% · config 20% · recency 20%. Top-matched comps best support the ARV.
Projected returns pro-forma
-3.0% appreciation · 1.79% rent growth · sell at horizon
- IRR
- -23.5%
- Equity multiple
- 0.20×
- Total profit
- $-60,988
- Equity at exit
- $40,705
- IRR
- -21.5%
- Equity multiple
- -0.06×
- Total profit
- $-80,814
- Equity at exit
- $23,604
Cash invested: $76,440 (down + closing). Projections, not guarantees.
Landlord ↔ Tenant lean methodology
- Overall (STATE)
- 90 Strongly Landlord-Friendly
- State South Carolina
- 90 Strongly Landlord-Friendly · R+6
- County
- — inherits STATE
- City
- — inherits STATE
ZIP-level market 29349
- Home prices YoY
- -31.8%
- Rents YoY
- 1.8%
- Active inventory
- 693
- Price-to-rent
- 12.9×
Monthly cashflow live
- Estimated rent
- $1,760 high interval (Pro) →
- Mortgage (P&I)
- −$1,432
- Tax from tax record
- −$73 /mo · $872/yr
- Insurance
- −$114
- HOA
- −$0
- Vacancy / Maint / Mgmt
- −$370
- Net cashflow
- $-228
Break-even live
UW: 25.0% down · 7.5% · 30yr · 1.5% tax · 5.0% vac · 8.0% maint · 8.0% mgmt
Financing live
Cash to close
- Down payment
- $68,250
- Closing costs
- $8,190
- Reserves months
- —
- Total cash needed
- —
Loan-product check · same deal, 3 products live
Conventional
25% down · 7.5% · 30yr
- Down + closing
- —
- Monthly P&I
- —
- Monthly cashflow
- —
- DSCR
- —
- Eligible?
- —
Personal DTI + credit; lowest rate.
DSCR
20% down · 8.5% · 30yr
- Down + closing
- —
- Monthly P&I
- —
- Monthly cashflow
- —
- DSCR
- —
- Eligible?
- —
No personal income docs; deal must DSCR.
Hard money
10% down · 12.0% · 12mo
- Down + closing
- —
- Monthly P&I
- —
- Monthly cashflow
- —
- DSCR
- —
- Eligible?
- —
Short-term bridge; refi at stabilization.
Rent comps 7 comps
| Address | Beds | Baths | Sqft | Rent | $/sqft | DOM | Units | Dist |
|---|---|---|---|---|---|---|---|---|
| 2003 Brother Arthur Trl Inman, SC | 3.0 | 2.0–2.5 | 1301 | $1,570 | $1.21 | 11d | 4 | 0.53mi |
| 2039 Brother Arthur Trl Inman, SC | 3.0 | 2.5 | 1474 | $1,695 | $1.15 | 11d | 1 | 0.60mi |
| 2034 Brother Arthur Trl Inman, SC | 3.0 | 2.0 | 1129 | $1,545 | $1.37 | 11d | 1 | 0.61mi |
| 2036 Brother Arthur Trl Inman, SC | 3.0 | 2.5 | 1474 | $1,595 | $1.08 | 11d | 1 | 0.63mi |
| 18 W Clark Rd Inman, SC | 3.0 | 2.0 | 1344 | $1,500 | $1.12 | 21d | 1 | 0.93mi |
| 400 Timberlake View Cir Inman, SC | 2.0–3.0 | 2.0 | 1050 | $1,164 | $1.11 | 19d | 1 | 1.01mi |
| 2118 Southlea Dr Inman, SC | 3.0 | 2.5 | 1915 | $1,749 | $0.91 | 13d | 1 | 1.06mi |
Listing history 20 events
-
2026-06-18days on market $273,000 Active 286 DOM
-
2026-06-17days on market $273,000 Active 285 DOM
-
2026-06-16days on market $273,000 Active 284 DOM
-
2026-06-15days on market $273,000 Active 283 DOM
-
2026-06-14days on market $273,000 Active 281 DOM
-
2026-06-13days on market $273,000 Active 280 DOM
-
2026-06-10days on market $273,000 Active 278 DOM
-
2026-06-09days on market $273,000 Active 277 DOM
-
2026-06-08days on market $273,000 Active 276 DOM
-
2026-06-07days on market $273,000 Active 275 DOM
-
2026-06-05days on market $273,000 Active 272 DOM
-
2026-06-02days on market $273,000 Active 270 DOM
-
2026-06-01days on market $273,000 Active 269 DOM
-
2026-05-31days on market $273,000 Active 268 DOM
-
2026-05-30days on market $273,000 Active 267 DOM
-
2026-04-28price $273,000
-
2026-01-01status Active
-
2025-12-02status Pending
-
2025-10-10price $285,000
-
2025-07-24$350,000 Active
ⓘ Source: listings_history table (triggers on properties + properties_extension) + one-shot
backfill from property_details.listing_events for pre-trigger history.
Tax reassessment forecast SC · Resets to sale price
- Current annual tax
- $872 · $73/mo
- Projected year-2 tax
- $1,556 · $130/mo
- Expected delta
- +$684/yr (+$57/mo · 78.5%)
ⓘ Screening estimate from a state-policy table — verify with the county assessor before closing.
Climate risk First Street
- Flood 1/10 Low FEMA zone X (unshaded) · 0% chance over 30 yrs
- Wildfire 4/10 Moderate
- Heat 6/10 Major 7 d/yr ≥105°F today · 17 d/yr by 30 yrs out
- Wind 2/10 Low 100% chance of damaging wind over 30 yrs
- Air quality 4/10 Moderate 4 unhealthy d/yr today · 4 by 30 yrs out
Nearby sold comps map
Loading sold comps map…
Walkable amenities ~0.75 mi
Loading nearby amenities…
Taxation est. · year 1
- Rental income
- $21,121
- − Mortgage interest
- −$15,292
- − Property taxes
- −$872
- − Insurance
- −$1,365
- − Repairs & maintenance
- −$1,690
- − Management
- −$1,690
- − Depreciation
- −$7,942
- Taxable loss
- −$7,729
- Est. tax savings @ 24.0%
- +$1,855
- After-tax cash flow
- $-876/yr
For passive investors: Depreciation is non-cash, so a rental often shows a tax loss while cash-flowing — sheltering income. Rental losses are passive: they offset passive income freely, and up to $25,000/yr can offset ordinary (W-2) income if you actively participate and your MAGI is under $100k (phasing out to $0 by $150k); unused losses carry forward. On sale, claimed depreciation is recaptured at up to 25%, and gains may owe capital-gains tax (a 1031 exchange can defer both). Figures are a year-1 estimate at your 24.0% rate — not tax advice; consult a CPA.
Schools (NCES district)
- District
- Spartanburg 02
- NCES district ID
- 4503510
- Math proficiency
- 49% ▼ -7.00%
- Reading proficiency
- 56% ▲ 2.00%
- Median HH income
- $49,591
- Composite
- 44.79/100
- National rank
- #2742
- State rank
- #6 of 80 in SC
Livability — Inman
- Score
- 74/100
- State rank
- #29
- US rank
- #4452
Category grades
Schools grade is shown separately in the Schools card above.
Census & demographics
- County
- Spartanburg County · 258,607 people
- City population
- 39,083
- Metro
- Spartanburg, SC
- Population (ZIP)
- 39,083
- Household income
- $76,168
- Rent vs Own
- Severe rent burden
- 271.0
Population outlook (Spartanburg County) Hauer SSP2
- Today (2025)
- 325,495 people
- By 2030
- 338,800 · +4.1%
- By 2040
- 363,471 · +11.7%
- By 2050
- 384,156 · +18.0%
- By 2075
- 430,137 · +32.1%
- By 2100
- 442,733 · +36.0%
Race, ethnicity, and origin ACS 2023
- Neighborhood character
- Predominantly White (80%)
- Race & ethnicity
- White 80% Black 9% Hispanic / Latino 6% Two or more races 4% Asian 2%
- Hispanic origin (detail)
- Mexican 5%
- Common ancestry
- Subsaharan African 6% Serbian 3% Scotch-Irish 3%
- Foreign-born
- 9% · Canada
- Languages at home
- 86% English-only · Russian/Polish/Slavic 7% Spanish 3% Other Asian/Pacific 2%
Political lean MEDSL · Spartanburg
- 2024 margin
- Solid R (+33.6) · D 32.6% · R 66.2% · Other 1.2%
- 2008→2024 swing
- -12.0pp toward R · 2008: -21.6pp · 2024: -33.6pp
- All cycles
- 2024: R+33.6 2020: R+27.3 2016: R+30.0 2012: R+23.1 2008: R+21.6
Not yet ingested
- Civics
- —
Market trends
- HPI YoY
- ▼ -113.67%
- Current HPI
- 244.0359
- Rent YoY
- ▲ 1.79%
- Metro
- Spartanburg, SC
- State GDP YoY
- ▲ 4.51%
- F500 in state
- 2
Industry mix (Fortune 500 HQ in SC)
| Industry | F500 HQs | Revenue |
|---|---|---|
| Packaging | 1 | $7B |
|
||
Price history
-22.0% since first listed5 events — show timeline
- 2026-04-28 Price Changed $273,000 SPMLS
- 2026-01-01 Relisted — SPMLS
- 2025-12-02 Pending — SPMLS
- 2025-10-10 Price Changed $285,000 SPMLS
- 2025-07-24 Listed $350,000 SPMLS
Property tax history
+9.4%/yrLatest (2025): $872 · +1.2% YoY. Source: county tax records.
Cash-flow waterfall
monthlySold comps — $/sqft
last 12 mo · ≤1 miLoading sold comps…