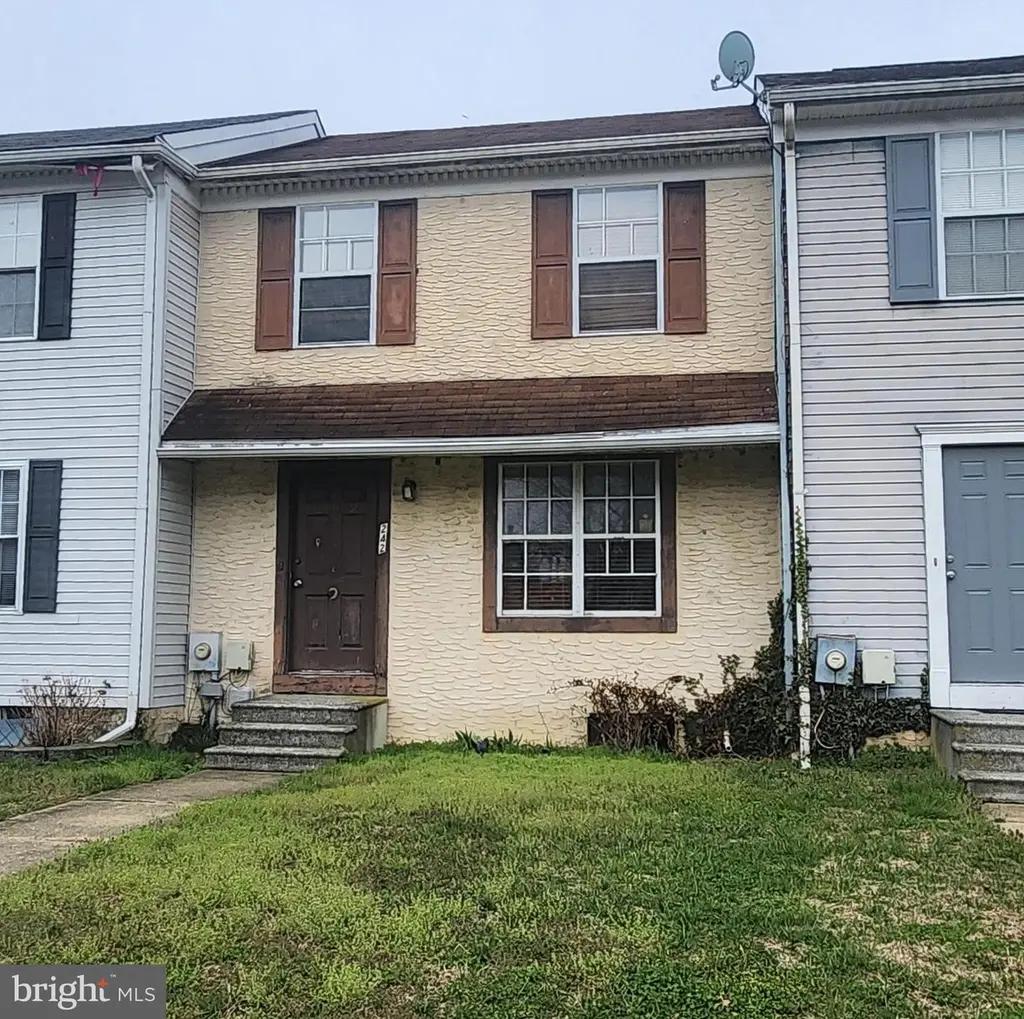
242 Green Blade Dr · Dover, DE
Flood risk 1/10 · Minimal
- FEMA flood zone
- X (unshaded)
- Chance of flooding over 30 yrs
- 0.0%
- Est. flood insurance / yr
- $473 – $860
Fire risk 1/10 · Minimal
- Est. fire insurance / yr
- $476 – $884
Heat risk 8/10 · Major
- Hot days now (above 101°F)
- 7 days/yr
- Hot days in 30 yrs
- 16 days/yr
Wind risk 7/10 · Major
- Chance of severe wind over 30 yrs
- 78.0%
Air-quality risk 2/10 · Minimal
- Unhealthy air days now
- 1 days/yr
- Unhealthy air days in 30 yrs
- 2 days/yr
Risk factors via First Street. Map © Google.
Why this score? — see what drove the C+ grade
The composite is a weighted blend of 9 inputs, each scored 0–100. Each bar is that input's sub-score; the figure is the points it added to the 100-point composite (weight × sub-score).
- Cash flow +25.0/30.0
- ARV discount +15.0/15.0
- DSCR +8.2/10.0
- 1% rule +5.6/10.0
- Livability +3.4/5.0
- Rent growth +3.3/5.0
- Condition / age +2.5/5.0
- Schools +2.0/10.0
- Appreciation +0.0/10.0
$165,000
🖨 Deal sheet 📄 Offer letter ✓ Due diligence
Listing remarks MLS
Investors! This interior unit is a 2 bedroom 1.5 bath interior unit. The home has an active lease through January 1st 2027.
Key facts
- Built 1983
- Listed 84 days
Neighborhood map
What this means for you Summary
Snapshot
- This is a 2-bed/1.5-bath single-family listed at $165k.
Deal economics
- At list price, monthly cash flow is $360 ($4k/yr) — positive.
- The deal already cash-flows at list — no discount required.
- Meets the 1% rule at list price ($2k rent vs $165k).
- Recommended offer: $155k (6.0% below list) — sets the bar for market timing.
- Cap rate 8.9% vs local median 5.2% in Dover — top-decile yield for the area; either an underpriced asset or a hidden risk that comps aren't pricing in. Stress-test before assuming the spread holds.
Location & tenants
- Location reads 67/100 on livability (#38 in DE) — a middle-class / working-renter tenant base. Strengths: amenities A+, cost of living A+, housing A+; Watch: schools C-, crime F, commute F.
- Capital School District (urban): math 14% / reading 31% proficiency, ranked #24 of 26 in DE (top 92%) — low school quality limits family demand, transient renter base, plan for 1-2y turnover.
- Market conditions: Rents rising (+3.3%/yr); 225 active listings in the ZIP; 17 comparable units currently listed for rent nearby; rentals lingering (median 44d on market — plan ~5-8 weeks vacancy on turnover, expect pricing pressure); 100% of comp listings sitting > 30 days — soft ceiling on asking rent; 1,201 units permitted in Kent County in 2024 (116 in 5+ unit buildings).
- This rent runs 31% of the median local income ($67k/yr) — at the standard rent-burdened threshold; future hikes will face affordability resistance.
Forward outlook
- Local home prices are declining (-3.0%/yr); year-one equity from $1k of loan paydown is wiped out by about $5k of value loss. Plan a longer hold.
- Kent County population projected at +22% by 2050 — long-run rental-demand tailwind backs the buy-and-hold thesis.
Negotiation context
- It's been on market 85 days — a 6% lower offer ($155k) is reasonable based on typical stale-listing flexibility.
- 2 sale attempts since 19y ago; this cycle's ask has dropped $15k (8%) from the opening price — seller is motivated, your offer sets the floor, not the list.
- Current owner paid $108k; list at $165k implies a 53% gain — meaningful room to come down on a strong offer.
Risks & watch-outs
- Climate carrying-cost: major wind risk, 78% chance of damaging wind over 30y; extreme-heat days projected 7→16/yr by 2055 (HVAC capex compounding) — expect insurance premiums to compound above CPI over the hold.
Questions for the listing agent
- It's been on market 85 days. Have you received any prior offers? Is the seller open to a 6% concession, seller financing, or rate buy-down credit?
- Why hasn't it sold? Are there any deal-killer items the seller is aware of (foundation, flood, title, zoning, code violations)?
- Is there a deadline driving the sale (1031 exchange, divorce, estate, relocation)? That informs how much negotiation room exists.
- Crime grade is F in this area — have there been break-ins, vandalism, or insurance claims at this property in the last 3 years? What carrier currently insures it and at what premium?
- What's the average days-on-market for RENTAL listings here right now (not sales)? A rising rental-DOM trend means longer vacancies and softer asking-rent achievability than the comps imply.
- What's the recent tenant-quality profile in this submarket — average credit score on applications, eviction rate, late-payment / NSF rate, and stable-employment percentage? A property-management company in the area should have these aggregated.
- How much new for-sale + rental construction is in the pipeline within 1–3 miles? Heavy new supply typically softens prices + rents 12–24 months out; constrained supply supports both.
Investment metrics
- 1% rule
- 1.06% ✓
- Cap rate
- 8.91%
- Cash-on-cash
- 9.36%
- DSCR
- 1.42
- GRM
- 7.9
CMA / ARV
- ARV (median comp)
- $206,629
- List price
- $165,000
- Delta
- -20.15%
- Verdict
- UNDERPRICED
- Comps
- 20 within 1.0 mi
Show comp detail 4 sales within ~0.75 mi
| Address | Dist | Beds/Ba | Sqft | Sold | Price | $/sf | Match |
|---|---|---|---|---|---|---|---|
| 1362 W College Rd | 0.59mi | 3/2.0 (+1) | 1,172 (+5%) | 4mo | $305,000 | $260 | 54 |
| 1358 W College Rd | 0.61mi | 3/2.0 (+1) | 1,269 (+13%) | 1mo | $320,000 | $252 | 41 |
| 28 Ann Ave | 0.75mi | 3/2.0 (+1) | 1,188 (+6%) | 23mo | $262,000 | $221 | 29 |
| 1360 College Rd | 0.61mi | 3/2.0 (+1) | 1,260 (+12%) | 22mo | $325,000 | $258 | 25 |
Match score weights: distance 35% · size 25% · config 20% · recency 20%. Top-matched comps best support the ARV.
Projected returns pro-forma
-3.0% appreciation · 3.3% rent growth · sell at horizon
- IRR
- -1.9%
- Equity multiple
- 0.93×
- Total profit
- $-3,306
- Equity at exit
- $24,602
- IRR
- 8.1%
- Equity multiple
- 1.62×
- Total profit
- $28,655
- Equity at exit
- $14,266
Cash invested: $46,200 (down + closing). Projections, not guarantees.
Landlord ↔ Tenant lean methodology
- Overall (STATE)
- 70 Landlord-Friendly
- State Delaware
- 70 Landlord-Friendly · D+7
- County
- — inherits STATE
- City
- — inherits STATE
ZIP-level market 19904
- Rents YoY
- 3.3%
- Active inventory
- 225
- Price-to-rent
- 7.9×
Monthly cashflow live
- Estimated rent
- $1,744 high interval (Pro) →
- Mortgage (P&I)
- −$865
- Tax from tax record
- −$83 /mo · $998/yr
- Insurance
- −$69
- HOA
- −$0
- Vacancy / Maint / Mgmt
- −$366
- Net cashflow
- $360
Break-even live
UW: 25.0% down · 7.5% · 30yr · 1.5% tax · 5.0% vac · 8.0% maint · 8.0% mgmt
Financing live
Cash to close
- Down payment
- $41,250
- Closing costs
- $4,950
- Reserves months
- —
- Total cash needed
- —
Loan-product check · same deal, 3 products live
Conventional
25% down · 7.5% · 30yr
- Down + closing
- —
- Monthly P&I
- —
- Monthly cashflow
- —
- DSCR
- —
- Eligible?
- —
Personal DTI + credit; lowest rate.
DSCR
20% down · 8.5% · 30yr
- Down + closing
- —
- Monthly P&I
- —
- Monthly cashflow
- —
- DSCR
- —
- Eligible?
- —
No personal income docs; deal must DSCR.
Hard money
10% down · 12.0% · 12mo
- Down + closing
- —
- Monthly P&I
- —
- Monthly cashflow
- —
- DSCR
- —
- Eligible?
- —
Short-term bridge; refi at stabilization.
Rent comps 17 comps
| Address | Beds | Baths | Sqft | Rent | $/sqft | DOM | Units | Dist |
|---|---|---|---|---|---|---|---|---|
| 236 Green Blade Dr Dover, DE | 3.0 | 2.5 | 1200 | $1,850 | $1.54 | 43d | 1 | 0.02mi |
| 33 Fieldstone Ct Dover, DE | 2.0 | 1.5 | 1120 | $1,550 | $1.38 | 43d | 1 | 0.12mi |
| 11 Dover Hall Unit 434 Dover, DE | 2.0 | 2.0 | 960 | $1,700 | $1.77 | 43d | 1 | 0.21mi |
| 70 Greenway Sq Dover, DE | 3.0 | 1.0–2.0 | 769 | $1,783 | $2.32 | 43d | 1 | 0.31mi |
| 1300 S Farmview Dr Dover, DE | 1.0–2.0 | 1.0–2.0 | 888 | $1,699 | $1.91 | 43d | 8 | 0.32mi |
| 97 Par Haven Dr Unit J23 Dover, DE | 2.0 | 1.5 | 1050 | $1,650 | $1.57 | 43d | 1 | 0.42mi |
| 44 Courtside Dr Unit B31 Dover, DE | 2.0 | 1.5 | 1008 | $1,650 | $1.64 | 43d | 1 | 0.43mi |
| 63 Forest Creek Dr Dover, DE | 3.0 | 1.5 | 1322 | $1,600 | $1.21 | 43d | 1 | 0.81mi |
| 114 Thames Dr Dover, DE | 2.0 | 2.5 | 1452 | $1,650 | $1.14 | 43d | 1 | 0.86mi |
| 892 Woodcrest Dr Dover, DE | 2.0 | 1.0–1.5 | 521 | $1,690 | $3.24 | 43d | 15 | 1.05mi |
| 105 Katrina Way Dover, DE | 1.0–3.0 | 1.0–2.0 | 952 | $1,800 | $1.89 | 43d | 22 | 1.06mi |
| 355A Ridgely St Dover, DE | 1.0–3.0 | 1.0–2.5 | 1238 | $2,210 | $1.78 | 43d | 17 | 1.07mi |
| 46 Lincoln St Dover, DE | 2.0 | 2.0 | 1073 | $1,700 | $1.58 | 43d | 1 | 1.09mi |
| 100 Isabelle Isle Dover, DE | 2.0–3.0 | 2.0 | 1273 | $1,859 | $1.46 | 43d | 9 | 1.26mi |
| 424 Ridgely Blvd Dover, DE | 3.0 | 2.5 | 1432 | $2,000 | $1.40 | 43d | 1 | 1.31mi |
| 16 S New St #1 Dover, DE | 3.0 | 1.0 | 1000 | $1,950 | $1.95 | 43d | 1 | 1.37mi |
| 205 Ridgely Blvd Dover, DE | 3.0 | 2.5 | 1432 | $2,000 | $1.40 | 43d | 1 | 1.39mi |
Listing history 24 events
-
2026-06-19days on market $165,000 Active 85 DOM
-
2026-06-18days on market $165,000 Active 84 DOM
-
2026-06-17days on market $165,000 Active 83 DOM
-
2026-06-16days on market $165,000 Active 82 DOM
-
2026-06-15days on market $165,000 Active 81 DOM
-
2026-06-14days on market $165,000 Active 79 DOM
-
2026-06-13days on market $165,000 Active 78 DOM
-
2026-06-10days on market $165,000 Active 76 DOM
-
2026-06-09days on market $165,000 Active 75 DOM
-
2026-06-08days on market $165,000 Active 74 DOM
-
2026-06-07days on market $165,000 Active 73 DOM
-
2026-06-02days on market $165,000 Active 68 DOM
-
2026-06-01days on market $165,000 Active 67 DOM
-
2026-05-31days on market $165,000 Active 66 DOM
-
2026-05-30days on market $165,000 Active 65 DOM
-
2026-05-19historical Active Under Contract 123-char remark
Show marketing remark (123 chars)
Investors! This interior unit is a 2 bedroom 1.5 bath interior unit. The home has an active lease through January 1st 2027.
-
2026-05-12price $172,000 123-char remark
Show marketing remark (123 chars)
Investors! This interior unit is a 2 bedroom 1.5 bath interior unit. The home has an active lease through January 1st 2027.
-
2026-05-04price $175,000 123-char remark
Show marketing remark (123 chars)
Investors! This interior unit is a 2 bedroom 1.5 bath interior unit. The home has an active lease through January 1st 2027.
-
2026-03-22$180,000 Active 123-char remark
Show marketing remark (123 chars)
Investors! This interior unit is a 2 bedroom 1.5 bath interior unit. The home has an active lease through January 1st 2027.
-
2008-02-28soldstatus $108,000
-
2008-02-25soldstatus $108,000 285-char remark
Show marketing remark (285 chars)
K-6792 Great Investment Opportunity! 2BR, 1 1/2BA Townhome with private fenced in yard. This home features a fireplace in the living room, 2 car parking, large closets and a full basement. Recent upgrades include a new refrigerator. Great location, close to schools, shopping and more!
-
2007-12-28historical 285-char remark
Show marketing remark (285 chars)
K-6792 Great Investment Opportunity! 2BR, 1 1/2BA Townhome with private fenced in yard. This home features a fireplace in the living room, 2 car parking, large closets and a full basement. Recent upgrades include a new refrigerator. Great location, close to schools, shopping and more!
-
2007-11-14$108,000 285-char remark
Show marketing remark (285 chars)
K-6792 Great Investment Opportunity! 2BR, 1 1/2BA Townhome with private fenced in yard. This home features a fireplace in the living room, 2 car parking, large closets and a full basement. Recent upgrades include a new refrigerator. Great location, close to schools, shopping and more!
-
1985-04-01soldstatus $52,250
ⓘ Source: listings_history table (triggers on properties + properties_extension) + one-shot
backfill from property_details.listing_events for pre-trigger history.
Tax reassessment forecast DE · Partial reset (capped growth)
- Current annual tax
- $998 · $83/mo
- Projected year-2 tax
- $998 · $83/mo
- Expected delta
- $0/yr ($0/mo · 0.0%)
ⓘ Screening estimate from a state-policy table — verify with the county assessor before closing.
Climate risk First Street
- Flood 1/10 Low FEMA zone X (unshaded) · 0% chance over 30 yrs
- Wildfire 1/10 Low
- Heat 8/10 Severe 7 d/yr ≥101°F today · 16 d/yr by 30 yrs out
- Wind 7/10 Severe 78% chance of damaging wind over 30 yrs
- Air quality 2/10 Low 1 unhealthy d/yr today · 2 by 30 yrs out
Nearby sold comps map
Loading sold comps map…
Walkable amenities ~0.75 mi
Loading nearby amenities…
Taxation est. · year 1
- Rental income
- $20,926
- − Mortgage interest
- −$9,243
- − Property taxes
- −$998
- − Insurance
- −$825
- − Repairs & maintenance
- −$1,674
- − Management
- −$1,674
- − Depreciation
- −$4,800
- Taxable income
- $1,712
- Est. tax owed @ 24.0%
- −$411
- After-tax cash flow
- $3,914/yr
For passive investors: Depreciation is non-cash, so a rental often shows a tax loss while cash-flowing — sheltering income. Rental losses are passive: they offset passive income freely, and up to $25,000/yr can offset ordinary (W-2) income if you actively participate and your MAGI is under $100k (phasing out to $0 by $150k); unused losses carry forward. On sale, claimed depreciation is recaptured at up to 25%, and gains may owe capital-gains tax (a 1031 exchange can defer both). Figures are a year-1 estimate at your 24.0% rate — not tax advice; consult a CPA.
Schools (NCES district)
- District
- Capital School District
- NCES district ID
- 1000190
- Math proficiency
- 14% ▼ -17.00%
- Reading proficiency
- 31% ▼ -12.00%
- Median HH income
- $48,499
- Composite
- 19.78/100
- National rank
- #8703
- State rank
- #24 of 26 in DE
Livability — Dover
- Score
- 67/100
- State rank
- #38
- US rank
- #10574
Category grades
Schools grade is shown separately in the Schools card above.
Census & demographics
- Census place
- Dover, DE
- County
- Kent County · 82,184 people
- City population
- 76,581
- Metro
- Dover, DE
- Population (ZIP)
- 38,818
- Household income
- $66,908
- Rent vs Own
- Severe rent burden
- 1500.0
Population outlook (Kent County) Hauer SSP2
- Today (2025)
- 194,477 people
- By 2030
- 204,351 · +5.1%
- By 2040
- 222,135 · +14.2%
- By 2050
- 236,483 · +21.6%
- By 2075
- 266,327 · +36.9%
- By 2100
- 275,335 · +41.6%
Race, ethnicity, and origin ACS 2023
- Neighborhood character
- Diverse neighborhood (Simpson 0.64)
- Race & ethnicity
- White 48% Black 35% Two or more races 9% Hispanic / Latino 8% Asian 3%
- Hispanic origin (detail)
- Mexican 1% Puerto Rican 4%
- Common ancestry
- Hispanic 3% Romanian 2% Slovak 2%
- Foreign-born
- 10% · Canada, South Korea
- Languages at home
- 87% English-only · Spanish 5% French/Haitian/Cajun 3% German/W. Germanic 1%
Political lean MEDSL · Kent
- 2024 margin
- Toss-up / Even · D 50.2% · R 48.2% · Other 1.7%
- 2008→2024 swing
- -7.8pp toward R · 2008: 9.8pp · 2024: 2.0pp
- All cycles
- 2024: D+2.0 2020: D+4.1 2016: R+4.9 2012: D+4.9 2008: D+9.8
Not yet ingested
- Civics
- —
Market trends
- HPI YoY
- ▼ -112.03%
- Current HPI
- 187.6879
- Rent YoY
- ▲ 3.30%
- Metro
- Dover, DE
- State GDP YoY
- —
- F500 in state
- 0
Price history
+229.2% since first listed9 events — show timeline
- 2026-05-19 Contingent — BRIGHT MLS
- 2026-05-12 Price Changed $172,000 BRIGHT MLS
- 2026-05-04 Price Changed $175,000 BRIGHT MLS
- 2026-03-22 Listed $180,000 BRIGHT MLS
- 2008-02-28 Sold (Public Records) $108,000 Public Records
- 2008-02-25 Sold (MLS) $108,000 BRIGHT MLS
- 2007-12-28 Listing Removed — BRIGHT MLS
- 2007-11-14 Listed $108,000 BRIGHT MLS
- 1985-04-01 Sold (Public Records) $52,250 Public Records
Property tax history
+2.6%/yrLatest (2025): $998 · +3.5% YoY. Source: county tax records.
Cash-flow waterfall
monthlySold comps — $/sqft
last 12 mo · ≤1 miLoading sold comps…