 Triplex
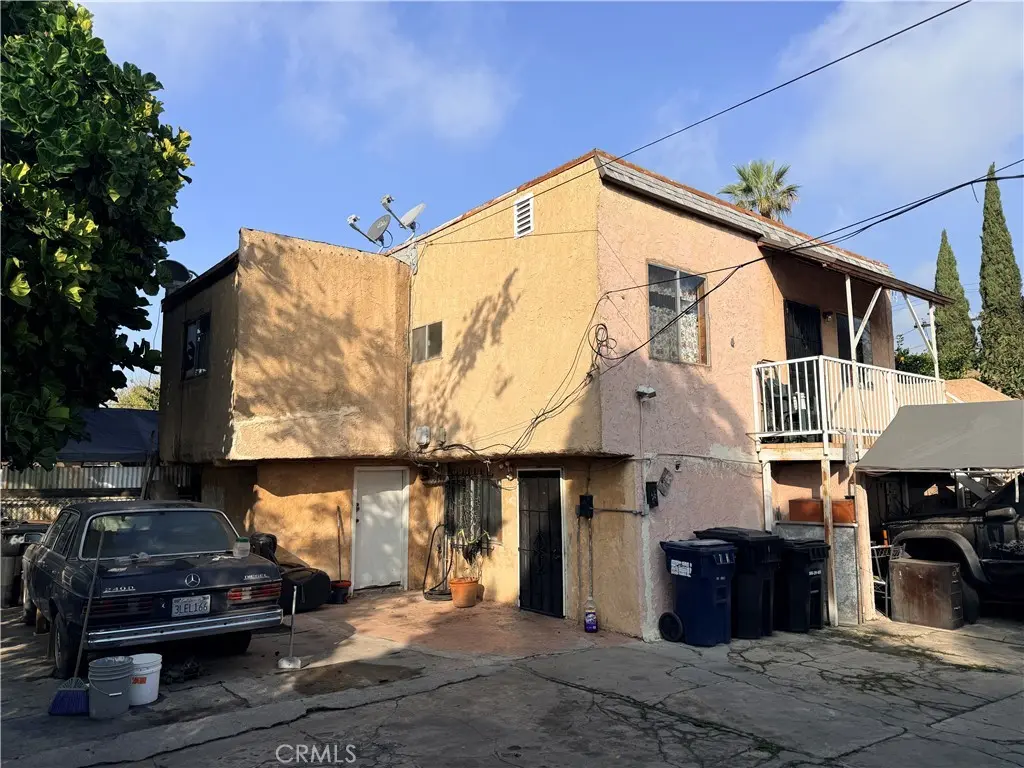
6007 Holmes · Florence-Graham, CA
Flood risk No data
- FEMA flood zone
- —
- Chance of flooding over 30 yrs
- —
- Est. flood insurance / yr
- —
Fire risk No data
- Est. fire insurance / yr
- —
Heat risk No data
- Hot days now (above threshold)
- —
- Hot days in 30 yrs
- —
Wind risk No data
- Chance of severe wind over 30 yrs
- —
Air-quality risk No data
- Unhealthy air days now
- —
- Unhealthy air days in 30 yrs
- —
Risk factors via First Street. Map © Google.
Why this score? — see what drove the B grade
The composite is a weighted blend of 9 inputs, each scored 0–100. Each bar is that input's sub-score; the figure is the points it added to the 100-point composite (weight × sub-score).
- Cash flow +29.3/30.0
- ARV discount +14.0/15.0
- DSCR +10.0/10.0
- 1% rule +8.2/10.0
- Schools +3.6/10.0
- Rent growth +2.5/5.0
- Livability +2.5/5.0
- Condition / age +2.2/5.0
- Appreciation +0.0/10.0
$739,000
🖨 Deal sheet (PDF) 📄 Offer letter ✓ Due diligence
Multi-family units
County records classify this as Multi-Family (5+ Unit). Listing-text estimate: 3 units. estimate disagrees with records
5+ unit building — per-unit beds/baths from public records are typically unavailable; the breakdown below (if shown) is an estimate from the listing text.
Listing remarks MLS
Prime Value-Add Mixed-Use Opportunity! Income + Redevelopment Upside. Attention investors, developers, and owner-users, this is the opportunity you’ve been waiting for. Rarely available mixed-use commercial/residential income property located in the Huntington Park Annex, positioned at the intersection of cash flow, value-add, and future redevelopment potential under California’s most impactful housing legislation. The property features five total units, including three residential units and two street-front retail storefronts, offering diversified income streams and strong upside. The residential unit mix includes a 1-bedroom/1-bath, 2-bedroom/1-bath, and a large 4-bedroom/2-bath unit, ideal for maximizing rental demand and repositioning potential. The retail storefronts enjoy excellent visibility and are well-suited for owner-users, service-based businesses, or continued leasing. The property requires repairs and capital improvements, making it an ideal acquisition for investors seeking a true value-add play. Bring your contractor and your vision - this asset is ready to be repositioned for higher income and long-term appreciation. With the passage of AB 2011 and SB 6, certain mixed-use and commercial properties may qualify for residential conversion, adaptive reuse, or increased residential density, subject to buyer’s independent verification and compliance with all applicable requirements. These laws, effective through July 1, 2033, create a powerful window of opportunity to unlock additional units, reconfigure existing space, or redevelop to meet the severe housing shortage across Los Angeles County. Perfect for: 1) Investors seeking current income with redevelopment upside, 2) 1031 exchange buyers looking to defer taxes and add value. 3) Developers targeting density and adaptive reuse opportunities. 4) Owner-users who want to operate a business while generating rental income. Properties offering this combination of location, mixed-use zoning, legislative tailwinds, and value-add potential are becoming increasingly scarce. High demand urban corridor. Strong upside. Time-sensitive opportunity. Buyer to conduct all investigations regarding zoning, permits, unit count, condition, and potential uses. Submit offers - this asset will not last.
Key facts
- Value-add play
- Excellent visibility
- Retail storefronts
Tags
Neighborhood map
What this means for you Summary
Snapshot
- This is a 3 × 3-bed/?-bath units multifamily listed at $739k. Condition is rated fair.
Deal economics
- At list price, monthly cash flow is $3k ($31k/yr) — positive. Per door: $869/mo.
- The deal already cash-flows at list — no discount required.
- Meets the 1% rule at list price ($10k rent vs $739k).
- Recommended offer: $650k (12.0% below list) — sets the bar for market timing.
- Cap rate 10.5% vs local median 4.1% in Florence-Graham — top-decile yield for the area; either an underpriced asset or a hidden risk that comps aren't pricing in. Stress-test before assuming the spread holds.
Location & tenants
- Location reads: area grade B — affects rentability + tenant quality, not the cash-flow math above.
- Los Angeles Unified (urban): math 29% / reading 54% proficiency, ranked #223 of 517 in CA (top 43%) — families likely to look elsewhere, expect single-tenant / working-renter base with shorter leases; 67% free/reduced lunch — lower-income household profile, screen leases tightly.
- Zoned schools: Lillian Street Elementary (352 students, 97% FRL); Thomas A. Edison Middle (876 students, 99% FRL); Huntington Park Senior High (math 17% / reading 52%, grade F, #618 of 1,170 statewide, top 56%, 1,465 students, 97% FRL) — zoned schools average 97% FRL vs 67% district-wide (30 pts higher); higher-poverty schools than district average — tighter screening recommended.
- Market conditions: 52 active listings in the ZIP; 19,697 units permitted in Los Angeles County in 2024 (9,426 in 5+ unit buildings).
- At $9,766/mo this rent would consume 193% of the median local household income ($61k/yr) (locally 2573% of renters already pay >50% of income on rent) — very limited rent-growth headroom before tenants either downsize or default.
Forward outlook
- Local home prices are declining (-3.0%/yr); year-one equity from $5k of loan paydown is wiped out by about $22k of value loss. Plan a longer hold.
- Los Angeles County population projected at +9% by 2050 — modest demand growth; plan on rents tracking national, not racing it.
- At projected returns (-3.0% appreciation + 3.0% rent growth), your $207k cash investment doubles in ~8 years — after that, you're playing with house money.
Negotiation context
- It's been on market 144 days — a 12% lower offer ($650k) is reasonable based on typical stale-listing flexibility.
- 5 sale attempts since 3y ago with the ask held roughly flat each time — persistent listings suggest the price (not the market) is what's stuck; bring a comps-based counter.
Risks & watch-outs
- Watch-outs: built in 1926 — expect roof / HVAC / electrical / plumbing capex.
Questions for the listing agent
- It's been on market 144 days. Have you received any prior offers? Is the seller open to a 12% concession, seller financing, or rate buy-down credit?
- Can we see the unit-by-unit rent roll, current vacancy, and any below-market leases? What's the average tenancy length?
- What capital expenditures (roof, boiler, parking lot, exteriors) have been made in the last 5 years, and what's planned in the next 2?
- Have any recent inspections been done? Can we get a copy of the seller's disclosures and any deferred-maintenance estimates?
- Built in 1926 — when were the roof, HVAC, electrical panel, plumbing, and water heater last replaced?
- Why hasn't it sold? Are there any deal-killer items the seller is aware of (foundation, flood, title, zoning, code violations)?
- Is there a deadline driving the sale (1031 exchange, divorce, estate, relocation)? That informs how much negotiation room exists.
- What's the average days-on-market for RENTAL listings here right now (not sales)? A rising rental-DOM trend means longer vacancies and softer asking-rent achievability than the comps imply.
- What's the recent tenant-quality profile in this submarket — average credit score on applications, eviction rate, late-payment / NSF rate, and stable-employment percentage? A property-management company in the area should have these aggregated.
- How much new apartment / multifamily construction is in the pipeline within 1–3 miles? Heavy new supply (>2% of stock underway) typically softens rents 12–24 months out; light construction supports rent growth.
Investment metrics
- 1% rule
- 1.32% ✓
- Cap rate
- 10.53%
- Cash-on-cash
- 15.13%
- DSCR
- 1.67
- GRM
- 6.3
CMA / ARV
- ARV (median comp)
- $862,723
- List price
- $739,000
- Delta
- -14.34%
- Verdict
- UNDERPRICED
- Comps
- 20 within 1.0 mi
Show comp detail 6 sales within ~0.75 mi
| Address | Dist | Beds/Ba | Sqft | Sold | Price | $/sf | Match |
|---|---|---|---|---|---|---|---|
| 6101 Makee Ave | 0.30mi | 9/5.0 | 3,306 (-2%) | 17mo | $1,130,000 | $342 | 68 |
| 6401 Converse Ave | 0.33mi | 8/5.0 (-1) | 3,224 (-5%) | 8mo | $1,340,000 | $416 | 65 |
| 6425 Cottage St | 0.53mi | 8/4.5 (-1) | 3,642 (+7%) | 7mo | $1,075,000 | $295 | 50 |
| 1518 E 55th St | 0.60mi | 10/6.0 (+1) | 3,461 (+2%) | 20mo | $950,000 | $274 | 43 |
| 5604 Fortuna | 0.50mi | 8/4.0 (-1) | 2,904 (-14%) | 1mo | $855,000 | $294 | 42 |
| 6616-6618 S Makee Ave | 0.49mi | 8/7.0 (-1) | 3,767 (+11%) | 23mo | $900,000 | $239 | 27 |
Match score weights: distance 35% · size 25% · config 20% · recency 20%. Top-matched comps best support the ARV.
Projected returns pro-forma
-3.0% appreciation · 3.0% rent growth · sell at horizon
- IRR
- 5.8%
- Equity multiple
- 1.22×
- Total profit
- $46,507
- Equity at exit
- $110,187
- IRR
- 15.2%
- Equity multiple
- 2.23×
- Total profit
- $254,989
- Equity at exit
- $63,895
Cash invested: $206,920 (down + closing). Projections, not guarantees.
Landlord ↔ Tenant lean methodology
- Overall (STATE)
- 18 Strongly Tenant-Friendly
- State California
- 18 Strongly Tenant-Friendly · D+13
- County
- — inherits STATE
- City
- — inherits STATE
ZIP-level market 90001
- Active inventory
- 52
- Price-to-rent
- 18.9×
Monthly cashflow live
- Estimated rent
- $9,766 high interval (Pro) →
- Mortgage (P&I)
- −$3,875
- Tax est. 1.5%
- −$924 /mo · $11,085/yr
- Insurance
- −$308
- HOA
- −$0
- Vacancy / Maint / Mgmt
- −$2,051
- Net cashflow
- $2,608
Break-even live
Sensitivity live
| Price | -10% $3,119 | -5% $2,863 | +0% $2,608 | +5% $2,353 | +10% $2,097 |
|---|---|---|---|---|---|
| Rent | -10% $1,837 | -5% $2,222 | +0% $2,608 | +5% $2,994 | +10% $3,380 |
| Rate | -1.0pp $2,980 | -0.5pp $2,796 | base $2,608 | +0.5pp $2,417 | +1.0pp $2,222 |
3-unit breakdown (identical units grouped — click to expand)
| Units | Beds | Baths | Est. rent |
|---|---|---|---|
| 3× units | 3 | — | $9,765 |
| #1 | 3 | — | $3,255 |
| #2 | 3 | — | $3,255 |
| #3 | 3 | — | $3,255 |
| Total (3 units) | $9,766 | ||
UW: 25.0% down · 7.5% · 30yr · 1.5% tax · 5.0% vac · 8.0% maint · 8.0% mgmt
Financing live
Cash to close
- Down payment
- $184,750
- Closing costs
- $22,170
- Reserves months
- —
- Total cash needed
- —
Loan-product check · same deal, 3 products live
Conventional
25% down · 7.5% · 30yr
- Down + closing
- —
- Monthly P&I
- —
- Monthly cashflow
- —
- DSCR
- —
- Eligible?
- —
Personal DTI + credit; lowest rate.
DSCR
20% down · 8.5% · 30yr
- Down + closing
- —
- Monthly P&I
- —
- Monthly cashflow
- —
- DSCR
- —
- Eligible?
- —
No personal income docs; deal must DSCR.
Hard money
10% down · 12.0% · 12mo
- Down + closing
- —
- Monthly P&I
- —
- Monthly cashflow
- —
- DSCR
- —
- Eligible?
- —
Short-term bridge; refi at stabilization.
Listing history 24 events
-
2026-06-21days on market $739,000 Active 144 DOM
-
2026-06-18days on market $739,000 Active 141 DOM
-
2026-06-17days on market $739,000 Active 140 DOM
-
2026-06-16days on market $739,000 Active 139 DOM
-
2026-06-15days on market $739,000 Active 138 DOM
-
2026-06-13days on market $739,000 Active 136 DOM
-
2026-06-09days on market $739,000 Active 132 DOM
-
2026-06-08days on market $739,000 Active 131 DOM
-
2026-06-07days on market $739,000 Active 130 DOM
-
2026-06-04days on market $739,000 Active 127 DOM
-
2026-06-03days on market $739,000 Active 126 DOM
-
2026-06-02days on market $739,000 Active 125 DOM
-
2026-06-01days on market $739,000 Active 124 DOM
-
2026-05-31days on market $739,000 Active 123 DOM
-
2026-01-28$739,000 Active 2301-char remark
Show marketing remark (2301 chars)
Prime Value-Add Mixed-Use Opportunity! Income + Redevelopment Upside. Attention investors, developers, and owner-users, this is the opportunity you’ve been waiting for. Rarely available mixed-use commercial/residential income property located in the Huntington Park Annex, positioned at the intersection of cash flow, value-add, and future redevelopment potential under California’s most impactful housing legislation. The property features five total units, including three residential units and two street-front retail storefronts, offering diversified income streams and strong upside. The residential unit mix includes a 1-bedroom/1-bath, 2-bedroom/1-bath, and a large 4-bedroom/2-bath unit, ideal for maximizing rental demand and repositioning potential. The retail storefronts enjoy excellent visibility and are well-suited for owner-users, service-based businesses, or continued leasing. The property requires repairs and capital improvements, making it an ideal acquisition for investors seeking a true value-add play. Bring your contractor and your vision - this asset is ready to be repositioned for higher income and long-term appreciation. With the passage of AB 2011 and SB 6, certain mixed-use and commercial properties may qualify for residential conversion, adaptive reuse, or increased residential density, subject to buyer’s independent verification and compliance with all applicable requirements. These laws, effective through July 1, 2033, create a powerful window of opportunity to unlock additional units, reconfigure existing space, or redevelop to meet the severe housing shortage across Los Angeles County. Perfect for: 1) Investors seeking current income with redevelopment upside, 2) 1031 exchange buyers looking to defer taxes and add value. 3) Developers targeting density and adaptive reuse opportunities. 4) Owner-users who want to operate a business while generating rental income. Properties offering this combination of location, mixed-use zoning, legislative tailwinds, and value-add potential are becoming increasingly scarce. High demand urban corridor. Strong upside. Time-sensitive opportunity. Buyer to conduct all investigations regarding zoning, permits, unit count, condition, and potential uses. Submit offers - this asset will not last.
-
2024-07-05historical
-
2024-05-08status Active
-
2024-04-11status Pending Sale
-
2024-02-22price $699,000
-
2024-01-30$850,000 Active
-
2023-11-13historical
-
2023-11-01status Active
-
2023-10-31price $899,000
-
2023-10-02$925,000 Active
ⓘ Source: listings_history table (triggers on properties + properties_extension) + one-shot
backfill from property_details.listing_events for pre-trigger history.
Nearby sold comps map
Loading sold comps map…
Walkable amenities ~0.75 mi
Loading nearby amenities…
Taxation est. · year 1
- Rental income
- $117,192
- − Mortgage interest
- −$41,395
- − Property taxes
- −$11,085
- − Insurance
- −$3,695
- − Repairs & maintenance
- −$9,375
- − Management
- −$9,375
- − Depreciation
- −$21,498
- Taxable income
- $20,768
- Est. tax owed @ 24.0%
- −$4,984
- After-tax cash flow
- $26,313/yr
For passive investors: Depreciation is non-cash, so a rental often shows a tax loss while cash-flowing — sheltering income. Rental losses are passive: they offset passive income freely, and up to $25,000/yr can offset ordinary (W-2) income if you actively participate and your MAGI is under $100k (phasing out to $0 by $150k); unused losses carry forward. On sale, claimed depreciation is recaptured at up to 25%, and gains may owe capital-gains tax (a 1031 exchange can defer both). Figures are a year-1 estimate at your 24.0% rate — not tax advice; consult a CPA.
Condition & rehab AI · 12 photos
This mixed-use property requires significant exterior and interior renovations to improve its condition and value.
Repairs flagged
- Major exterior walls — Severe weathering and peeling paint
- Major roof — Rusty and aged
- Major flooring — Concrete driveway and sidewalk in poor condition
- Major interior walls/paint — Painted walls with visible wear and tear
Value-add opportunities
- Both exterior renovation — Improves curb appeal and rental value
- Both HVAC/mechanicals upgrade — Enhances comfort and energy efficiency
- Both interior paint and updates — Enhances aesthetics and rental value
Renovation cost estimate screening
| Repair item | Severity | Est. cost |
|---|---|---|
| exterior walls · Severe weathering and peeling paint | Major | $15,000–50,000 |
| roof · Rusty and aged | Major | $15,000–50,000 |
| flooring · Concrete driveway and sidewalk in poor condition | Major | $15,000–50,000 |
| interior walls/paint · Painted walls with visible wear and tear | Major | $15,000–50,000 |
| Total estimated repair cost · 4 items | $60,000–200,000 |
Value-add ROI direction
- Both exterior renovation — Improves curb appeal and rental value ↑
- Both HVAC/mechanicals upgrade — Enhances comfort and energy efficiency ↑
- Both interior paint and updates — Enhances aesthetics and rental value ↑
ⓘ Cost ranges are severity-bucket heuristics (US national rule-of-thumb). Get contractor quotes + a written scope before underwriting a rehab budget.
Schools (NCES district)
- District
- Los Angeles Unified
- NCES district ID
- 0622710
- Math proficiency
- 29% ▼ -4.00%
- Reading proficiency
- 54% ▲ 10.00%
- Median HH income
- $50,403
- Composite
- 35.67/100
- National rank
- #4875
- State rank
- #223 of 517 in CA
Livability — Florence-Graham
No livability data for this city. (Only ~50 U.S. cities are tracked.)
Census & demographics
- Census place
- Florence-Graham, CA
- County
- Los Angeles County · 9,444,647 people
- City population
- 56,189
- Metro
- Los Angeles-Long Beach-Anaheim, CA
- Population (ZIP)
- 56,189
- Household income
- $60,767
- Rent vs Own
- Severe rent burden
- 2573.0
Population outlook (Los Angeles County) Hauer SSP2
- Today (2025)
- 10,940,515 people
- By 2030
- 11,256,481 · +2.9%
- By 2040
- 11,729,929 · +7.2%
- By 2050
- 11,948,407 · +9.2%
- By 2075
- 11,818,114 · +8.0%
- By 2100
- 10,842,928 · -0.9%
Race, ethnicity, and origin ACS 2023
- Neighborhood character
- Predominantly Hispanic (91%)
- Race & ethnicity
- Hispanic / Latino 91% Two or more races 29% Black 7% Native American 3%
- Hispanic origin (detail)
- Mexican 74%
- Foreign-born
- 40% · Canada
- Languages at home
- 16% English-only · Spanish 83%
Political lean MEDSL · Los Angeles
- 2024 margin
- Solid D (+32.9) · D 64.8% · R 31.9% · Other 3.3%
- 2008→2024 swing
- -7.4pp toward R · 2008: 40.4pp · 2024: 32.9pp
- All cycles
- 2024: D+32.9 2020: D+44.2 2016: D+48.0 2012: D+40.0 2008: D+40.4
Not yet ingested
- Civics
- —
Market trends
- HPI YoY
- ▼ -558.17%
- Current HPI
- 447.307
- Rent YoY
- —
- Metro
- Los Angeles-Long Beach-Anaheim, CA
- State GDP YoY
- ▲ 3.21%
- F500 in state
- 116
Industry mix (Fortune 500 HQ in CA)
| Industry | F500 HQs | Revenue |
|---|---|---|
| Technology | 27 | $1,492B |
|
||
| Financial Services | 3 | $174B |
|
||
| Retail | 3 | $44B |
|
||
| Insurance | 3 | $26B |
|
||
| Media / Entertainment | 2 | $115B |
|
||
| Pharmaceuticals / Biotech | 2 | $62B |
|
||
Price history
-20.1% since first listed10 events — show timeline
- 2026-01-28 Listed $739,000 CRMLS
- 2024-07-05 Listing Removed — CRMLS
- 2024-05-08 Relisted — CRMLS
- 2024-04-11 Pending — CRMLS
- 2024-02-22 Price Changed $699,000 CRMLS
- 2024-01-30 Listed $850,000 CRMLS
- 2023-11-13 Listing Removed — CRMLS
- 2023-11-01 Relisted — CRMLS
- 2023-10-31 Price Changed $899,000 CRMLS
- 2023-10-02 Listed $925,000 CRMLS
Cash-flow waterfall
monthlySold comps — $/sqft
last 12 mo · ≤1 miLoading sold comps…