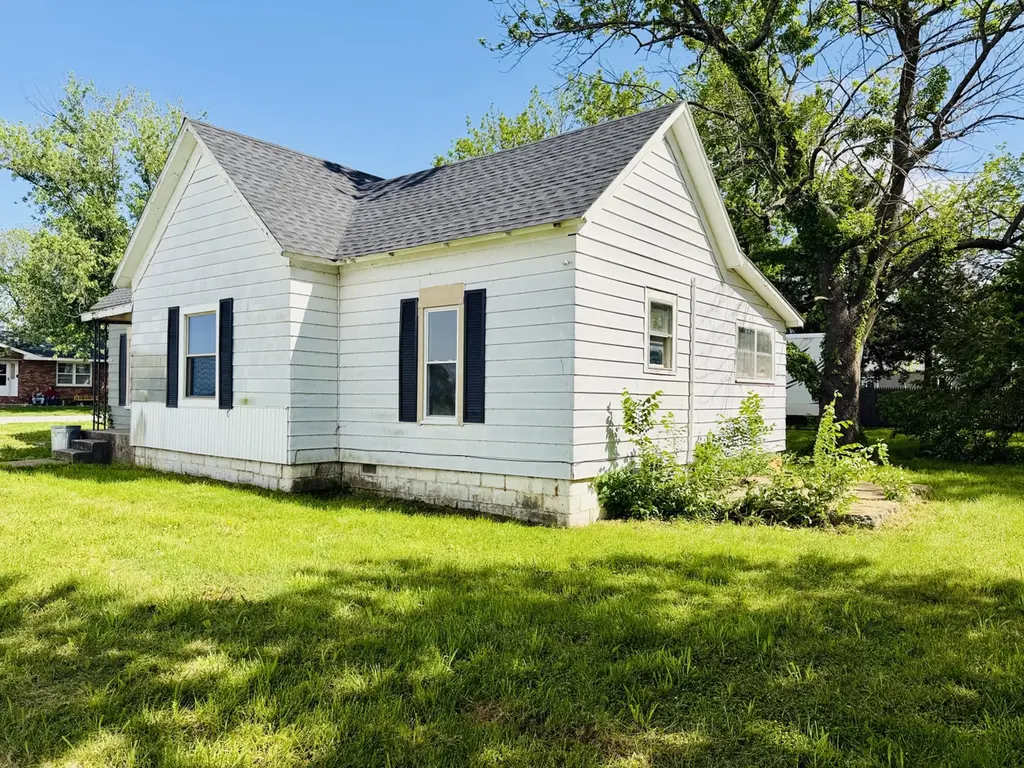
311 E 7th St · Lockwood, MO
Flood risk 1/10 · Minimal
- FEMA flood zone
- X (unshaded)
- Chance of flooding over 30 yrs
- 0.0%
- Est. flood insurance / yr
- $507 – $1,088
Fire risk 2/10 · Minimal
- Est. fire insurance / yr
- $1,054 – $1,958
Heat risk 5/10 · Moderate
- Hot days now (above 107°F)
- 7 days/yr
- Hot days in 30 yrs
- 19 days/yr
Wind risk 2/10 · Minimal
- Chance of severe wind over 30 yrs
- 2.0%
Air-quality risk 2/10 · Minimal
- Unhealthy air days now
- 1 days/yr
- Unhealthy air days in 30 yrs
- 1 days/yr
Risk factors via First Street. Map © Google.
Why this score? — see what drove the B grade
The composite is a weighted blend of 9 inputs, each scored 0–100. Each bar is that input's sub-score; the figure is the points it added to the 100-point composite (weight × sub-score).
- Cash flow +30.0/30.0
- DSCR +10.0/10.0
- Appreciation +7.9/10.0
- 1% rule +7.8/10.0
- ARV discount +7.5/15.0
- Livability +3.4/5.0
- Schools +3.2/10.0
- Rent growth +2.5/5.0
- Condition / age +2.5/5.0
$75,900
🖨 Deal sheet (PDF) 📄 Offer letter ✓ Due diligence
Listing remarks
Starter home? Investment? This one can be both!This freshly remodeled home offers a large living room, an open kitchen and dining area, plus a large utility/laundry room with exterior access. You'll also find two generously sized bedrooms and a full bathroom. The inside is move-in ready, while the exterior gives you the opportunity to make it your own. With new mini-splits, a new water heater, and a new roof already in place, the big-ticket items are handled. Sitting on a quiet corner lot in Lockwood--this one is ready for its next owner.
Key facts
- 5,227 sq ft lot
- Built 1945
- Listed 50 days
Property features AI
Exterior
- Parking: Driveway
- Utilities: Public water; Public sewer
- Home design: Single-family residence; One story
- Construction: Aluminum siding; Composition roof
- Exterior features: Front porch; Corner lot; City street frontage; Asphalt road (publicly maintained); Has a view
Interior
- Flooring: Laminate flooring
- Bathrooms: 1 full bathroom
- Heating & cooling: Electric heating; Ceiling fan(s) for cooling
- Interior features: High ceilings
- Laundry & utility: Laundry on the main level; Electric water heater
Neighborhood map
What this means for you Summary
Snapshot
- This is a 2-bed/1.0-bath other listed at $76k.
Deal economics
- At list price, monthly cash flow is $313 ($4k/yr) — positive.
- The deal already cash-flows at list — no discount required.
- Meets the 1% rule at list price ($975 rent vs $76k).
- Recommended offer: $74k (3.0% below list) — sets the bar for market timing.
Location & tenants
- Location reads 68/100 on livability (#180 in MO) — a middle-class / working-renter tenant base. Strengths: cost of living A+, housing A+, crime A-; Watch: amenities F, commute F, employment F.
- Lockwood R-I (rural): math 30% / reading 40% proficiency, ranked #398 of 535 in MO (top 74%) — families likely to look elsewhere, expect single-tenant / working-renter base with shorter leases.
- Zoned schools: Lockwood Elem. (math 42% / reading 37%, grade F, #537 of 1,115 statewide, top 53%, 150 students, 56% FRL); Lockwood Middle School (math 15% / reading 34%, grade F, #323 of 391 statewide, top 83%, 50 students, 58% FRL); Lockwood High (math 30% / reading 50%, grade F, #244 of 521 statewide, top 47%, 97 students, 50% FRL) — zoned schools at 55% FRL track the district average.
- Market conditions: 10 active listings in the ZIP.
Forward outlook
- In year one you build about $5k of equity ($525 loan paydown + $4k appreciation (5.9% local appreciation)).
- Dade County population projected at -24% by 2050 — secular population decline; favor cash flow + early exit over multi-decade hold.
- At projected returns (5.9% appreciation + 3.0% rent growth), your $21k cash investment doubles in ~3 years — after that, you're playing with house money.
- By year 7, paydown + projected appreciation supports a ~$33k cash-out refi (75% LTV) — recoverable capital for the next deal without selling this one.
Negotiation context
- It's been on market 50 days — a 3% lower offer ($74k) is reasonable based on typical stale-listing flexibility.
- 10 sale attempts since 18y ago with the ask held roughly flat each time — persistent listings suggest the price (not the market) is what's stuck; bring a comps-based counter.
Risks & watch-outs
- Watch-outs: built in 1945 — expect roof / HVAC / electrical / plumbing capex.
- Climate carrying-cost: extreme-heat days projected 7→19/yr by 2055 (HVAC capex compounding) — expect insurance premiums to compound above CPI over the hold.
Questions for the listing agent
- It's been on market 50 days. Have you received any prior offers? Is the seller open to a 3% concession, seller financing, or rate buy-down credit?
- Built in 1945 — when were the roof, HVAC, electrical panel, plumbing, and water heater last replaced?
- Is there a deadline driving the sale (1031 exchange, divorce, estate, relocation)? That informs how much negotiation room exists.
- What's the average days-on-market for RENTAL listings here right now (not sales)? A rising rental-DOM trend means longer vacancies and softer asking-rent achievability than the comps imply.
- What's the recent tenant-quality profile in this submarket — average credit score on applications, eviction rate, late-payment / NSF rate, and stable-employment percentage? A property-management company in the area should have these aggregated.
- How much new for-sale + rental construction is in the pipeline within 1–3 miles? Heavy new supply typically softens prices + rents 12–24 months out; constrained supply supports both.
Investment metrics
- 1% rule
- 1.28% ✓
- Cap rate
- 11.25%
- Cash-on-cash
- 17.70%
- DSCR
- 1.79
- GRM
- 6.5
CMA / ARV
No comps found within radius.
Projected returns pro-forma
5.86% appreciation · 3.0% rent growth · sell at horizon
- IRR
- 29.9%
- Equity multiple
- 2.94×
- Total profit
- $41,216
- Equity at exit
- $47,039
- IRR
- 27.9%
- Equity multiple
- 5.97×
- Total profit
- $105,720
- Equity at exit
- $84,728
Cash invested: $21,252 (down + closing). Projections, not guarantees.
Landlord ↔ Tenant lean methodology
- Overall (STATE)
- 81 Strongly Landlord-Friendly
- State Missouri
- 81 Strongly Landlord-Friendly · R+10
- County
- — inherits STATE
- City
- — inherits STATE
ZIP-level market 65682
- Home prices YoY
- 3.2%
- Active inventory
- 10
- Price-to-rent
- 6.5×
Monthly cashflow live
- Estimated rent
- $975 medium interval (Pro) →
- Mortgage (P&I)
- −$398
- Tax from tax record
- −$27 /mo · $324/yr
- Insurance
- −$32
- HOA
- −$0
- Vacancy / Maint / Mgmt
- −$205
- Net cashflow
- $313
Break-even live
Sensitivity live
| Price | -10% $356 | -5% $335 | +0% $313 | +5% $292 | +10% $270 |
|---|---|---|---|---|---|
| Rent | -10% $236 | -5% $275 | +0% $313 | +5% $352 | +10% $390 |
| Rate | -1.0pp $352 | -0.5pp $333 | base $313 | +0.5pp $294 | +1.0pp $274 |
UW: 25.0% down · 7.5% · 30yr · 1.5% tax · 5.0% vac · 8.0% maint · 8.0% mgmt
Financing live
Cash to close
- Down payment
- $18,975
- Closing costs
- $2,277
- Reserves months
- —
- Total cash needed
- —
Loan-product check · same deal, 3 products live
Conventional
25% down · 7.5% · 30yr
- Down + closing
- —
- Monthly P&I
- —
- Monthly cashflow
- —
- DSCR
- —
- Eligible?
- —
Personal DTI + credit; lowest rate.
DSCR
20% down · 8.5% · 30yr
- Down + closing
- —
- Monthly P&I
- —
- Monthly cashflow
- —
- DSCR
- —
- Eligible?
- —
No personal income docs; deal must DSCR.
Hard money
10% down · 12.0% · 12mo
- Down + closing
- —
- Monthly P&I
- —
- Monthly cashflow
- —
- DSCR
- —
- Eligible?
- —
Short-term bridge; refi at stabilization.
Listing history 34 events
-
2026-06-21statusdays on market $75,900 Pending 50 DOM
-
2026-06-18days on market $75,900 Active 49 DOM
-
2026-06-17days on market $75,900 Active 48 DOM
-
2026-06-16days on market $75,900 Active 47 DOM
-
2026-06-15days on market $75,900 Active 46 DOM
-
2026-06-13days on market $75,900 Active 44 DOM
-
2026-06-12days on market $75,900 Active 43 DOM
-
2026-06-09days on market $75,900 Active 40 DOM
-
2026-06-08days on market $75,900 Active 39 DOM
-
2026-06-07days on market $75,900 Active 38 DOM
-
2026-06-07days on market $75,900 Active 37 DOM
-
2026-06-04days on market $75,900 Active 34 DOM
-
2026-06-02days on market $75,900 Active 33 DOM
-
2026-06-01days on market $75,900 Active 32 DOM
-
2026-05-31days on market $75,900 Active 31 DOM
-
2026-04-29$75,900 Active 544-char remark
-
2026-03-31price $90,000
-
2026-02-27$110,000 Active
-
2024-02-20soldstatus Closed
-
2024-02-20soldstatus Closed
-
2024-01-31status Pending
-
2024-01-31status Pending
-
2024-01-18$29,900 Active
-
2024-01-17$29,900 Active
-
2021-10-08soldstatus
-
2021-07-11$49,900
-
2019-04-26soldstatus
-
2018-08-25$14,950
-
2013-01-31historical
-
2012-01-19$19,900
-
2009-03-05historical
-
2008-09-05$39,900
-
2008-02-20$39,900
-
2008-02-20$39,900
ⓘ Source: listings_history table (triggers on properties + properties_extension) + one-shot
backfill from property_details.listing_events for pre-trigger history.
Tax reassessment forecast MO · Resets to sale price
- Current annual tax
- $324 · $27/mo
- Projected year-2 tax
- $736 · $61/mo
- Expected delta
- +$412/yr (+$34/mo · 127.1%)
ⓘ Screening estimate from a state-policy table — verify with the county assessor before closing.
Climate risk First Street
- Flood 1/10 Low FEMA zone X (unshaded) · 0% chance over 30 yrs
- Wildfire 2/10 Low
- Heat 5/10 Major 7 d/yr ≥107°F today · 19 d/yr by 30 yrs out
- Wind 2/10 Low 2% chance of damaging wind over 30 yrs
- Air quality 2/10 Low 1 unhealthy d/yr today · 1 by 30 yrs out
Nearby sold comps map
Loading sold comps map…
Walkable amenities ~0.75 mi
Loading nearby amenities…
Taxation est. · year 1
- Rental income
- $11,698
- − Mortgage interest
- −$4,252
- − Property taxes
- −$324
- − Insurance
- −$380
- − Repairs & maintenance
- −$936
- − Management
- −$936
- − Depreciation
- −$2,208
- Taxable income
- $2,663
- Est. tax owed @ 24.0%
- −$639
- After-tax cash flow
- $3,122/yr
For passive investors: Depreciation is non-cash, so a rental often shows a tax loss while cash-flowing — sheltering income. Rental losses are passive: they offset passive income freely, and up to $25,000/yr can offset ordinary (W-2) income if you actively participate and your MAGI is under $100k (phasing out to $0 by $150k); unused losses carry forward. On sale, claimed depreciation is recaptured at up to 25%, and gains may owe capital-gains tax (a 1031 exchange can defer both). Figures are a year-1 estimate at your 24.0% rate — not tax advice; consult a CPA.
Schools (NCES district)
- District
- Lockwood R-I
- NCES district ID
- 2919140
- Math proficiency
- 30% ▲ 10.00%
- Reading proficiency
- 40% ▲ 5.00%
- Median HH income
- $37,486
- Composite
- 31.77/100
- National rank
- #11093
- State rank
- #398 of 535 in MO
Livability — Lockwood
- Score
- 68/100
- State rank
- #180
- US rank
- #9478
Category grades
Schools grade is shown separately in the Schools card above.
Census & demographics
- Census place
- Lockwood, MO
- Population (ZIP)
- 2,079
Population outlook (Dade County) Hauer SSP2
- Today (2025)
- 7,043 people
- By 2030
- 6,687 · -5.1%
- By 2040
- 5,989 · -15.0%
- By 2050
- 5,324 · -24.4%
- By 2075
- 4,122 · -41.5%
- By 2100
- 3,168 · -55.0%
Race, ethnicity, and origin ACS 2023
- Neighborhood character
- Predominantly White (96%)
- Race & ethnicity
- White 96% Two or more races 4% Hispanic / Latino 1%
- Common ancestry
- Lithuanian 6% Italian 3% Slovak 2%
- Foreign-born
- 1% · Canada
- Languages at home
- 99% English-only · Spanish 1%
Political lean MEDSL · Dade
- 2024 margin
- Solid R (+67.1) · D 16.0% · R 83.2%
- 2008→2024 swing
- -26.3pp toward R · 2008: -40.9pp · 2024: -67.1pp
- All cycles
- 2024: R+67.1 2020: R+67.0 2016: R+64.5 2012: R+50.2 2008: R+40.9
Not yet ingested
- Civics
- —
Market trends
- HPI YoY
- ▲ 5.86%
- Current HPI
- 190.417
- Rent YoY
- —
- Metro
- —
- State GDP YoY
- ▲ 1.84%
- F500 in state
- 20
Industry mix (Fortune 500 HQ in MO)
| Industry | F500 HQs | Revenue |
|---|---|---|
| Healthcare | 1 | $163B |
|
||
| Insurance | 1 | $21B |
|
||
| Industrial Technology | 1 | $17B |
|
||
| Retail | 1 | $16B |
|
||
| Industrial Distribution | 1 | $10B |
|
||
| Utilities | 1 | $9B |
|
||
Price history
+90.2% since first listed19 events — show timeline
- 2026-04-29 Listed $75,900 SOMO
- 2026-03-31 Price Changed $90,000 SOMO
- 2026-02-27 Listed $110,000 SOMO
- 2024-02-20 Sold (MLS) — SOMO
- 2024-02-20 Sold (MLS) — OGAR
- 2024-01-31 Pending — SOMO
- 2024-01-31 Pending — OGAR
- 2024-01-18 Listed $29,900 SOMO
- 2024-01-17 Listed $29,900 OGAR
- 2021-10-08 Sold (MLS) — OGAR
- 2021-07-11 Listed $49,900 OGAR
- 2019-04-26 Sold (MLS) — SOMO
- 2018-08-25 Listed $14,950 SOMO
- 2013-01-31 Listing Removed — Heartland MLS as Distributed by MLS Grid
- 2012-01-19 Listed $19,900 Heartland MLS as Distributed by MLS Grid
- 2009-03-05 Listing Removed — Heartland MLS as Distributed by MLS Grid
- 2008-09-05 Listed $39,900 SOMO
- 2008-02-20 Listed $39,900 SOMO
- 2008-02-20 Listed $39,900 Heartland MLS as Distributed by MLS Grid
Property tax history
+2.0%/yrLatest (2025): $324 · +8.8% YoY. Source: county tax records.
Cash-flow waterfall
monthlySold comps — $/sqft
last 12 mo · ≤1 miLoading sold comps…