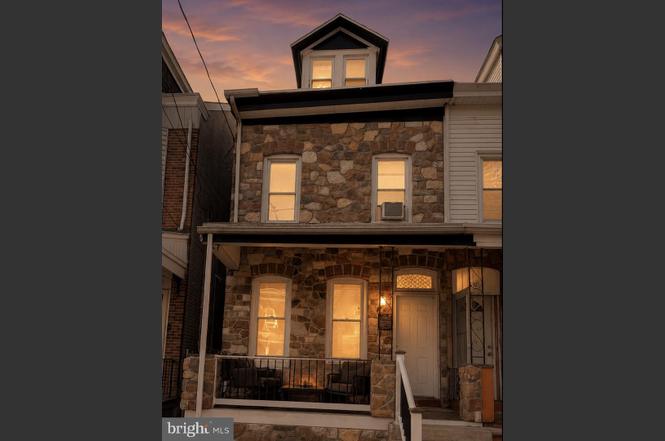
57 Garfield Ave · Trenton, NJ
Flood risk 5/10 · Moderate
- FEMA flood zone
- X (unshaded)
- Chance of flooding over 30 yrs
- 0.24%
- Est. flood insurance / yr
- $507 – $1,088
Fire risk 1/10 · Minimal
- Est. fire insurance / yr
- $526 – $976
Heat risk 7/10 · Major
- Hot days now (above 102°F)
- 7 days/yr
- Hot days in 30 yrs
- 15 days/yr
Wind risk 6/10 · Moderate
- Chance of severe wind over 30 yrs
- 27.0%
Air-quality risk 5/10 · Moderate
- Unhealthy air days now
- 6 days/yr
- Unhealthy air days in 30 yrs
- 8 days/yr
Risk factors via First Street. Map © Google.
Why this score? — see what drove the D- grade
The composite is a weighted blend of 9 inputs, each scored 0–100. Each bar is that input's sub-score; the figure is the points it added to the 100-point composite (weight × sub-score).
- Cash flow +16.8/30.0
- DSCR +5.2/10.0
- 1% rule +4.4/10.0
- Livability +3.8/5.0
- Rent growth +2.5/5.0
- Condition / age +2.5/5.0
- ARV discount +1.2/15.0
- Schools +0.7/10.0
- Appreciation +0.0/10.0
$259,000
🖨 Deal sheet (PDF) 📄 Offer letter ✓ Due diligence
Listing remarks MLS
* * * NEW Pictures added with recent updates! Beautiful residence in the heart of Trenton, close to Airport, Train Station, Shops and Restaurants! Currently rented in a month to month basis; please do not disturb occupants. When you first walk in you'll be greeted by an updated porch, inside the home you'll step into good size living room, dining room and the eat-in kitchen with plenty cabinets. Continuing on the first floor you have the laundry room, from there you step outside to a nice yard with a garage with entry from the alley or to use as storage. On the second floor are three bedrooms and one renovated bathroom (12/15)with new tiles, new floor and freshly painted; 4th bedroom is on the 3rd floor. * * * Recent updates: Bathroom was updated with New tiles, floors and fresh painted (Dec/22), New kitchen floor( Dec/22), second floor front - covered with Stone design (Dec/ 2022) This is the perfect home for an investment or for you to put your personal touch and move right in. Sale AS IS condition, buyer to obtain C. O.
Key facts
- Built 1906
- Listed 7 days
Property features AI
Exterior
- Parking: Private parking; Off-street and on-street parking available
- Utilities: Public water; Public sewer; Electric available; Natural gas available; Natural gas hot water
- Home design: Semi-detached property; Three total levels; Main entrance faces east; Above-grade and below-grade structures present; Fee simple ownership
- Construction: Brick and stone construction; Block and stone foundation; Shingle roof; Pets allowed with no restrictions; Year built per assessor
- Exterior features: Wood fencing; Level main entry; Lot dimensions approximately 15.8 x 138
Interior
- Kitchen: Refrigerator; Stove
- Bedrooms: Three bedrooms on the first upper level; One bedroom on the second upper level
- Flooring: Laminate flooring
- Bathrooms: One full bathroom (all upper levels combined: 1 full)
- Heating & cooling: Hot water baseboard heating (natural gas); Window air conditioning units
- Interior features: Traditional floor plan with a dining area and an eat-in kitchen; Drywall walls and ceilings with 9'+ ceilings
- Laundry & utility: Main-floor laundry hookups
Neighborhood map
What this means for you Summary
Snapshot
- This is a 4-bed/1.0-bath townhouse listed at $259k.
Deal economics
- At list price, monthly cash flow is $166 ($2k/yr) — positive.
- The deal already cash-flows at list — no discount required.
- To meet the 1% rule (rent ≥ 1% of price), the offer needs to be $243k (6.2% below list).
- Recommended offer: $243k (6.2% below list) — sets the bar for 1% rule.
Location & tenants
- Location reads 76/100 on livability (#133 in NJ, #3,533 nationally) — a middle-class / working-renter tenant base. Strengths: amenities A+, commute A+, health & safety A+; Watch: crime F, employment F.
- Trenton Public School District (urban): math 2% / reading 16% proficiency, ranked #471 of 472 in NJ (top 100%) — low school quality limits family demand, transient renter base, plan for 1-2y turnover; 80% free/reduced lunch — lower-income household profile, screen leases tightly.
- Zoned schools: P.J. Hill Elementary (math 3% / reading 10%, grade F, #1,289 of 1,303 statewide, top 99%, 502 students, 59% FRL); Hedgepeth Williams Elementary School (math 4% / reading 23%, grade F, #420 of 431 statewide, top 98%, 582 students, 54% FRL); Trenton Central High School - Main Campus (math 2% / reading 10%, grade F, #396 of 399 statewide, top 99%, 2,255 students, 56% FRL) — zoned schools average 56% FRL vs 80% district-wide (24 pts lower); this property's tenant base skews higher-income than the district average.
- Market conditions: 34 active listings in the ZIP; 23 comparable units currently listed for rent nearby; rentals at typical pace (median 16d on market — plan ~3-4 weeks tenant-placement turnaround); 2,256 units permitted in Mercer County in 2024 (1,303 in 5+ unit buildings).
- This rent runs 43% of the median local income ($68k/yr) — at the standard rent-burdened threshold; future hikes will face affordability resistance.
Forward outlook
- Local home prices are declining (-3.0%/yr); year-one equity from $2k of loan paydown is wiped out by about $8k of value loss. Plan a longer hold.
- Mercer County population projected at +4% by 2050 — modest demand growth; plan on rents tracking national, not racing it.
Negotiation context
- Only 7 days on market — expect competitive offers; lowballing is unlikely to land.
- 3 sale attempts since 25y ago; this cycle's ask is 24% above the opening price — seller raised mid-cycle; expect resistance to lowballs.
- Current owner paid $190k; 36% above their basis — modest negotiation headroom, anchor on the comps not their cost.
Risks & watch-outs
- Watch-outs: built in 1906 — expect roof / HVAC / electrical / plumbing capex.
- Climate carrying-cost: moderate flood risk; major wind risk, 27% chance of damaging wind over 30y; extreme-heat days projected 7→15/yr by 2055 (HVAC capex compounding) — expect insurance premiums to compound above CPI over the hold.
Questions for the listing agent
- Built in 1906 — when were the roof, HVAC, electrical panel, plumbing, and water heater last replaced?
- Is there a deadline driving the sale (1031 exchange, divorce, estate, relocation)? That informs how much negotiation room exists.
- Schools are F-rated, which usually means shorter tenancies and higher turnover. Who's the typical renter profile here, and what's been the actual vacancy rate?
- Crime grade is F in this area — have there been break-ins, vandalism, or insurance claims at this property in the last 3 years? What carrier currently insures it and at what premium?
- The area grade is low — what's the realistic commute time and amenity access for the typical tenant pool here? Any planned neighborhood developments (good or bad) we should know about?
- What's the average days-on-market for RENTAL listings here right now (not sales)? A rising rental-DOM trend means longer vacancies and softer asking-rent achievability than the comps imply.
- What's the recent tenant-quality profile in this submarket — average credit score on applications, eviction rate, late-payment / NSF rate, and stable-employment percentage? A property-management company in the area should have these aggregated.
- How much new for-sale + rental construction is in the pipeline within 1–3 miles? Heavy new supply typically softens prices + rents 12–24 months out; constrained supply supports both.
Investment metrics
- 1% rule
- 0.94% ✗
- Cap rate
- 7.06%
- Cash-on-cash
- 2.75%
- DSCR
- 1.12
- GRM
- 8.9
CMA / ARV
- ARV (on-the-fly)
- $227,328
- Comps found
- 12
Show comp detail 12 sales within ~0.75 mi
| Address | Dist | Beds/Ba | Sqft | Sold | Price | $/sf | Match |
|---|---|---|---|---|---|---|---|
| 116 Cleveland Ave | 0.11mi | 3/1.0 (-1) | 1,284 (+8%) | 4mo | $215,000 | $167 | 73 |
| 50 Mechanics Ave | 0.55mi | 3/1.0 (-1) | 1,200 (+1%) | 1mo | $117,500 | $98 | 66 |
| 1109 Nottingham Way | 0.58mi | 3/1.0 (-1) | 1,198 (+1%) | 2mo | $230,000 | $192 | 65 |
| 503 Tyler St | 0.70mi | 4/1.0 | 1,172 (-1%) | 2mo | $235,000 | $201 | 64 |
| 277 Norway Ave | 0.45mi | 3/1.5 (-1) | 1,240 (+5%) | 0mo | $330,000 | $266 | 64 |
| 541 Emmett Ave | 0.74mi | 4/1.5 | 1,204 (+2%) | 1mo | $275,000 | $228 | 59 |
| 508 Monmouth St | 0.70mi | 3/1.0 (-1) | 1,192 (+1%) | 3mo | $160,000 | $134 | 59 |
| 417 Walnut Ave | 0.26mi | 3/1.0 (-1) | 1,030 (-13%) | 3mo | $205,000 | $199 | 59 |
| 1267 Nottingham Way | 0.68mi | 4/1.0 | 1,102 (-7%) | 3mo | $202,000 | $183 | 54 |
| 25 Mckinley Ave | 0.70mi | 4/1.5 | 1,274 (+8%) | 0mo | $300,000 | $235 | 52 |
| 239 Tioga St | 0.47mi | 3/1.0 (-1) | 1,040 (-12%) | 2mo | $160,000 | $154 | 51 |
| 30 Mechanics Ave | 0.55mi | 3/1.5 (-1) | 1,092 (-8%) | 5mo | $103,200 | $95 | 50 |
Match score weights: distance 35% · size 25% · config 20% · recency 20%. Top-matched comps best support the ARV.
Projected returns pro-forma
-3.0% appreciation · 3.0% rent growth · sell at horizon
- IRR
- -11.9%
- Equity multiple
- 0.57×
- Total profit
- $-31,360
- Equity at exit
- $38,618
- IRR
- -2.8%
- Equity multiple
- 0.81×
- Total profit
- $-13,609
- Equity at exit
- $22,394
Cash invested: $72,520 (down + closing). Projections, not guarantees.
Landlord ↔ Tenant lean methodology
- Overall (STATE)
- 21 Tenant-Leaning
- State New Jersey
- 21 Tenant-Leaning · D+6
- County
- — inherits STATE
- City
- — inherits STATE
ZIP-level market 08609
- Home prices YoY
- -29.3%
- Active inventory
- 34
- Price-to-rent
- 8.9×
Monthly cashflow live
- Estimated rent
- $2,429 high interval (Pro) →
- Mortgage (P&I)
- −$1,358
- Tax from tax record
- −$286 /mo · $3,434/yr
- Insurance
- −$108
- HOA
- −$0
- Vacancy / Maint / Mgmt
- −$510
- Net cashflow
- $166
Break-even live
Sensitivity live
| Price | -10% $313 | -5% $240 | +0% $166 | +5% $93 | +10% $20 |
|---|---|---|---|---|---|
| Rent | -10% $-26 | -5% $70 | +0% $166 | +5% $262 | +10% $358 |
| Rate | -1.0pp $297 | -0.5pp $232 | base $166 | +0.5pp $99 | +1.0pp $31 |
UW: 25.0% down · 7.5% · 30yr · 1.5% tax · 5.0% vac · 8.0% maint · 8.0% mgmt
Financing live
Cash to close
- Down payment
- $64,750
- Closing costs
- $7,770
- Reserves months
- —
- Total cash needed
- —
Loan-product check · same deal, 3 products live
Conventional
25% down · 7.5% · 30yr
- Down + closing
- —
- Monthly P&I
- —
- Monthly cashflow
- —
- DSCR
- —
- Eligible?
- —
Personal DTI + credit; lowest rate.
DSCR
20% down · 8.5% · 30yr
- Down + closing
- —
- Monthly P&I
- —
- Monthly cashflow
- —
- DSCR
- —
- Eligible?
- —
No personal income docs; deal must DSCR.
Hard money
10% down · 12.0% · 12mo
- Down + closing
- —
- Monthly P&I
- —
- Monthly cashflow
- —
- DSCR
- —
- Eligible?
- —
Short-term bridge; refi at stabilization.
Rent comps 23 comps
| Address | Beds | Baths | Sqft | Rent | $/sqft | DOM | Units | Dist |
|---|---|---|---|---|---|---|---|---|
| 1165 E State St Trenton, NJ | 3.0 | 1.0 | 900 | $1,749 | $1.94 | 15d | 1 | 0.10mi |
| 219 Woodlawn Ave Trenton, NJ | 3.0 | 1.0 | 1456 | $2,355 | $1.62 | 15d | 1 | 0.19mi |
| 417 Walnut Ave Trenton, NJ | 3.0 | 1.0 | 992 | $2,050 | $2.07 | 23d | 1 | 0.24mi |
| 428 Cleveland Ave Trenton, NJ | 4.0 | 2.0 | 1400 | $2,500 | $1.79 | 23d | 1 | 0.42mi |
| 340 Connecticut Ave Unit 2 Hamilton Township, NJ | 3.0 | 1.0 | 1400 | $2,850 | $2.04 | 15d | 1 | 0.43mi |
| 234 Walnut Ave Trenton, NJ | 4.0 | 1.0 | 1480 | $2,200 | $1.49 | 23d | 1 | 0.48mi |
| 121 Columbus Ave Trenton, NJ | 3.0 | 1.0 | 1050 | $1,900 | $1.81 | 23d | 1 | 0.66mi |
| 8 Joan Ter Trenton, NJ | 3.0 | 2.0 | 1397 | $3,250 | $2.33 | 23d | 1 | 0.70mi |
| 42 Grant St Trenton, NJ | 4.0 | 1.0 | 1000 | $2,000 | $2.00 | 15d | 1 | 0.71mi |
| 635 Chambers St Trenton, NJ | 4.0 | 2.0 | 1312 | $2,500 | $1.91 | 15d | 1 | 0.71mi |
| 21 Adella Ave Trenton, NJ | 3.0 | 1.0 | 1280 | $2,000 | $1.56 | 15d | 1 | 0.78mi |
| 25 Adella Ave Trenton, NJ | 3.0 | 1.0 | 1280 | $2,050 | $1.60 | 15d | 1 | 0.78mi |
| 416 Klagg Ave Trenton, NJ | 3.0 | 1.0 | 1034 | $2,300 | $2.22 | 23d | 1 | 0.80mi |
| 901 Brunswick Ave #7 Trenton, NJ | 3.0 | 1.0 | 940 | $2,800 | $2.98 | 15d | 1 | 1.12mi |
| 1040 Indiana Ave Trenton, NJ | 3.0 | 1.0 | 1232 | $2,950 | $2.39 | 15d | 1 | 1.13mi |
| 210 Kuser Rd Trenton, NJ | 3.0 | 1.5 | 1360 | $2,700 | $1.99 | 23d | 1 | 1.16mi |
| 331 Ellis Ave Trenton, NJ | 3.0 | 1.0 | 1190 | $2,275 | $1.91 | 23d | 1 | 1.17mi |
| 134 Old Rose St Trenton, NJ | 4.0 | 2.0 | 1212 | $2,300 | $1.90 | 23d | 1 | 1.18mi |
| 1314 Princeton Ave Trenton, NJ | 4.0 | 1.0 | 1092 | $2,400 | $2.20 | 15d | 1 | 1.20mi |
| 125 Olive St Trenton, NJ | 2.0–3.0 | 1.0–1.5 | 896 | $1,392 | $1.55 | 23d | 1 | 1.25mi |
| 705 Anderson St Trenton, NJ | 3.0 | 1.0 | 1132 | $1,800 | $1.59 | 15d | 1 | 1.26mi |
| 130 W Ingham Ave Trenton, NJ | 4.0 | 1.0 | 1126 | $2,000 | $1.78 | 15d | 1 | 1.42mi |
| 1103 Division St Trenton, NJ | 4.0 | 1.0 | 1296 | $2,000 | $1.54 | 23d | 1 | 1.46mi |
Listing history 6 events
-
2026-06-22days on market $259,000 Coming Soon 7 DOM
-
2026-06-18days on market $259,000 Coming Soon 4 DOM
-
2026-06-17days on market $259,000 Coming Soon 3 DOM
-
2026-06-16days on market $259,000 Coming Soon 2 DOM
-
2026-06-15remarks 693-char remark
-
2026-06-15$259,000 Coming Soon 1 DOM
ⓘ Source: listings_history table (triggers on properties + properties_extension) + one-shot
backfill from property_details.listing_events for pre-trigger history.
Tax reassessment forecast NJ · Partial reset (capped growth)
- Current annual tax
- $3,434 · $286/mo
- Projected year-2 tax
- $4,941 · $412/mo
- Expected delta
- +$1,508/yr (+$126/mo · 43.9%)
ⓘ Screening estimate from a state-policy table — verify with the county assessor before closing.
Climate risk First Street
- Flood 5/10 Major FEMA zone X (unshaded) · 24% chance over 30 yrs
- Wildfire 1/10 Low
- Heat 7/10 Severe 7 d/yr ≥102°F today · 15 d/yr by 30 yrs out
- Wind 6/10 Major 27% chance of damaging wind over 30 yrs
- Air quality 5/10 Major 6 unhealthy d/yr today · 8 by 30 yrs out
Nearby sold comps map
Loading sold comps map…
Walkable amenities ~0.75 mi
Loading nearby amenities…
Taxation est. · year 1
- Rental income
- $29,144
- − Mortgage interest
- −$14,508
- − Property taxes
- −$3,434
- − Insurance
- −$1,295
- − Repairs & maintenance
- −$2,332
- − Management
- −$2,332
- − Depreciation
- −$7,535
- Taxable loss
- −$2,290
- Est. tax savings @ 24.0%
- +$550
- After-tax cash flow
- $2,546/yr
For passive investors: Depreciation is non-cash, so a rental often shows a tax loss while cash-flowing — sheltering income. Rental losses are passive: they offset passive income freely, and up to $25,000/yr can offset ordinary (W-2) income if you actively participate and your MAGI is under $100k (phasing out to $0 by $150k); unused losses carry forward. On sale, claimed depreciation is recaptured at up to 25%, and gains may owe capital-gains tax (a 1031 exchange can defer both). Figures are a year-1 estimate at your 24.0% rate — not tax advice; consult a CPA.
Schools (NCES district)
- District
- Trenton Public School District
- NCES district ID
- 3416290
- Math proficiency
- 2% ▼ -8.00%
- Reading proficiency
- 16% ▼ -4.00%
- Median HH income
- $35,078
- Composite
- 7.31/100
- National rank
- #9956
- State rank
- #471 of 472 in NJ
Livability — Trenton
- Score
- 76/100
- State rank
- #133
- US rank
- #3533
Category grades
Schools grade is shown separately in the Schools card above.
Census & demographics
- Census place
- Trenton, NJ
- County
- Mercer County · 327,655 people
- City population
- 177,819
- Metro
- Trenton-Princeton, NJ
- Population (ZIP)
- 15,938
- Household income
- $68,238
- Rent vs Own
- Severe rent burden
- 930.0
Population outlook (Mercer County) Hauer SSP2
- Today (2025)
- 381,395 people
- By 2030
- 384,640 · +0.9%
- By 2040
- 391,431 · +2.6%
- By 2050
- 397,845 · +4.3%
- By 2075
- 417,281 · +9.4%
- By 2100
- 420,327 · +10.2%
Race, ethnicity, and origin ACS 2023
- Neighborhood character
- Diverse neighborhood (Simpson 0.61)
- Race & ethnicity
- Hispanic / Latino 45% Black 43% Two or more races 12% White 8% Asian 1%
- Hispanic origin (detail)
- Mexican 3% Puerto Rican 9% Dominican 11%
- Common ancestry
- Hispanic 5% Swiss 2% Estonian 1%
- Foreign-born
- 32% · Canada, Guatemala, China
- Languages at home
- 51% English-only · Spanish 41% French/Haitian/Cajun 2% Other Indo-European 2%
Political lean MEDSL · Mercer
- 2024 margin
- Solid D (+33.9) · D 65.9% · R 32.0% · Other 2.1%
- 2008→2024 swing
- -2.2pp toward R · 2008: 36.1pp · 2024: 33.9pp
- All cycles
- 2024: D+33.9 2020: D+40.0 2016: D+36.2 2012: D+36.8 2008: D+36.1
Not yet ingested
- Civics
- —
Market trends
- HPI YoY
- ▼ -114.12%
- Current HPI
- 275.8566
- Rent YoY
- —
- Metro
- Trenton-Princeton, NJ
- State GDP YoY
- ▲ 2.05%
- F500 in state
- 34
Industry mix (Fortune 500 HQ in NJ)
| Industry | F500 HQs | Revenue |
|---|---|---|
| Consumer Goods | 3 | $31B |
|
||
| Pharmaceuticals | 2 | $153B |
|
||
| Technology | 2 | $21B |
|
||
| Insurance | 2 | $20B |
|
||
| Healthcare | 2 | $19B |
|
||
| Financial Services | 1 | $70B |
|
||
Price history
+859.3% since first listed16 events — show timeline
- 2026-06-14 Coming Soon $259,000 BRIGHT MLS
- 2023-06-14 Sold (MLS) $190,000 BRIGHT MLS
- 2023-05-18 Pending — BRIGHT MLS
- 2023-04-26 Contingent — BRIGHT MLS
- 2023-04-10 Price Changed $195,000 BRIGHT MLS
- 2022-12-12 Listed $209,000 BRIGHT MLS
- 2022-11-22 Coming Soon $209,000 BRIGHT MLS
- 2021-01-08 Sold (Public Records) $49,000 Public Records
- 2006-05-12 Sold (Public Records) $84,000 Public Records
- 2006-05-08 Sold (MLS) $84,000 BRIGHT MLS
- 2006-02-13 Listing Removed — BRIGHT MLS
- 2005-10-15 Listed $84,000 BRIGHT MLS
- 2001-11-14 Sold (Public Records) $78,000 Public Records
- 2001-04-27 Sold (MLS) $27,000 BRIGHT MLS
- 2001-03-27 Listing Removed — BRIGHT MLS
- 2001-03-16 Listed $27,000 BRIGHT MLS
Property tax history
+3.4%/yrLatest (2025): $3,434 · +1.5% YoY. Source: county tax records.
Cash-flow waterfall
monthlySold comps — $/sqft
last 12 mo · ≤1 miLoading sold comps…