 Duplex
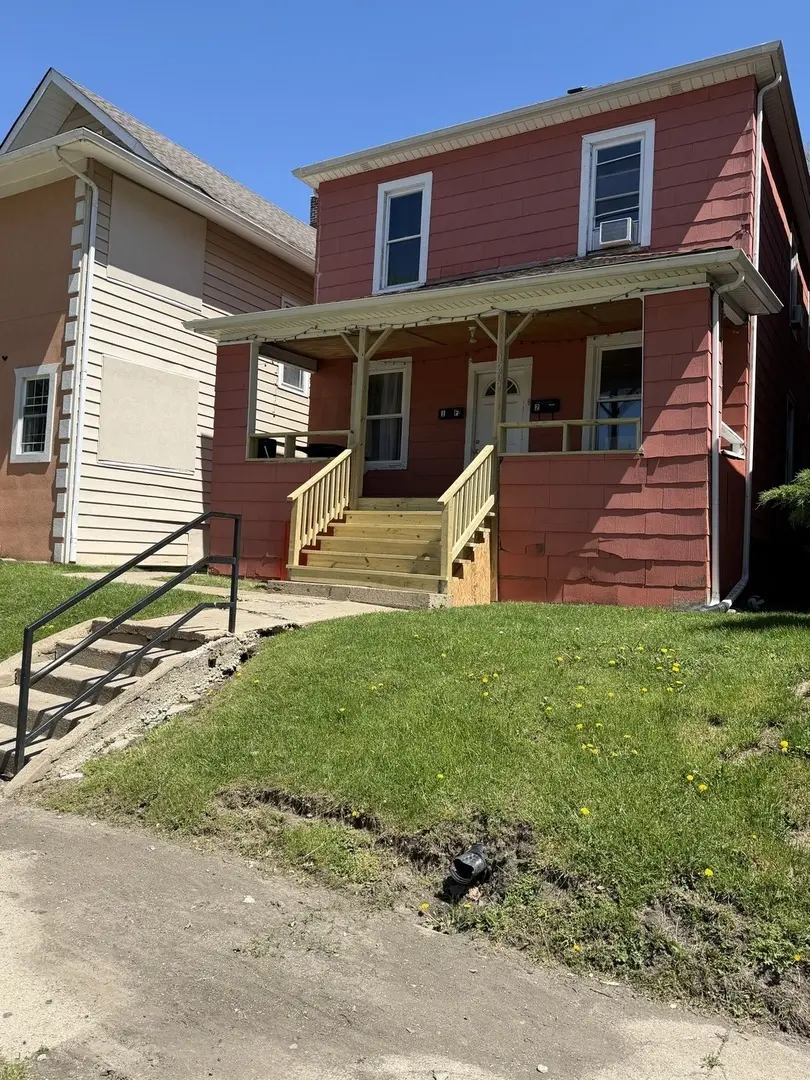
1207 Emerald Ave · Chicago Heights, IL
Flood risk 1/10 · Minimal
- FEMA flood zone
- X (unshaded)
- Chance of flooding over 30 yrs
- 0.0%
- Est. flood insurance / yr
- $473 – $860
Fire risk 3/10 · Minor
- Est. fire insurance / yr
- $804 – $1,492
Heat risk 3/10 · Minor
- Hot days now (above 101°F)
- 7 days/yr
- Hot days in 30 yrs
- 16 days/yr
Wind risk 2/10 · Minimal
- Chance of severe wind over 30 yrs
- —
Air-quality risk 2/10 · Minimal
- Unhealthy air days now
- 2 days/yr
- Unhealthy air days in 30 yrs
- 2 days/yr
Risk factors via First Street. Map © Google.
Why this score? — see what drove the B- grade
The composite is a weighted blend of 9 inputs, each scored 0–100. Each bar is that input's sub-score; the figure is the points it added to the 100-point composite (weight × sub-score).
- Cash flow +30.0/30.0
- 1% rule +10.0/10.0
- DSCR +10.0/10.0
- ARV discount +7.5/15.0
- Rent growth +4.1/5.0
- Livability +3.6/5.0
- Condition / age +2.5/5.0
- Schools +0.7/10.0
- Appreciation +0.0/10.0
$152,900
🖨 Deal sheet 📄 Offer letter ✓ Due diligence
Multi-family units
County records classify this as Multi-Family (2-4 Unit). Listing-text estimate: 2 units. confirmed
Listing remarks MLS
2 Unit building. Ideal for rental income. Sold As-Is. Buyer is responsible for any and all city repairs and escrows. Seller provides no disclosures or surveys. All offers must include proof of funds/pre-approval letter. Cash offers require at least 10% earnest money. Call listing agent for offer instructions.
Key facts
- New furnace
- New water heater
- Full basement
Tags
Property features AI
Finance
- Other: Possession at closing subject to tenants' rights
- Financial info: Two-unit building; Month-to-month leases for both units; Unit 1 rent: $1,300 with $1,300 security deposit; Unit 2 rent: $1,300 with $1,300 security deposit; Special Service Area: No
Exterior
- Parking: 4 parking spaces (off alley)
- Utilities: Water from Lake Michigan; Public sewer
- Home design: Two- to four-unit building; Fee simple ownership; Over 100 years old; Built before 1978; 30 x 124 lot dimensions; Less than 0.25 acre lot
- Construction: Vinyl siding on frame construction
- Exterior features: Commuter bus and train access nearby; Interstate access
Interior
- Kitchen: Stove; Refrigerator
- Bedrooms: 6 bedrooms total; Unit 1 (1st floor): 3 bedrooms; Unit 2 (2nd floor): 3 bedrooms
- Bathrooms: 2 full bathrooms total; Unit 1: 1 full bathroom; Unit 2: 1 full bathroom
- Heating & cooling: Natural gas forced air heating
- Interior features: Partially finished full basement; 8 total rooms
- Laundry & utility: Tenant pays electric and gas (for each unit)
Neighborhood map
What this means for you Summary
Snapshot
- This is a 2 × 3-bed/1.0-bath units multifamily listed at $153k.
Deal economics
- At list price, monthly cash flow is $2k ($20k/yr) — positive. Per door: $838/mo.
- The deal already cash-flows at list — no discount required.
- Meets the 1% rule at list price ($4k rent vs $153k).
- Cap rate 19.4% vs local median 6.4% in Chicago Heights — top-decile yield for the area; either an underpriced asset or a hidden risk that comps aren't pricing in. Stress-test before assuming the spread holds.
Location & tenants
- Location reads 71/100 on livability (#339 in IL) — a middle-class / working-renter tenant base. Strengths: commute A+, cost of living A+, housing A+; Watch: employment C-, crime F, amenities F.
- Bloom Twp Hsd 206 (suburban): math 8% / reading 9% proficiency, ranked #591 of 620 in IL (top 95%) — low school quality limits family demand, transient renter base, plan for 1-2y turnover.
- Zoned schools: Bloom High School (math 7% / reading 8%, grade F, #589 of 693 statewide, top 86%, 1,737 students, 0% FRL).
- Market conditions: Rents rising fast (+6.5%/yr); 222 active listings in the ZIP; 9 comparable units currently listed for rent nearby; rentals leasing fast (median 11d on market — plan ~1-2 weeks tenant-placement turnaround); 6,272 units permitted in Cook County in 2024 (4,658 in 5+ unit buildings).
- At $3,701/mo this rent would consume 72% of the median local household income ($62k/yr) (locally 1714% of renters already pay >50% of income on rent) — very limited rent-growth headroom before tenants either downsize or default.
Forward outlook
- Local home prices are declining (-3.0%/yr); year-one equity from $1k of loan paydown is wiped out by about $5k of value loss. Plan a longer hold.
- At projected returns (-3.0% appreciation + 6.5% rent growth), your $43k cash investment doubles in ~3 years — after that, you're playing with house money.
Negotiation context
- Only 6 days on market — expect competitive offers; lowballing is unlikely to land.
- 4 sale attempts since 17y ago with the ask held roughly flat each time — persistent listings suggest the price (not the market) is what's stuck; bring a comps-based counter.
- Current owner paid $18k; list at $153k implies a 749% gain — meaningful room to come down on a strong offer.
Risks & watch-outs
- Watch-outs: property tax is 3.0% of price; built in 1913 — expect roof / HVAC / electrical / plumbing capex.
Questions for the listing agent
- Can we see the unit-by-unit rent roll, current vacancy, and any below-market leases? What's the average tenancy length?
- What capital expenditures (roof, boiler, parking lot, exteriors) have been made in the last 5 years, and what's planned in the next 2?
- Built in 1913 — when were the roof, HVAC, electrical panel, plumbing, and water heater last replaced?
- Property tax is high relative to price — has the assessment been appealed recently, and will the sale trigger a re-assessment?
- Is there a deadline driving the sale (1031 exchange, divorce, estate, relocation)? That informs how much negotiation room exists.
- Schools are F-rated, which usually means shorter tenancies and higher turnover. Who's the typical renter profile here, and what's been the actual vacancy rate?
- Crime grade is F in this area — have there been break-ins, vandalism, or insurance claims at this property in the last 3 years? What carrier currently insures it and at what premium?
- What's the average days-on-market for RENTAL listings here right now (not sales)? A rising rental-DOM trend means longer vacancies and softer asking-rent achievability than the comps imply.
- What's the recent tenant-quality profile in this submarket — average credit score on applications, eviction rate, late-payment / NSF rate, and stable-employment percentage? A property-management company in the area should have these aggregated.
- How much new apartment / multifamily construction is in the pipeline within 1–3 miles? Heavy new supply (>2% of stock underway) typically softens rents 12–24 months out; light construction supports rent growth.
Investment metrics
- 1% rule
- 2.42% ✓
- Cap rate
- 19.45%
- Cash-on-cash
- 46.99%
- DSCR
- 3.09
- GRM
- 3.4
CMA / ARV
No comps found within radius.
Projected returns pro-forma
-3.0% appreciation · 6.48% rent growth · sell at horizon
- IRR
- 48.5%
- Equity multiple
- 3.23×
- Total profit
- $95,580
- Equity at exit
- $22,798
- IRR
- 55.7%
- Equity multiple
- 7.55×
- Total profit
- $280,538
- Equity at exit
- $13,220
Cash invested: $42,812 (down + closing). Projections, not guarantees.
Landlord ↔ Tenant lean methodology
- Overall (STATE)
- 43 Moderately Tenant-Leaning
- State Illinois
- 43 Moderately Tenant-Leaning · D+7
- County
- — inherits STATE
- City
- — inherits STATE
ZIP-level market 60411
- Home prices YoY
- -33.9%
- Rents YoY
- 6.5%
- Active inventory
- 222
- Price-to-rent
- 6.9×
Monthly cashflow live
- Estimated rent
- $3,701 high interval (Pro) →
- Mortgage (P&I)
- −$802
- Tax from tax record
- −$382 /mo · $4,582/yr
- Insurance
- −$64
- HOA
- −$0
- Vacancy / Maint / Mgmt
- −$777
- Net cashflow
- $1,676
Break-even live
2-unit breakdown (identical units grouped — click to expand)
| Units | Beds | Baths | Est. rent |
|---|---|---|---|
| 2× units | 3 | 1 | $3,700 |
| #1 | 3 | 1 | $1,850 |
| #2 | 3 | 1 | $1,850 |
| Total (2 units) | $3,701 | ||
UW: 25.0% down · 7.5% · 30yr · 1.5% tax · 5.0% vac · 8.0% maint · 8.0% mgmt
Financing live
Cash to close
- Down payment
- $38,225
- Closing costs
- $4,587
- Reserves months
- —
- Total cash needed
- —
Loan-product check · same deal, 3 products live
Conventional
25% down · 7.5% · 30yr
- Down + closing
- —
- Monthly P&I
- —
- Monthly cashflow
- —
- DSCR
- —
- Eligible?
- —
Personal DTI + credit; lowest rate.
DSCR
20% down · 8.5% · 30yr
- Down + closing
- —
- Monthly P&I
- —
- Monthly cashflow
- —
- DSCR
- —
- Eligible?
- —
No personal income docs; deal must DSCR.
Hard money
10% down · 12.0% · 12mo
- Down + closing
- —
- Monthly P&I
- —
- Monthly cashflow
- —
- DSCR
- —
- Eligible?
- —
Short-term bridge; refi at stabilization.
Rent comps 9 comps
| Address | Beds | Baths | Sqft | Rent | $/sqft | DOM | Units | Dist |
|---|---|---|---|---|---|---|---|---|
| 1203 Emerald Ave Unit 1 Chicago Heights, IL | 3.0 | 1.0 | 1200 | $1,550 | $1.29 | 1d | 1 | 0.04mi |
| 41 W 14th Pl Unit 1 Chicago Heights, IL | 3.0 | 1.0 | 1250 | $1,750 | $1.40 | 10d | 1 | 0.52mi |
| 83 W 15th St #1 Chicago Heights, IL | 3.0 | 1.0 | 1050 | $1,500 | $1.43 | 3d | 1 | 0.63mi |
| 1631 Buena Vista Ave Unit 2 Chicago Heights, IL | 4.0 | 1.0 | 1200 | $1,900 | $1.58 | 24d | 1 | 0.82mi |
| 531 Wallace St Chicago Heights, IL | 3.0 | 1.0 | 1100 | $2,000 | $1.82 | 5d | 1 | 0.87mi |
| 1665 Buena Vista Ave Unit 3 Chicago Heights, IL | 4.0 | 1.0 | 1700 | $1,800 | $1.06 | 18d | 1 | 0.87mi |
| 169 E 23rd St Unit 1F Chicago Heights, IL | 3.0 | 1.0 | 1200 | $1,550 | $1.29 | 12d | 1 | 1.02mi |
| 398 W Lincoln Hwy Unit 4 Chicago Heights, IL | 3.0 | 2.0 | 1200 | $1,850 | $1.54 | 1d | 1 | 1.27mi |
| 370 E 17th St Chicago Heights, IL | 3.0 | 1.0 | 1058 | $2,600 | $2.46 | 16d | 1 | 1.36mi |
Listing history 21 events
-
2026-05-04status Pending
-
2026-04-27$152,900 Active
-
2011-07-20soldstatus $18,000
-
2011-03-29soldstatus $11,000 Closed Sale 310-char remark
Show marketing remark (310 chars)
2 Unit building. Ideal for rental income. Sold As-Is. Buyer is responsible for any and all city repairs and escrows. Seller provides no disclosures or surveys. All offers must include proof of funds/pre-approval letter. Cash offers require at least 10% earnest money. Call listing agent for offer instructions.
-
2011-03-08status Pending 310-char remark
Show marketing remark (310 chars)
2 Unit building. Ideal for rental income. Sold As-Is. Buyer is responsible for any and all city repairs and escrows. Seller provides no disclosures or surveys. All offers must include proof of funds/pre-approval letter. Cash offers require at least 10% earnest money. Call listing agent for offer instructions.
-
2011-02-25price $10,900 Price Change 310-char remark
Show marketing remark (310 chars)
2 Unit building. Ideal for rental income. Sold As-Is. Buyer is responsible for any and all city repairs and escrows. Seller provides no disclosures or surveys. All offers must include proof of funds/pre-approval letter. Cash offers require at least 10% earnest money. Call listing agent for offer instructions.
-
2011-01-30price $14,900 Price Change 310-char remark
Show marketing remark (310 chars)
2 Unit building. Ideal for rental income. Sold As-Is. Buyer is responsible for any and all city repairs and escrows. Seller provides no disclosures or surveys. All offers must include proof of funds/pre-approval letter. Cash offers require at least 10% earnest money. Call listing agent for offer instructions.
-
2010-12-20price $18,900 Price Change 310-char remark
Show marketing remark (310 chars)
2 Unit building. Ideal for rental income. Sold As-Is. Buyer is responsible for any and all city repairs and escrows. Seller provides no disclosures or surveys. All offers must include proof of funds/pre-approval letter. Cash offers require at least 10% earnest money. Call listing agent for offer instructions.
-
2010-11-11$23,900 New 310-char remark
Show marketing remark (310 chars)
2 Unit building. Ideal for rental income. Sold As-Is. Buyer is responsible for any and all city repairs and escrows. Seller provides no disclosures or surveys. All offers must include proof of funds/pre-approval letter. Cash offers require at least 10% earnest money. Call listing agent for offer instructions.
-
2009-11-22historical
-
2009-09-17price Price Change
-
2009-08-15price Price Change
-
2009-06-21price
-
2009-06-09price
-
2009-06-01status
-
2009-06-01historical
-
2009-05-22
-
2006-05-10soldstatus $135,000
-
2006-05-10soldstatus $135,000
-
2003-10-27soldstatus $64,000
-
1989-11-13soldstatus $40,000
ⓘ Source: listings_history table (triggers on properties + properties_extension) + one-shot
backfill from property_details.listing_events for pre-trigger history.
Tax reassessment forecast IL · Partial reset (capped growth)
- Current annual tax
- $4,582 · $382/mo
- Projected year-2 tax
- $4,582 · $382/mo
- Expected delta
- $0/yr ($0/mo · 0.0%)
ⓘ Screening estimate from a state-policy table — verify with the county assessor before closing.
Climate risk First Street
- Flood 1/10 Low FEMA zone X (unshaded) · 0% chance over 30 yrs
- Wildfire 3/10 Moderate
- Heat 3/10 Moderate 7 d/yr ≥101°F today · 16 d/yr by 30 yrs out
- Wind 2/10 Low
- Air quality 2/10 Low 2 unhealthy d/yr today · 2 by 30 yrs out
Nearby sold comps map
Loading sold comps map…
Walkable amenities ~0.75 mi
Loading nearby amenities…
Taxation est. · year 1
- Rental income
- $44,412
- − Mortgage interest
- −$8,565
- − Property taxes
- −$4,582
- − Insurance
- −$764
- − Repairs & maintenance
- −$3,553
- − Management
- −$3,553
- − Depreciation
- −$4,448
- Taxable income
- $18,947
- Est. tax owed @ 24.0%
- −$4,547
- After-tax cash flow
- $15,570/yr
For passive investors: Depreciation is non-cash, so a rental often shows a tax loss while cash-flowing — sheltering income. Rental losses are passive: they offset passive income freely, and up to $25,000/yr can offset ordinary (W-2) income if you actively participate and your MAGI is under $100k (phasing out to $0 by $150k); unused losses carry forward. On sale, claimed depreciation is recaptured at up to 25%, and gains may owe capital-gains tax (a 1031 exchange can defer both). Figures are a year-1 estimate at your 24.0% rate — not tax advice; consult a CPA.
Schools (NCES district)
- District
- Bloom Twp Hsd 206
- NCES district ID
- 1706420
- Math proficiency
- 8% ▼ -3.00%
- Reading proficiency
- 9% ▼ -8.00%
- Median HH income
- $39,795
- Composite
- 7.4/100
- National rank
- #9952
- State rank
- #591 of 620 in IL
Livability — Chicago Heights
- Score
- 71/100
- State rank
- #339
- US rank
- #6836
Category grades
Schools grade is shown separately in the Schools card above.
Census & demographics
- Census place
- Chicago Heights, IL
- County
- Cook County · 4,486,803 people
- City population
- 52,175
- Metro
- Chicago-Naperville-Elgin, IL-IN-WI
- Population (ZIP)
- 52,175
- Household income
- $62,073
- Rent vs Own
- Severe rent burden
- 1714.0
Population outlook (Cook County) Hauer SSP2
- Today (2025)
- 5,347,519 people
- By 2030
- 5,357,703 · +0.2%
- By 2040
- 5,324,924 · -0.4%
- By 2050
- 5,230,762 · -2.2%
- By 2075
- 4,785,735 · -10.5%
- By 2100
- 4,188,836 · -21.7%
Race, ethnicity, and origin ACS 2023
- Neighborhood character
- Diverse neighborhood (Simpson 0.66)
- Race & ethnicity
- Black 49% Hispanic / Latino 26% White 19% Two or more races 11%
- Hispanic origin (detail)
- Mexican 22% Puerto Rican 2%
- Common ancestry
- Romanian 4% Portuguese 1% Lithuanian 1%
- Foreign-born
- 12% · Canada
- Languages at home
- 76% English-only · Spanish 21% Russian/Polish/Slavic 1% Other Indo-European 1%
Political lean MEDSL · Cook
- 2024 margin
- Solid D (+42.0) · D 70.4% · R 28.4% · Other 1.2%
- 2008→2024 swing
- -11.4pp toward R · 2008: 53.4pp · 2024: 42.0pp
- All cycles
- 2024: D+42.0 2020: D+50.3 2016: D+53.0 2012: D+49.4 2008: D+53.4
Not yet ingested
- Civics
- —
Market trends
- HPI YoY
- ▼ -108.75%
- Current HPI
- 212.4058
- Rent YoY
- ▲ 6.48%
- Metro
- Chicago-Naperville-Elgin, IL-IN-WI
- State GDP YoY
- ▲ 1.59%
- F500 in state
- 60
Industry mix (Fortune 500 HQ in IL)
| Industry | F500 HQs | Revenue |
|---|---|---|
| Insurance | 4 | $201B |
|
||
| Consumer Goods | 4 | $87B |
|
||
| Industrial Machinery | 3 | $64B |
|
||
| Healthcare | 2 | $55B |
|
||
| Retail / Pharmacy | 1 | $148B |
|
||
| Agriculture / Food | 1 | $86B |
|
||
Price history
+282.2% since first listed21 events — show timeline
- 2026-05-04 Pending — MRED as Distributed by MLS Grid
- 2026-04-27 Listed $152,900 MRED as Distributed by MLS Grid
- 2011-07-20 Sold (Public Records) $18,000 Public Records
- 2011-03-29 Sold (MLS) $11,000 MRED as Distributed by MLS Grid
- 2011-03-08 Pending — MRED as Distributed by MLS Grid
- 2011-02-25 Price Changed $10,900 MRED as Distributed by MLS Grid
- 2011-01-30 Price Changed $14,900 MRED as Distributed by MLS Grid
- 2010-12-20 Price Changed $18,900 MRED as Distributed by MLS Grid
- 2010-11-11 Listed $23,900 MRED as Distributed by MLS Grid
- 2009-11-22 Listing Removed — MRED as Distributed by MLS Grid
- 2009-09-17 Price Changed — MRED as Distributed by MLS Grid
- 2009-08-15 Price Changed — MRED as Distributed by MLS Grid
- 2009-06-21 Price Changed — MRED as Distributed by MLS Grid
- 2009-06-09 Price Changed — MRED as Distributed by MLS Grid
- 2009-06-01 Relisted — MRED as Distributed by MLS Grid
- 2009-06-01 Listing Removed — MRED as Distributed by MLS Grid
- 2009-05-22 Listed — MRED as Distributed by MLS Grid
- 2006-05-10 Sold (Public Records) $135,000 Public Records
- 2006-05-10 Sold (Public Records) $135,000 Public Records
- 2003-10-27 Sold (Public Records) $64,000 Public Records
- 1989-11-13 Sold (Public Records) $40,000 Public Records
Property tax history
+1.9%/yrLatest (2023): $4,582 · -11.9% YoY. Source: county tax records.
Cash-flow waterfall
monthlySold comps — $/sqft
last 12 mo · ≤1 miLoading sold comps…