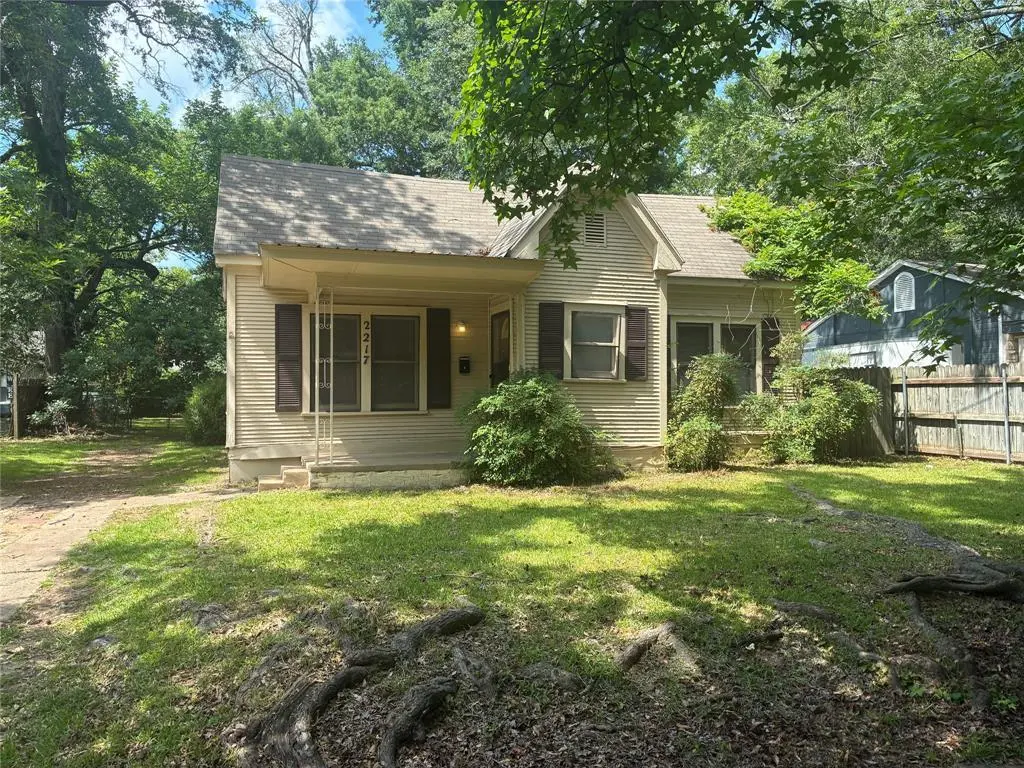
2217 Simpson St · Paris, TX
Flood risk 1/10 · Minimal
- FEMA flood zone
- X (unshaded)
- Chance of flooding over 30 yrs
- 0.0%
- Est. flood insurance / yr
- $507 – $1,088
Fire risk 4/10 · Minor
- Est. fire insurance / yr
- $1,222 – $2,270
Heat risk 7/10 · Major
- Hot days now (above 110°F)
- 7 days/yr
- Hot days in 30 yrs
- 22 days/yr
Wind risk 4/10 · Minor
- Chance of severe wind over 30 yrs
- 20.0%
Air-quality risk 2/10 · Minimal
- Unhealthy air days now
- 0 days/yr
- Unhealthy air days in 30 yrs
- 1 days/yr
Risk factors via First Street. Map © Google.
Why this score? — see what drove the B+ grade
The composite is a weighted blend of 9 inputs, each scored 0–100. Each bar is that input's sub-score; the figure is the points it added to the 100-point composite (weight × sub-score).
- Cash flow +30.0/30.0
- ARV discount +15.0/15.0
- 1% rule +10.0/10.0
- DSCR +10.0/10.0
- Livability +3.1/5.0
- Schools +3.0/10.0
- Rent growth +2.5/5.0
- Condition / age +2.5/5.0
- Appreciation +0.0/10.0
$75,000
🖨 Deal sheet 📄 Offer letter ✓ Due diligence
Listing remarks
This two bed, one bath home features large living area, dining area, and large back yard!
Key facts
- Large living area
- Dining area
- Large back yard
Tags
Property features AI
Finance
- Other: Property type: Residential, single family; Parcel/lot identifiers present; Listing status: Active
- Financial info: Treat as clear loan type; No second mortgage
- HOA & community: No homeowners association
Exterior
- Parking: Driveway
- Security: Audio and video consent for visitors/recording noted
- Utilities: City water; City sewer; Individual gas meter; Municipal Utility District: No
- Home design: Single family residence; One story; Residential property
- Construction: Built in 1945; Frame construction; Mixed and shingle roof; Pillar/post/pier foundation
- Exterior features: Lot less than 0.5 acre (approx. 0.213 acre); Subdivision: Stellrose Add; Directions: From Lamar South on 20th, SE; East on Simpson; house on left
Interior
- Kitchen: Electric oven; Kitchen approx. 12 x 7; Utility area located in the kitchen
- Bedrooms: Two bedrooms (primary bedroom on first floor); Bedroom approx. 13 x 13 (first floor); Primary bedroom approx. 13 x 11 (first floor)
- Flooring: Carpet; Linoleum
- Bathrooms: One full bathroom
- Heating & cooling: Central heating with gas jets; Central air conditioning (electric)
- Interior features: Five total rooms; One living area; One dining area; Other interior features
- Laundry & utility: Laundry located in the kitchen; Individual gas meter
Neighborhood map
What this means for you Summary
Snapshot
- This is a 2-bed/1.0-bath single-family listed at $75k.
Deal economics
- At list price, monthly cash flow is $435 ($5k/yr) — positive.
- The deal already cash-flows at list — no discount required.
- Meets the 1% rule at list price ($1k rent vs $75k).
- Recommended offer: $74k (1.5% below list) — sets the bar for market timing.
- Cap rate 13.3% vs local median 3.6% in Paris — top-decile yield for the area; either an underpriced asset or a hidden risk that comps aren't pricing in. Stress-test before assuming the spread holds.
Location & tenants
- Location reads 61/100 on livability (#984 in TX) — a middle-class / working-renter tenant base. Strengths: cost of living A+, housing A+; Watch: schools D+, crime F, amenities F.
- Paris ISD (town): math 36% / reading 37% proficiency, ranked #521 of 826 in TX (top 63%) — families likely to look elsewhere, expect single-tenant / working-renter base with shorter leases; 70% free/reduced lunch — lower-income household profile, screen leases tightly.
- Market conditions: 274 active listings in the ZIP; 5 comparable units currently listed for rent nearby; rentals lingering (median 44d on market — plan ~5-8 weeks vacancy on turnover, expect pricing pressure); 100% of comp listings sitting > 30 days — soft ceiling on asking rent; 119 units permitted in Lamar County in 2024 (71 in 5+ unit buildings).
- This rent runs 33% of the median local income ($46k/yr) — at the standard rent-burdened threshold; future hikes will face affordability resistance.
Forward outlook
- Local home prices are declining (-3.0%/yr); year-one equity from $519 of loan paydown is wiped out by about $2k of value loss. Plan a longer hold.
- Lamar County population projected at -13% by 2050 — secular population decline; favor cash flow + early exit over multi-decade hold.
- At projected returns (-3.0% appreciation + 3.0% rent growth), your $21k cash investment doubles in ~5 years — after that, you're playing with house money.
Negotiation context
- It's been on market 17 days — a 2% lower offer ($74k) is reasonable based on typical stale-listing flexibility.
Risks & watch-outs
- Watch-outs: built in 1945 — expect roof / HVAC / electrical / plumbing capex.
- Climate carrying-cost: extreme-heat days projected 7→22/yr by 2055 (HVAC capex compounding) — expect insurance premiums to compound above CPI over the hold.
Questions for the listing agent
- Built in 1945 — when were the roof, HVAC, electrical panel, plumbing, and water heater last replaced?
- Is there a deadline driving the sale (1031 exchange, divorce, estate, relocation)? That informs how much negotiation room exists.
- Schools are D-rated, which usually means shorter tenancies and higher turnover. Who's the typical renter profile here, and what's been the actual vacancy rate?
- Crime grade is F in this area — have there been break-ins, vandalism, or insurance claims at this property in the last 3 years? What carrier currently insures it and at what premium?
- What's the average days-on-market for RENTAL listings here right now (not sales)? A rising rental-DOM trend means longer vacancies and softer asking-rent achievability than the comps imply.
- What's the recent tenant-quality profile in this submarket — average credit score on applications, eviction rate, late-payment / NSF rate, and stable-employment percentage? A property-management company in the area should have these aggregated.
- How much new for-sale + rental construction is in the pipeline within 1–3 miles? Heavy new supply typically softens prices + rents 12–24 months out; constrained supply supports both.
Investment metrics
- 1% rule
- 1.69% ✓
- Cap rate
- 13.25%
- Cash-on-cash
- 24.86%
- DSCR
- 2.11
- GRM
- 4.9
CMA / ARV
- ARV (on-the-fly)
- $126,452
- Comps found
- 12
Show comp detail 12 sales within ~0.75 mi
| Address | Dist | Beds/Ba | Sqft | Sold | Price | $/sf | Match |
|---|---|---|---|---|---|---|---|
| 2430 Culbertson St | 0.14mi | 3/2.0 (+1) | 1,224 (-2%) | 7mo | $135,000 | $110 | 75 |
| 365 24th St SE | 0.18mi | 3/2.0 (+1) | 1,278 (+2%) | 8mo | $74,900 | $59 | 73 |
| 2131 Hubbard St | 0.19mi | 2/1.0 | 1,369 (+9%) | 4mo | $95,000 | $69 | 73 |
| 230 NE 20th | 0.49mi | 2/1.0 | 1,328 (+6%) | 8mo | $119,500 | $90 | 61 |
| 1061 19th St SE | 0.39mi | 2/1.0 | 1,096 (-12%) | 1mo | $60,000 | $55 | 60 |
| 1070 15th St SE | 0.57mi | 2/1.0 | 1,414 (+13%) | 5mo | $31,400 | $22 | 48 |
| 2121 Cedar St | 0.35mi | 3/2.0 (+1) | 1,394 (+11%) | 9mo | $150,000 | $108 | 48 |
| 2995 Carson Ln | 0.66mi | 3/2.0 (+1) | 1,334 (+6%) | 4mo | $134,900 | $101 | 46 |
| 336 14th St NE | 0.72mi | 2/1.0 | 1,120 (-10%) | 10mo | $149,990 | $134 | 41 |
| 939 SE 12th St | 0.67mi | 3/1.0 (+1) | 1,088 (-13%) | 3mo | $49,900 | $46 | 39 |
| 1337 E Houston St | 0.65mi | 3/2.0 (+1) | 1,090 (-13%) | 3mo | $179,500 | $165 | 37 |
| 1735 Bella Vis | 0.61mi | 3/2.0 (+1) | 1,393 (+11%) | 10mo | $199,900 | $144 | 35 |
Match score weights: distance 35% · size 25% · config 20% · recency 20%. Top-matched comps best support the ARV.
Projected returns pro-forma
-3.0% appreciation · 3.0% rent growth · sell at horizon
- IRR
- 18.3%
- Equity multiple
- 1.74×
- Total profit
- $15,603
- Equity at exit
- $11,183
- IRR
- 26.8%
- Equity multiple
- 3.36×
- Total profit
- $49,460
- Equity at exit
- $6,485
Cash invested: $21,000 (down + closing). Projections, not guarantees.
Landlord ↔ Tenant lean methodology
- Overall (STATE)
- 87 Strongly Landlord-Friendly
- State Texas
- 87 Strongly Landlord-Friendly · R+5
- County
- — inherits STATE
- City
- — inherits STATE
ZIP-level market 75460
- Active inventory
- 274
- Price-to-rent
- 4.9×
Monthly cashflow live
- Estimated rent
- $1,267 high interval (Pro) →
- Mortgage (P&I)
- −$393
- Tax from tax record
- −$141 /mo · $1,694/yr
- Insurance
- −$31
- HOA
- −$0
- Vacancy / Maint / Mgmt
- −$266
- Net cashflow
- $435
Break-even live
UW: 25.0% down · 7.5% · 30yr · 1.5% tax · 5.0% vac · 8.0% maint · 8.0% mgmt
Financing live
Cash to close
- Down payment
- $18,750
- Closing costs
- $2,250
- Reserves months
- —
- Total cash needed
- —
Loan-product check · same deal, 3 products live
Conventional
25% down · 7.5% · 30yr
- Down + closing
- —
- Monthly P&I
- —
- Monthly cashflow
- —
- DSCR
- —
- Eligible?
- —
Personal DTI + credit; lowest rate.
DSCR
20% down · 8.5% · 30yr
- Down + closing
- —
- Monthly P&I
- —
- Monthly cashflow
- —
- DSCR
- —
- Eligible?
- —
No personal income docs; deal must DSCR.
Hard money
10% down · 12.0% · 12mo
- Down + closing
- —
- Monthly P&I
- —
- Monthly cashflow
- —
- DSCR
- —
- Eligible?
- —
Short-term bridge; refi at stabilization.
Rent comps 5 comps
| Address | Beds | Baths | Sqft | Rent | $/sqft | DOM | Units | Dist |
|---|---|---|---|---|---|---|---|---|
| 2246 Simpson St Paris, TX | 3.0 | 1.0 | 1508 | $1,250 | $0.83 | 43d | 1 | 0.07mi |
| 2121 Cedar St Paris, TX | 3.0 | 2.0 | 1394 | $2,000 | $1.43 | 43d | 1 | 0.38mi |
| 370 29th St NE Paris, TX | 3.0 | 1.0 | 1220 | $1,200 | $0.98 | 43d | 1 | 0.77mi |
| 649 E Price St Paris, TX | 2.0 | 1.0 | 900 | $1,100 | $1.22 | 43d | 1 | 1.04mi |
| 3215 Clarksville St Paris, TX | 1.0–2.0 | 1.0 | 895 | $1,395 | $1.56 | 43d | 1 | 1.12mi |
Listing history 12 events
-
2026-06-19days on market $75,000 Active 17 DOM
-
2026-06-18days on market $75,000 Active 16 DOM
-
2026-06-17days on market $75,000 Active 15 DOM
-
2026-06-16days on market $75,000 Active 14 DOM
-
2026-06-15days on market $75,000 Active 13 DOM
-
2026-06-14days on market $75,000 Active 11 DOM
-
2026-06-12days on market $75,000 Active 10 DOM
-
2026-06-09days on market $75,000 Active 7 DOM
-
2026-06-08days on market $75,000 Active 6 DOM
-
2026-06-07days on market $75,000 Active 5 DOM
-
2026-06-03remarks 89-char remark
-
2026-06-03$75,000 Active 1 DOM
ⓘ Source: listings_history table (triggers on properties + properties_extension) + one-shot
backfill from property_details.listing_events for pre-trigger history.
Tax reassessment forecast TX · Resets to sale price
- Current annual tax
- $1,694 · $141/mo
- Projected year-2 tax
- $1,694 · $141/mo
- Expected delta
- $0/yr ($0/mo · 0.0%)
ⓘ Screening estimate from a state-policy table — verify with the county assessor before closing.
Climate risk First Street
- Flood 1/10 Low FEMA zone X (unshaded) · 0% chance over 30 yrs
- Wildfire 4/10 Moderate
- Heat 7/10 Severe 7 d/yr ≥110°F today · 22 d/yr by 30 yrs out
- Wind 4/10 Moderate 20% chance of damaging wind over 30 yrs
- Air quality 2/10 Low 0 unhealthy d/yr today · 1 by 30 yrs out
Nearby sold comps map
Loading sold comps map…
Walkable amenities ~0.75 mi
Loading nearby amenities…
Taxation est. · year 1
- Rental income
- $15,201
- − Mortgage interest
- −$4,201
- − Property taxes
- −$1,694
- − Insurance
- −$375
- − Repairs & maintenance
- −$1,216
- − Management
- −$1,216
- − Depreciation
- −$2,182
- Taxable income
- $4,317
- Est. tax owed @ 24.0%
- −$1,036
- After-tax cash flow
- $4,184/yr
For passive investors: Depreciation is non-cash, so a rental often shows a tax loss while cash-flowing — sheltering income. Rental losses are passive: they offset passive income freely, and up to $25,000/yr can offset ordinary (W-2) income if you actively participate and your MAGI is under $100k (phasing out to $0 by $150k); unused losses carry forward. On sale, claimed depreciation is recaptured at up to 25%, and gains may owe capital-gains tax (a 1031 exchange can defer both). Figures are a year-1 estimate at your 24.0% rate — not tax advice; consult a CPA.
Schools (NCES district)
- District
- Paris ISD
- NCES district ID
- 4834290
- Math proficiency
- 36% ▼ -11.00%
- Reading proficiency
- 37% ▼ -1.00%
- Median HH income
- $31,515
- Composite
- 29.83/100
- National rank
- #6419
- State rank
- #521 of 826 in TX
Livability — Paris
- Score
- 61/100
- State rank
- #984
- US rank
- #17535
Category grades
Schools grade is shown separately in the Schools card above.
Census & demographics
- Census place
- Paris, TX
- County
- Lamar County · 23,426 people
- City population
- 23,426
- Metro
- Paris, TX
- Population (ZIP)
- 23,426
- Household income
- $46,473
- Rent vs Own
- Severe rent burden
- 1355.0
Population outlook (Lamar County) Hauer SSP2
- Today (2025)
- 48,319 people
- By 2030
- 47,160 · -2.4%
- By 2040
- 44,621 · -7.7%
- By 2050
- 42,024 · -13.0%
- By 2075
- 36,577 · -24.3%
- By 2100
- 30,580 · -36.7%
Race, ethnicity, and origin ACS 2023
- Neighborhood character
- Diverse neighborhood (Simpson 0.60)
- Race & ethnicity
- White 58% Black 22% Hispanic / Latino 13% Two or more races 8%
- Hispanic origin (detail)
- Mexican 12%
- Common ancestry
- Lithuanian 1% Slovak 1% Italian 1%
- Foreign-born
- 3% · Canada, China
- Languages at home
- 92% English-only · Spanish 7%
Political lean MEDSL · Lamar
- 2024 margin
- Solid R (+61.0) · D 19.2% · R 80.3%
- 2008→2024 swing
- -19.1pp toward R · 2008: -42.0pp · 2024: -61.0pp
- All cycles
- 2024: R+61.0 2020: R+57.4 2016: R+59.2 2012: R+50.3 2008: R+42.0
Not yet ingested
- Civics
- —
Market trends
- HPI YoY
- ▼ -201.50%
- Current HPI
- 145.3511
- Rent YoY
- —
- Metro
- Paris, TX
- State GDP YoY
- ▲ 3.95%
- F500 in state
- 110
Industry mix (Fortune 500 HQ in TX)
| Industry | F500 HQs | Revenue |
|---|---|---|
| Energy | 16 | $1,198B |
|
||
| Technology | 5 | $198B |
|
||
| Engineering / Construction | 4 | $72B |
|
||
| Energy Services | 3 | $60B |
|
||
| Utilities | 3 | $41B |
|
||
| Healthcare | 2 | $330B |
|
||
Price history
1 event — show timeline
- 2026-06-02 Listed $75,000 NTREIS
Property tax history
+13.7%/yrLatest (2025): $1,694 · +4.9% YoY. Source: county tax records.
Cash-flow waterfall
monthlySold comps — $/sqft
last 12 mo · ≤1 miLoading sold comps…