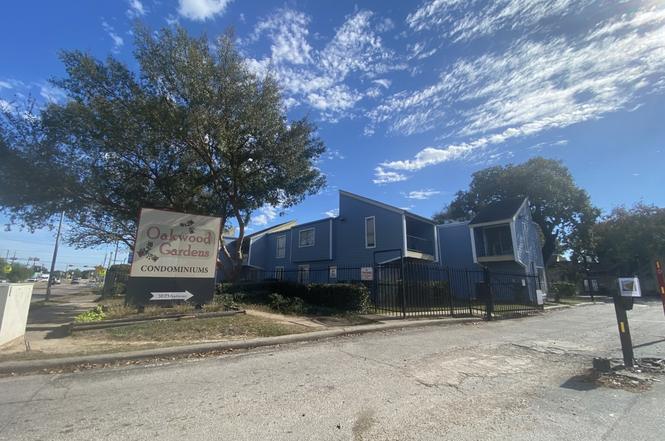
5625 Antoine Dr #708 · Houston, TX
Flood risk 6/10 · Moderate
- FEMA flood zone
- AE
- Chance of flooding over 30 yrs
- 0.74%
- Est. flood insurance / yr
- $1,737 – $8,500
Fire risk 1/10 · Minimal
- Est. fire insurance / yr
- $1,222 – $2,270
Heat risk 9/10 · Severe
- Hot days now (above 109°F)
- 7 days/yr
- Hot days in 30 yrs
- 24 days/yr
Wind risk 9/10 · Severe
- Chance of severe wind over 30 yrs
- 99.0%
Air-quality risk 3/10 · Minor
- Unhealthy air days now
- 3 days/yr
- Unhealthy air days in 30 yrs
- 3 days/yr
Risk factors via First Street. Map © Google.
Why this score? — see what drove the D grade
The composite is a weighted blend of 9 inputs, each scored 0–100. Each bar is that input's sub-score; the figure is the points it added to the 100-point composite (weight × sub-score).
- Cash flow +15.0/30.0
- ARV discount +7.5/15.0
- 1% rule +5.0/10.0
- DSCR +5.0/10.0
- Livability +3.7/5.0
- Rent growth +3.0/5.0
- Schools +2.7/10.0
- Condition / age +2.5/5.0
- Appreciation +0.0/10.0
$20,000
🖨 Deal sheet (PDF) 📄 Offer letter ✓ Due diligence
Listing remarks
Great investment opportunity! Washer and dryer connections in the unit. Plenty of storage space, spacious walk-in closet in primary bedroom with private bathroom. Property is located in a desirable Oak Forest West area, close to shopping, schools, public transportation, and major freeways. Oakwood Gardens community is under significant capital improvements. Room sizes are approximate and should be verified independently. Showings are available only with accepted offers.
Key facts
- Close to schools
- Walk-in closet
- Storage space
Tags
Neighborhood map
What this means for you Summary
Snapshot
- This is a 2-bed/2.0-bath condo listed at $20k.
Deal economics
- At list price, monthly cash flow is $-270 ($-3k/yr) — negative.
- Rent doesn't cover operating costs at any purchase price — skip.
- Meets the 1% rule at list price ($1k rent vs $20k).
- Recommended offer: $18k (12.0% below list) — sets the bar for market timing.
- Cap rate 15.7% vs local median 3.2% in Houston — top-decile yield for the area; either an underpriced asset or a hidden risk that comps aren't pricing in. Stress-test before assuming the spread holds.
Location & tenants
- Location reads 74/100 on livability (#184 in TX, #4,771 nationally) — a middle-class / working-renter tenant base. Strengths: amenities A+, cost of living A+, housing A+; Watch: crime F.
- Houston ISD (urban): math 27% / reading 35% proficiency, ranked #593 of 826 in TX (top 72%) — families likely to look elsewhere, expect single-tenant / working-renter base with shorter leases; 71% free/reduced lunch — lower-income household profile, screen leases tightly.
- Zoned schools: Smith El (math 14% / reading 22%, grade F, #3,785 of 4,322 statewide, top 88%, 779 students, 97% FRL); Clifton Middle (math 9% / reading 22%, grade F, #1,556 of 1,662 statewide, top 94%, 509 students, 98% FRL); Scarborough H S (math 19% / reading 16%, grade F, #1,451 of 1,632 statewide, top 89%, 750 students, 96% FRL) — zoned schools average 97% FRL vs 71% district-wide (26 pts higher); higher-poverty schools than district average — tighter screening recommended.
- Zoned-school proficiency averages 17% at this address vs 31% district-wide (-14 pts) — the specific schools serving this property underperform the Houston ISD average; the district grade overstates school quality for this exact location.
- Market conditions: Rents rising (+2.1%/yr); 680 active listings in the ZIP; 40 comparable units currently listed for rent nearby; rentals leasing fast (median 12d on market — plan ~1-2 weeks tenant-placement turnaround); lower-income renter base — watch delinquency; 29,883 units permitted in Harris County in 2024 (8,621 in 5+ unit buildings).
- This rent runs 38% of the median local income ($35k/yr) — at the standard rent-burdened threshold; future hikes will face affordability resistance.
Forward outlook
- Local home prices are declining (-3.0%/yr); year-one equity from $138 of loan paydown is wiped out by about $600 of value loss. Plan a longer hold.
- Harris County population projected at +47% by 2050 — long-run rental-demand tailwind backs the buy-and-hold thesis.
Negotiation context
- It's been on market 210 days — a 12% lower offer ($18k) is reasonable based on typical stale-listing flexibility.
- 10 sale attempts since 16y ago; this cycle's ask has dropped $28k (58%) from the opening price — seller is motivated, your offer sets the floor, not the list.
Risks & watch-outs
- Watch-outs: property tax is 4.6% of price; flood insurance adds $427/mo; HOA is 48% of rent.
- Climate carrying-cost: in FEMA flood zone AE (mandatory federal flood insurance); severe wind risk, 99% chance of damaging wind over 30y; extreme-heat days projected 7→24/yr by 2055 (HVAC capex compounding) — expect insurance premiums to compound above CPI over the hold.
Questions for the listing agent
- What do current leases actually rent for vs. the listed asking? Can we see a recent rent roll and the last 12 months of T-12 income?
- It's been on market 210 days. Have you received any prior offers? Is the seller open to a 12% concession, seller financing, or rate buy-down credit?
- Built in 1972 — when were the roof, HVAC, electrical panel, plumbing, and water heater last replaced?
- Property tax is high relative to price — has the assessment been appealed recently, and will the sale trigger a re-assessment?
- What's the actual annual flood-insurance premium (NFIP or private), and is the property in a SFHA with mandatory coverage?
- What does the HOA fee cover, when was the last increase, and are there any pending special assessments or reserve-fund shortfalls?
- Any open or pending special assessments — roof, HVAC, plumbing, elevator, façade? What's the per-unit balance and payoff schedule, and is the seller paying it off at close or rolling it to the buyer?
- Why hasn't it sold? Are there any deal-killer items the seller is aware of (foundation, flood, title, zoning, code violations)?
- Is there a deadline driving the sale (1031 exchange, divorce, estate, relocation)? That informs how much negotiation room exists.
- Schools are D-rated, which usually means shorter tenancies and higher turnover. Who's the typical renter profile here, and what's been the actual vacancy rate?
- Crime grade is F in this area — have there been break-ins, vandalism, or insurance claims at this property in the last 3 years? What carrier currently insures it and at what premium?
- The area grade is low — what's the realistic commute time and amenity access for the typical tenant pool here? Any planned neighborhood developments (good or bad) we should know about?
- What's the average days-on-market for RENTAL listings here right now (not sales)? A rising rental-DOM trend means longer vacancies and softer asking-rent achievability than the comps imply.
- What's the recent tenant-quality profile in this submarket — average credit score on applications, eviction rate, late-payment / NSF rate, and stable-employment percentage? A property-management company in the area should have these aggregated.
- How much new apartment / multifamily construction is in the pipeline within 1–3 miles? Heavy new supply (>2% of stock underway) typically softens rents 12–24 months out; light construction supports rent growth.
Investment metrics
- 1% rule
- 5.68% ✓
- Cap rate
- 15.70%
- Cash-on-cash
- 33.61%
- DSCR
- 2.50
- GRM
- 1.5
CMA / ARV
No comps found within radius.
Projected returns pro-forma
-3.0% appreciation · 2.1% rent growth · sell at horizon
- IRR
- —
- Equity multiple
- -2.71×
- Total profit
- $-20,787
- Equity at exit
- $2,982
- IRR
- —
- Equity multiple
- -6.44×
- Total profit
- $-41,686
- Equity at exit
- $1,729
Cash invested: $5,600 (down + closing). Projections, not guarantees.
Landlord ↔ Tenant lean methodology
- Overall (STATE)
- 87 Strongly Landlord-Friendly
- State Texas
- 87 Strongly Landlord-Friendly · R+5
- County
- — inherits STATE
- City
- — inherits STATE
ZIP-level market 77091
- Home prices YoY
- -24.9%
- Rents YoY
- 2.1%
- Active inventory
- 680
- Price-to-rent
- 1.5×
Monthly cashflow live
- Estimated rent
- $1,135 high interval (Pro) →
- Mortgage (P&I)
- −$105
- Tax from tax record
- −$77 /mo · $920/yr
- Insurance
- −$8
- Flood insurance flood zone
- −$427 /mo · $5,118/yr
- HOA
- −$550
- Vacancy / Maint / Mgmt
- −$238
- Net cashflow
- $-270
Break-even live
Sensitivity live
| Price | -10% $-204 | -5% $-264 | +0% $-270 | +5% $-275 | +10% $-281 |
|---|---|---|---|---|---|
| Rent | -10% $-359 | -5% $-315 | +0% $-270 | +5% $-225 | +10% $-180 |
| Rate | -1.0pp $-260 | -0.5pp $-265 | base $-270 | +0.5pp $-275 | +1.0pp $-280 |
UW: 25.0% down · 7.5% · 30yr · 1.5% tax · 5.0% vac · 8.0% maint · 8.0% mgmt
Financing live
Cash to close
- Down payment
- $5,000
- Closing costs
- $600
- Reserves months
- —
- Total cash needed
- —
Loan-product check · same deal, 3 products live
Conventional
25% down · 7.5% · 30yr
- Down + closing
- —
- Monthly P&I
- —
- Monthly cashflow
- —
- DSCR
- —
- Eligible?
- —
Personal DTI + credit; lowest rate.
DSCR
20% down · 8.5% · 30yr
- Down + closing
- —
- Monthly P&I
- —
- Monthly cashflow
- —
- DSCR
- —
- Eligible?
- —
No personal income docs; deal must DSCR.
Hard money
10% down · 12.0% · 12mo
- Down + closing
- —
- Monthly P&I
- —
- Monthly cashflow
- —
- DSCR
- —
- Eligible?
- —
Short-term bridge; refi at stabilization.
Rent comps 40 comps
| Address | Beds | Baths | Sqft | Rent | $/sqft | DOM | Units | Dist |
|---|---|---|---|---|---|---|---|---|
| 5625 Antoine Dr Houston, TX | 1.0–2.0 | 1.0–2.5 | 1052 | $900 | $0.86 | 1d | 9 | 0.07mi |
| 5625 Antoine Dr Houston, TX | 1.0–2.0 | 1.0–2.5 | 888 | $900 | $1.01 | 26d | 12 | 0.07mi |
| 5555 Antoine Dr Unit 0218 Houston, TX | 2.0 | 2.0 | 1027 | $854 | $0.83 | 1d | 1 | 0.12mi |
| 5555 Antoine Dr Apt 309 Houston, TX | 2.0 | 1.0 | 917 | $822 | $0.90 | 9d | 1 | 0.12mi |
| 5555 Antoine Dr Apt 401 Houston, TX | 2.0 | 2.0 | 1027 | $912 | $0.89 | 9d | 1 | 0.12mi |
| 5555 Antoine Dr Unit 0102 Houston, TX | 2.0 | 1.0 | 917 | $755 | $0.82 | 26d | 1 | 0.12mi |
| 5555 Antoine Dr Unit 0804 Houston, TX | 3.0 | 2.0 | 1179 | $1,008 | $0.85 | 3d | 1 | 0.12mi |
| 5555 Antoine Dr Apt 502 Houston, TX | 2.0 | 1.0 | 917 | $781 | $0.85 | 9d | 1 | 0.12mi |
| 5853 Village Forest Ct Houston, TX | 3.0 | 2.0 | 1142 | $1,600 | $1.40 | 45d | 1 | 0.18mi |
| 5500 Antoine Dr Unit 057 Houston, TX | 1.0 | 1.0 | 784 | $830 | $1.06 | 45d | 1 | 0.21mi |
| 5500 Antoine Dr Apt 62 Houston, TX | 1.0 | 1.0 | 720 | $800 | $1.11 | 45d | 1 | 0.21mi |
| 5500 Antoine Dr Unit 007 Houston, TX | 1.0 | 1.0 | 725 | $855 | $1.18 | 45d | 1 | 0.21mi |
| 5500 Antoine Dr Unit 081 Houston, TX | 2.0 | 1.0 | 840 | $910 | $1.08 | 45d | 1 | 0.21mi |
| 5500 Antoine Dr Unit 144 Houston, TX | 2.0 | 1.0 | 896 | $940 | $1.05 | 45d | 1 | 0.21mi |
| 5500 Antoine Dr Unit 232 Houston, TX | 2.0 | 2.0 | 1020 | $970 | $0.95 | 45d | 1 | 0.21mi |
| 5500 Antoine Dr Apt 222 Houston, TX | 2.0 | 2.0 | 1152 | $1,050 | $0.91 | 45d | 1 | 0.21mi |
| 5801 N Houston Rosslyn Rd Houston, TX | 1.0–2.0 | 1.0–2.0 | 739 | $1,060 | $1.43 | 45d | 18 | 0.23mi |
| 5555 Antoine Dr Unit 0903 Houston, TX | 2.0 | 1.0 | 917 | $795 | $0.87 | 45d | 1 | 0.23mi |
| 5555 Antoine Dr Unit 0614 Houston, TX | 3.0 | 2.0 | 1179 | $985 | $0.84 | 45d | 1 | 0.23mi |
| 5555 Antoine Dr Unit 0712 Houston, TX | 1.0 | 1.0 | 715 | $680 | $0.95 | 45d | 1 | 0.23mi |
| 5555 Antoine Dr Unit 0217 Houston, TX | 2.0 | 2.0 | 1027 | $880 | $0.86 | 45d | 1 | 0.23mi |
| 5555 Antoine Dr Unit 0405 Houston, TX | 2.0 | 2.0 | 1027 | $880 | $0.86 | 9d | 1 | 0.23mi |
| 5555 Antoine Dr Unit 1012 Houston, TX | 2.0 | 2.0 | 1027 | $859 | $0.84 | 9d | 1 | 0.23mi |
| 5555 Antoine Dr Unit 0816 Houston, TX | 3.0 | 2.0 | 1179 | $1,260 | $1.07 | 3d | 1 | 0.23mi |
| 5555 Antoine Dr Unit 0707 Houston, TX | 1.0 | 1.0 | 715 | $719 | $1.01 | 1d | 1 | 0.23mi |
| 5555 Antoine Dr Unit 0709 Houston, TX | 1.0 | 1.0 | 715 | $856 | $1.20 | 3d | 1 | 0.23mi |
| 5555 Antoine Dr Unit 0508 Houston, TX | 2.0 | 1.0 | 917 | $777 | $0.85 | 3d | 1 | 0.23mi |
| 5670 Birchmont Dr Houston, TX | 2.0 | 1.0 | 968 | $1,250 | $1.29 | 45d | 1 | 0.30mi |
| 5950 Antoine Dr Houston, TX | 1.0–2.0 | 1.0–2.0 | 795 | $1,347 | $1.69 | 23d | 1 | 0.32mi |
| 5359 Deep Forest Dr Houston, TX | 3.0 | 2.0 | 1227 | $1,409 | $1.15 | 26d | 1 | 0.36mi |
| 6150 W Tidwell Rd Unit 424 Houston, TX | 2.0 | 2.0 | 995 | $1,389 | $1.40 | 9d | 1 | 0.38mi |
| 6150 W Tidwell Rd Unit 6187 Houston, TX | 2.0 | 2.0 | 995 | $1,373 | $1.38 | 0d | 1 | 0.38mi |
| 6150 W Tidwell Rd Unit 6207 Houston, TX | 2.0 | 2.0 | 995 | $1,239 | $1.25 | 17d | 1 | 0.38mi |
| 5500 De Soto St Unit 424 Houston, TX | 2.0 | 2.0 | 830 | $1,301 | $1.57 | 9d | 1 | 0.50mi |
| 5500 De Soto St Unit 2112 Houston, TX | 2.0 | 2.0 | 830 | $1,285 | $1.55 | 0d | 1 | 0.50mi |
| 5500 De Soto St Unit 5557 Houston, TX | 2.0 | 2.0 | 830 | $1,325 | $1.60 | 12d | 1 | 0.50mi |
| 6200 W Tidwell Rd Houston, TX | 2.0–3.0 | 1.0–2.0 | 1101 | $799 | $0.73 | 4d | 11 | 0.54mi |
| 6101 Antoine Dr Houston, TX | 2.0 | 1.0–2.0 | 700 | $1,295 | $1.85 | 1d | 5 | 0.55mi |
| 5310 Lost Forest Dr Houston, TX | 1.0–2.0 | 1.0–2.0 | 808 | $1,147 | $1.42 | 1d | 6 | 0.55mi |
| 5959 Pinemont Dr Unit 6016 Houston, TX | 2.0 | 2.0 | 920 | $1,174 | $1.28 | 0d | 1 | 0.56mi |
HOA detail condo
- Monthly dues
- $550 · $6,600/yr
- Assessments
- None detected in remarks — confirm with the listing agent.
Listing history 25 events
-
2026-04-17status Pending
-
2025-12-15historical $800
-
2025-12-03price $20,000
-
2025-10-28price $800
-
2025-09-19$48,000 Active
-
2025-09-18price $820
-
2025-09-10$825
-
2025-08-03historical $900
-
2025-07-31historical $900
-
2025-07-08$900
-
2025-06-30historical $900
-
2025-06-26$900
-
2025-05-22historical $825
-
2025-05-21price $825
-
2025-03-06$875
-
2025-01-09$1,000
-
2025-01-08historical $1,000
-
2024-11-07$1,000
-
2024-08-10historical $1,000
-
2024-07-18$1,000
-
2024-07-18historical $1,000
-
2024-05-23$1,000
-
2013-07-24soldstatus
-
2011-07-02historical
-
2010-02-10$24,900
ⓘ Source: listings_history table (triggers on properties + properties_extension) + one-shot
backfill from property_details.listing_events for pre-trigger history.
Tax reassessment forecast TX · Resets to sale price
- Current annual tax
- $920 · $77/mo
- Projected year-2 tax
- $920 · $77/mo
- Expected delta
- $0/yr ($0/mo · 0.0%)
ⓘ Screening estimate from a state-policy table — verify with the county assessor before closing.
Climate risk First Street
- Flood 6/10 Major FEMA zone AE · 74% chance over 30 yrs
- Wildfire 1/10 Low
- Heat 9/10 Extreme 7 d/yr ≥109°F today · 24 d/yr by 30 yrs out
- Wind 9/10 Extreme 99% chance of damaging wind over 30 yrs
- Air quality 3/10 Moderate 3 unhealthy d/yr today · 3 by 30 yrs out
Nearby sold comps map
Loading sold comps map…
Walkable amenities ~0.75 mi
Loading nearby amenities…
Taxation est. · year 1
- Rental income
- $13,621
- − Mortgage interest
- −$1,120
- − Property taxes
- −$920
- − Insurance
- −$5,218
- − Repairs & maintenance
- −$1,090
- − Management
- −$1,090
- − HOA
- −$6,600
- − Depreciation
- −$582
- Taxable loss
- −$2,999
- Est. tax savings @ 24.0%
- +$720
- After-tax cash flow
- $-2,516/yr
For passive investors: Depreciation is non-cash, so a rental often shows a tax loss while cash-flowing — sheltering income. Rental losses are passive: they offset passive income freely, and up to $25,000/yr can offset ordinary (W-2) income if you actively participate and your MAGI is under $100k (phasing out to $0 by $150k); unused losses carry forward. On sale, claimed depreciation is recaptured at up to 25%, and gains may owe capital-gains tax (a 1031 exchange can defer both). Figures are a year-1 estimate at your 24.0% rate — not tax advice; consult a CPA.
Schools (NCES district)
- District
- Houston ISD
- NCES district ID
- 4823640
- Math proficiency
- 27% ▼ -18.00%
- Reading proficiency
- 35% ▼ -6.00%
- Median HH income
- $46,054
- Composite
- 26.63/100
- National rank
- #7173
- State rank
- #593 of 826 in TX
Livability — Houston
- Score
- 74/100
- State rank
- #184
- US rank
- #4771
Category grades
Schools grade is shown separately in the Schools card above.
Census & demographics
- Census place
- Houston, TX
- County
- Harris County · 4,702,590 people
- City population
- 3,226,434
- Metro
- Houston-The Woodlands-Sugar Land, TX
- Population (ZIP)
- 28,728
- Household income
- $35,432
- Rent vs Own
- Severe rent burden
- 3210.0
Population outlook (Harris County) Hauer SSP2
- Today (2025)
- 5,571,493 people
- By 2030
- 6,089,821 · +9.3%
- By 2040
- 7,142,806 · +28.2%
- By 2050
- 8,185,864 · +46.9%
- By 2075
- 10,574,329 · +89.8%
- By 2100
- 12,109,958 · +117.4%
Race, ethnicity, and origin ACS 2023
- Neighborhood character
- Diverse neighborhood (Simpson 0.58)
- Race & ethnicity
- Hispanic / Latino 46% Black 45% Two or more races 15% White 7%
- Hispanic origin (detail)
- Mexican 29%
- Common ancestry
- Italian 1%
- Foreign-born
- 24% · Canada, Jamaica
- Languages at home
- 55% English-only · Spanish 41% French/Haitian/Cajun 2%
Political lean MEDSL · Harris
- 2024 margin
- Lean D (+5.5) · D 52.0% · R 46.4% · Other 1.6%
- 2008→2024 swing
- +3.9pp toward D · 2008: 1.6pp · 2024: 5.5pp
- All cycles
- 2024: D+5.5 2020: D+13.3 2016: D+12.4 2012: D+0.1 2008: D+1.6
Not yet ingested
- Civics
- —
Market trends
- HPI YoY
- ▼ -94.19%
- Current HPI
- 283.7523
- Rent YoY
- ▲ 2.10%
- Metro
- Houston-The Woodlands-Sugar Land, TX
- State GDP YoY
- ▲ 3.95%
- F500 in state
- 110
Industry mix (Fortune 500 HQ in TX)
| Industry | F500 HQs | Revenue |
|---|---|---|
| Energy | 16 | $1,198B |
|
||
| Technology | 5 | $198B |
|
||
| Engineering / Construction | 4 | $72B |
|
||
| Energy Services | 3 | $60B |
|
||
| Utilities | 3 | $41B |
|
||
| Healthcare | 2 | $330B |
|
||
Price history
-19.7% since first listed25 events — show timeline
- 2026-04-17 Pending — HARMLS
- 2025-12-15 Rental Removed $800 HARMLS
- 2025-12-03 Price Changed $20,000 HARMLS
- 2025-10-28 Price Changed $800 HARMLS
- 2025-09-19 Listed $48,000 HARMLS
- 2025-09-18 Price Changed $820 HARMLS
- 2025-09-10 Listed for Rent $825 HARMLS
- 2025-08-03 Rental Removed $900 APPFOLIO
- 2025-07-31 Rental Removed $900 HARMLS
- 2025-07-08 Listed for Rent $900 HARMLS
- 2025-06-30 Rental Removed $900 HARMLS
- 2025-06-26 Listed for Rent $900 HARMLS
- 2025-05-22 Rental Removed $825 HARMLS
- 2025-05-21 Price Changed $825 APPFOLIO
- 2025-03-06 Listed for Rent $875 APPFOLIO
- 2025-01-09 Listed for Rent $1,000 HARMLS
- 2025-01-08 Rental Removed $1,000 APPFOLIO
- 2024-11-07 Listed for Rent $1,000 APPFOLIO
- 2024-08-10 Rental Removed $1,000 APPFOLIO
- 2024-07-18 Listed for Rent $1,000 APPFOLIO
- 2024-07-18 Rental Removed $1,000 HARMLS
- 2024-05-23 Listed for Rent $1,000 HARMLS
- 2013-07-24 Sold (Public Records) — Public Records
- 2011-07-02 Listing Removed — HARMLS
- 2010-02-10 Listed $24,900 HARMLS
Property tax history
+6.9%/yrLatest (2025): $920 · -19.7% YoY. Source: county tax records.
Cash-flow waterfall
monthlySold comps — $/sqft
last 12 mo · ≤1 miLoading sold comps…