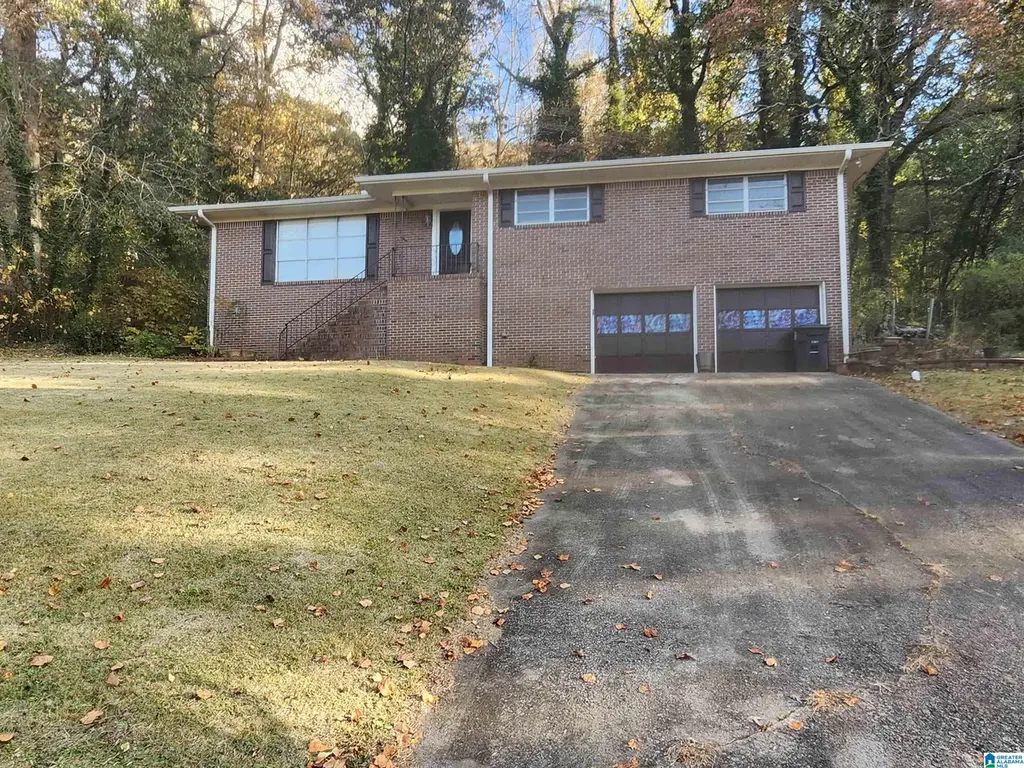
8929 Glendale Dr · Birmingham, AL
Flood risk 1/10 · Minimal
- FEMA flood zone
- X (unshaded)
- Chance of flooding over 30 yrs
- 0.0%
- Est. flood insurance / yr
- $473 – $860
Fire risk 3/10 · Minor
- Est. fire insurance / yr
- $916 – $1,700
Heat risk 5/10 · Moderate
- Hot days now (above 105°F)
- 5 days/yr
- Hot days in 30 yrs
- 13 days/yr
Wind risk 6/10 · Moderate
- Chance of severe wind over 30 yrs
- 27.0%
Air-quality risk 5/10 · Moderate
- Unhealthy air days now
- 7 days/yr
- Unhealthy air days in 30 yrs
- 9 days/yr
Risk factors via First Street. Map © Google.
Why this score? — see what drove the D grade
The composite is a weighted blend of 9 inputs, each scored 0–100. Each bar is that input's sub-score; the figure is the points it added to the 100-point composite (weight × sub-score).
- ARV discount +14.8/15.0
- Cash flow +12.6/30.0
- DSCR +3.8/10.0
- Livability +3.4/5.0
- Rent growth +3.0/5.0
- 1% rule +2.5/10.0
- Condition / age +2.5/5.0
- Schools +0.9/10.0
- Appreciation +0.0/10.0
$178,900
🖨 Deal sheet (PDF) 📄 Offer letter ✓ Due diligence
Listing remarks MLS
Beautiful, solid home in great neighborhood. New roof, paint and flooring. Close to interstate, shopping and near Ruffner Mountain. 10,000.00 grant to help buyer with closing costs or points buy down. 3 BR, 3 Full baths, 2 dens, fireplace with gas starter. Patio with privacy backyard. Great neighbors. Need solid buyer to purchase your new home and enjoy the many benefits of home ownership!
Key facts
- Ruffner mountain
- New carpet
- New flooring
Tags
Neighborhood map
What this means for you Summary
Snapshot
- This is a 3-bed/3.0-bath single-family listed at $179k.
Deal economics
- At list price, monthly cash flow is $-22 ($-268/yr) — negative.
- To cash-flow at today's rent, offer at most $175k (2.2% below list).
- To meet the 1% rule (rent ≥ 1% of price), the offer needs to be $135k (24.8% below list).
- Recommended offer: $135k (24.8% below list) — sets the bar for 1% rule.
Location & tenants
- Location reads 67/100 on livability (#78 in AL) — a middle-class / working-renter tenant base. Strengths: commute A+, cost of living A+, housing A+; Watch: amenities C-, schools F, crime F.
- Birmingham City (urban): math 4% / reading 20% proficiency, ranked #116 of 129 in AL (top 90%) — low school quality limits family demand, transient renter base, plan for 1-2y turnover; 82% free/reduced lunch — lower-income household profile, screen leases tightly.
- Market conditions: Rents rising (+1.8%/yr); 130 active listings in the ZIP; 8 comparable units currently listed for rent nearby; rentals at typical pace (median 26d on market — plan ~3-4 weeks tenant-placement turnaround); lower-income renter base — watch delinquency; 2,114 units permitted in Jefferson County in 2024 (556 in 5+ unit buildings).
- This rent runs 38% of the median local income ($43k/yr) — at the standard rent-burdened threshold; future hikes will face affordability resistance.
Forward outlook
- Local home prices are declining (-3.0%/yr); year-one equity from $1k of loan paydown is wiped out by about $5k of value loss. Plan a longer hold.
- Jefferson County population projected to shrink 4% by 2050 — rents likely to lag national; underwrite the cash flow, not the appreciation.
Negotiation context
- It's been on market 219 days — a 12% lower offer ($157k) is reasonable based on typical stale-listing flexibility.
- 2 sale attempts with the ask held roughly flat each time — persistent listings suggest the price (not the market) is what's stuck; bring a comps-based counter.
- Current owner paid $66k; list at $179k implies a 171% gain — meaningful room to come down on a strong offer.
Risks & watch-outs
- Watch-outs: built in 1957 — expect roof / HVAC / electrical / plumbing capex.
- Climate carrying-cost: major wind risk, 27% chance of damaging wind over 30y; extreme-heat days projected 5→13/yr by 2055 (HVAC capex compounding) — expect insurance premiums to compound above CPI over the hold.
Questions for the listing agent
- What do current leases actually rent for vs. the listed asking? Can we see a recent rent roll and the last 12 months of T-12 income?
- It's been on market 219 days. Have you received any prior offers? Is the seller open to a 25% concession, seller financing, or rate buy-down credit?
- Built in 1957 — when were the roof, HVAC, electrical panel, plumbing, and water heater last replaced?
- Why hasn't it sold? Are there any deal-killer items the seller is aware of (foundation, flood, title, zoning, code violations)?
- Is there a deadline driving the sale (1031 exchange, divorce, estate, relocation)? That informs how much negotiation room exists.
- Schools are F-rated, which usually means shorter tenancies and higher turnover. Who's the typical renter profile here, and what's been the actual vacancy rate?
- Crime grade is F in this area — have there been break-ins, vandalism, or insurance claims at this property in the last 3 years? What carrier currently insures it and at what premium?
- The area grade is low — what's the realistic commute time and amenity access for the typical tenant pool here? Any planned neighborhood developments (good or bad) we should know about?
- What's the average days-on-market for RENTAL listings here right now (not sales)? A rising rental-DOM trend means longer vacancies and softer asking-rent achievability than the comps imply.
- What's the recent tenant-quality profile in this submarket — average credit score on applications, eviction rate, late-payment / NSF rate, and stable-employment percentage? A property-management company in the area should have these aggregated.
- How much new for-sale + rental construction is in the pipeline within 1–3 miles? Heavy new supply typically softens prices + rents 12–24 months out; constrained supply supports both.
Investment metrics
- 1% rule
- 0.75% ✗
- Cap rate
- 6.14%
- Cash-on-cash
- -0.54%
- DSCR
- 0.98
- GRM
- 11.1
CMA / ARV
- ARV (median comp)
- $213,790
- List price
- $178,900
- Delta
- -16.32%
- Verdict
- UNDERPRICED
- Comps
- 20 within 1.0 mi
Show comp detail 12 sales within ~0.75 mi
| Address | Dist | Beds/Ba | Sqft | Sold | Price | $/sf | Match |
|---|---|---|---|---|---|---|---|
| 8905 Glendale Dr | 0.12mi | 4/2.0 (+1) | 2,226 (+0%) | 8mo | $235,000 | $106 | 79 |
| 8319 12th Ave S | 0.47mi | 3/2.0 | 2,204 (-1%) | 7mo | $120,000 | $54 | 66 |
| 450 Pinellas St | 0.29mi | 3/2.0 | 2,100 (-6%) | 11mo | $215,000 | $102 | 64 |
| 833 86th Pl S | 0.30mi | 3/2.0 | 2,420 (+9%) | 8mo | $250,000 | $103 | 60 |
| 429 Hickory St | 0.46mi | 3/2.0 | 2,116 (-5%) | 9mo | $250,000 | $118 | 59 |
| 625 Chestnut St | 0.62mi | 3/2.0 | 2,173 (-2%) | 8mo | $225,000 | $104 | 57 |
| 567 Rutherford Cir | 0.38mi | 3/2.0 | 2,010 (-10%) | 13mo | $246,000 | $122 | 52 |
| 8300 12th Ave S | 0.55mi | 3/2.0 | 1,956 (-12%) | 3mo | $129,900 | $66 | 48 |
| 501 Elm St | 0.53mi | 3/2.0 | 2,012 (-10%) | 10mo | $220,000 | $109 | 47 |
| 215 Observatory Dr | 0.39mi | 4/3.0 (+1) | 2,554 (+15%) | 10mo | $287,400 | $113 | 43 |
| 532 Hickory St | 0.53mi | 4/3.0 (+1) | 1,890 (-15%) | 11mo | $260,000 | $138 | 37 |
| 8300 7th Ter | 0.75mi | 4/2.0 (+1) | 1,976 (-11%) | 4mo | $105,500 | $53 | 34 |
Match score weights: distance 35% · size 25% · config 20% · recency 20%. Top-matched comps best support the ARV.
Projected returns pro-forma
-3.0% appreciation · 1.82% rent growth · sell at horizon
- IRR
- -18.4%
- Equity multiple
- 0.36×
- Total profit
- $-32,064
- Equity at exit
- $26,675
- IRR
- -13.0%
- Equity multiple
- 0.27×
- Total profit
- $-36,376
- Equity at exit
- $15,468
Cash invested: $50,092 (down + closing). Projections, not guarantees.
Landlord ↔ Tenant lean methodology
- Overall (STATE)
- 90 Strongly Landlord-Friendly
- State Alabama
- 90 Strongly Landlord-Friendly · R+15
- County
- — inherits STATE
- City
- — inherits STATE
ZIP-level market 35206
- Home prices YoY
- -32.0%
- Rents YoY
- 1.8%
- Active inventory
- 130
- Price-to-rent
- 11.1×
Monthly cashflow live
- Estimated rent
- $1,346 high interval (Pro) →
- Mortgage (P&I)
- −$938
- Tax from tax record
- −$73 /mo · $872/yr
- Insurance
- −$75
- HOA
- −$0
- Vacancy / Maint / Mgmt
- −$283
- Net cashflow
- $-22
Break-even live
Sensitivity live
| Price | -10% $79 | -5% $28 | +0% $-22 | +5% $-73 | +10% $-124 |
|---|---|---|---|---|---|
| Rent | -10% $-129 | -5% $-75 | +0% $-22 | +5% $31 | +10% $84 |
| Rate | -1.0pp $68 | -0.5pp $23 | base $-22 | +0.5pp $-69 | +1.0pp $-116 |
UW: 25.0% down · 7.5% · 30yr · 1.5% tax · 5.0% vac · 8.0% maint · 8.0% mgmt
Financing live
Cash to close
- Down payment
- $44,725
- Closing costs
- $5,367
- Reserves months
- —
- Total cash needed
- —
Loan-product check · same deal, 3 products live
Conventional
25% down · 7.5% · 30yr
- Down + closing
- —
- Monthly P&I
- —
- Monthly cashflow
- —
- DSCR
- —
- Eligible?
- —
Personal DTI + credit; lowest rate.
DSCR
20% down · 8.5% · 30yr
- Down + closing
- —
- Monthly P&I
- —
- Monthly cashflow
- —
- DSCR
- —
- Eligible?
- —
No personal income docs; deal must DSCR.
Hard money
10% down · 12.0% · 12mo
- Down + closing
- —
- Monthly P&I
- —
- Monthly cashflow
- —
- DSCR
- —
- Eligible?
- —
Short-term bridge; refi at stabilization.
Rent comps 8 comps
| Address | Beds | Baths | Sqft | Rent | $/sqft | DOM | Units | Dist |
|---|---|---|---|---|---|---|---|---|
| 8013 Rugby Ave Birmingham, AL | 3.0 | 2.0 | 1460 | $1,150 | $0.79 | 25d | 1 | 1.01mi |
| 730 80th Pl S Birmingham, AL | 4.0 | 1.0 | 2002 | $1,350 | $0.67 | 25d | 1 | 1.04mi |
| 7801 Vienna Ave Unit 1 Birmingham, AL | 4.0 | 1.5 | 1880 | $1,300 | $0.69 | 45d | 1 | 1.06mi |
| 7824 Rugby Ct Birmingham, AL | 4.0 | 1.5 | 1650 | $1,275 | $0.77 | 45d | 1 | 1.19mi |
| 8416 Division Ave Birmingham, AL | 3.0 | 2.0 | 1470 | $1,350 | $0.92 | 45d | 1 | 1.25mi |
| 805 Vanderbilt St Birmingham, AL | 4.0 | 2.0 | 1692 | $1,291 | $0.76 | 23d | 1 | 1.26mi |
| 625 Lisa Ln Birmingham, AL | 3.0 | 1.5 | 1700 | $1,200 | $0.71 | 21d | 1 | 1.37mi |
| 7815 4th Ave S Birmingham, AL | 3.0 | 2.0 | 1496 | $1,650 | $1.10 | 3d | 1 | 1.40mi |
Listing history 17 events
-
2026-06-21days on market $178,900 Active 219 DOM
-
2026-06-18days on market $178,900 Active 216 DOM
-
2026-06-17days on market $178,900 Active 215 DOM
-
2026-06-16days on market $178,900 Active 214 DOM
-
2026-06-15days on market $178,900 Active 213 DOM
-
2026-06-13days on market $178,900 Active 211 DOM
-
2026-06-10days on market $178,900 Active 208 DOM
-
2026-06-09days on market $178,900 Active 207 DOM
-
2026-06-08days on market $178,900 Active 206 DOM
-
2026-06-07days on market $178,900 Active 205 DOM
-
2026-06-03days on market $178,900 Active 201 DOM
-
2026-06-02days on market $178,900 Active 200 DOM
-
2026-06-01days on market $178,900 Active 199 DOM
-
2026-05-31days on market $178,900 Active 198 DOM
-
2026-01-12$178,900 Active 392-char remark
Show marketing remark (392 chars)
Beautiful, solid home in great neighborhood. New roof, paint and flooring. Close to interstate, shopping and near Ruffner Mountain. 10,000.00 grant to help buyer with closing costs or points buy down. 3 BR, 3 Full baths, 2 dens, fireplace with gas starter. Patio with privacy backyard. Great neighbors. Need solid buyer to purchase your new home and enjoy the many benefits of home ownership!
-
2025-11-14$178,900 Active 457-char remark
Show marketing remark (457 chars)
Solid, well built home in Roebuck Springs/South Roebuck. 10,000.00 grant available for buyer to apply towards closing costs and mortgage points buy down. Wonderful neighborhood near Ruffner Mountain, shopping and interstate. Great opportunity to own home with new paint, carpet and flooring. Wood burning fireplace, attic fan and 2 car garage. Huge mancave/den in finished basement. 3 bedrooms, 3 full baths, large dining room, den, patio. Won't last long!!
-
1990-12-27soldstatus $65,900
ⓘ Source: listings_history table (triggers on properties + properties_extension) + one-shot
backfill from property_details.listing_events for pre-trigger history.
Tax reassessment forecast AL · Resets to sale price
- Current annual tax
- $872 · $73/mo
- Projected year-2 tax
- $872 · $73/mo
- Expected delta
- $0/yr ($0/mo · 0.0%)
ⓘ Screening estimate from a state-policy table — verify with the county assessor before closing.
Climate risk First Street
- Flood 1/10 Low FEMA zone X (unshaded) · 0% chance over 30 yrs
- Wildfire 3/10 Moderate
- Heat 5/10 Major 5 d/yr ≥105°F today · 13 d/yr by 30 yrs out
- Wind 6/10 Major 27% chance of damaging wind over 30 yrs
- Air quality 5/10 Major 7 unhealthy d/yr today · 9 by 30 yrs out
Nearby sold comps map
Loading sold comps map…
Walkable amenities ~0.75 mi
Loading nearby amenities…
Taxation est. · year 1
- Rental income
- $16,148
- − Mortgage interest
- −$10,021
- − Property taxes
- −$872
- − Insurance
- −$894
- − Repairs & maintenance
- −$1,292
- − Management
- −$1,292
- − Depreciation
- −$5,204
- Taxable loss
- −$3,428
- Est. tax savings @ 24.0%
- +$823
- After-tax cash flow
- $555/yr
For passive investors: Depreciation is non-cash, so a rental often shows a tax loss while cash-flowing — sheltering income. Rental losses are passive: they offset passive income freely, and up to $25,000/yr can offset ordinary (W-2) income if you actively participate and your MAGI is under $100k (phasing out to $0 by $150k); unused losses carry forward. On sale, claimed depreciation is recaptured at up to 25%, and gains may owe capital-gains tax (a 1031 exchange can defer both). Figures are a year-1 estimate at your 24.0% rate — not tax advice; consult a CPA.
Schools (NCES district)
- District
- Birmingham City
- NCES district ID
- 0100390
- Math proficiency
- 4% ▼ -17.00%
- Reading proficiency
- 20% ▼ -4.00%
- Median HH income
- $31,988
- Composite
- 9.49/100
- National rank
- #9850
- State rank
- #116 of 129 in AL
Livability — Birmingham
- Score
- 67/100
- State rank
- #78
- US rank
- #10412
Category grades
Schools grade is shown separately in the Schools card above.
Census & demographics
- Census place
- Birmingham, AL
- County
- Jefferson County · 527,445 people
- City population
- 210,422
- Metro
- Birmingham-Hoover, AL
- Population (ZIP)
- 15,621
- Household income
- $42,549
- Rent vs Own
- Severe rent burden
- 1169.0
Population outlook (Jefferson County) Hauer SSP2
- Today (2025)
- 669,185 people
- By 2030
- 669,694 · +0.1%
- By 2040
- 661,388 · -1.2%
- By 2050
- 643,086 · -3.9%
- By 2075
- 577,267 · -13.7%
- By 2100
- 474,758 · -29.1%
Race, ethnicity, and origin ACS 2023
- Neighborhood character
- Predominantly Black (73%)
- Race & ethnicity
- Black 73% White 22% Two or more races 3% Hispanic / Latino 2%
- Common ancestry
- Slovak 1%
- Foreign-born
- 3% · Canada
- Languages at home
- 97% English-only · Spanish 2% Other Indo-European 0%
Political lean MEDSL · Jefferson
- 2024 margin
- D (+10.4) · D 54.6% · R 44.2% · Other 1.2%
- 2008→2024 swing
- +5.4pp toward D · 2008: 5.1pp · 2024: 10.4pp
- All cycles
- 2024: D+10.4 2020: D+13.2 2016: D+7.2 2012: D+6.0 2008: D+5.1
Not yet ingested
- Civics
- —
Market trends
- HPI YoY
- ▼ -68.70%
- Current HPI
- 146.2168
- Rent YoY
- ▲ 1.82%
- Metro
- Birmingham-Hoover, AL
- State GDP YoY
- ▲ 2.94%
- F500 in state
- 4
Industry mix (Fortune 500 HQ in AL)
| Industry | F500 HQs | Revenue |
|---|---|---|
| Financial Services | 1 | $8B |
|
||
| Healthcare | 1 | $5B |
|
||
Price history
+171.5% since first listed3 events — show timeline
- 2026-01-12 Listed $178,900 Greater Alabama MLS
- 2025-11-14 Listed $178,900 ForSaleByOwner.com
- 1990-12-27 Sold (Public Records) $65,900 Public Records
Property tax history
+2.2%/yrLatest (2025): $872 · +0.0% YoY. Source: county tax records.
Cash-flow waterfall
monthlySold comps — $/sqft
last 12 mo · ≤1 miLoading sold comps…