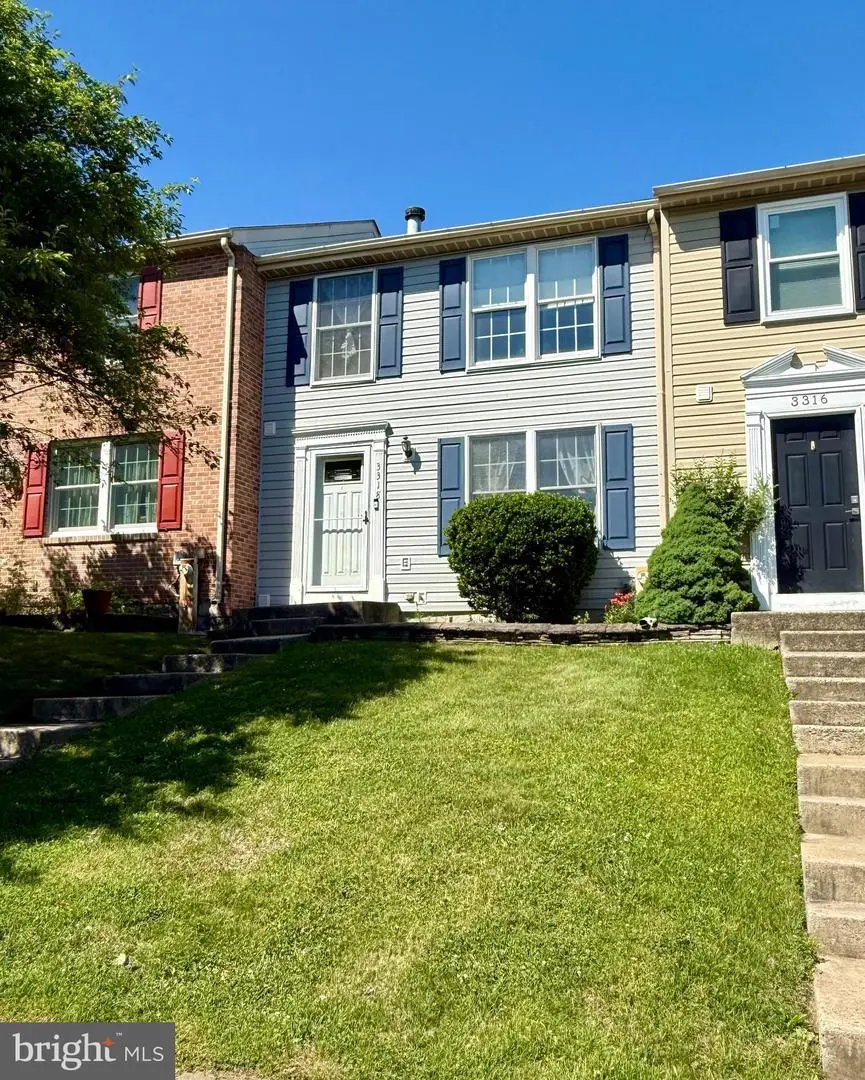
3318 Racoon Ct · Bel Air South, MD
Flood risk 1/10 · Minimal
- FEMA flood zone
- X (unshaded)
- Chance of flooding over 30 yrs
- 0.0%
- Est. flood insurance / yr
- $473 – $860
Fire risk 1/10 · Minimal
- Est. fire insurance / yr
- $755 – $1,403
Heat risk 7/10 · Major
- Hot days now (above 104°F)
- 7 days/yr
- Hot days in 30 yrs
- 15 days/yr
Wind risk 6/10 · Moderate
- Chance of severe wind over 30 yrs
- 27.0%
Air-quality risk 3/10 · Minor
- Unhealthy air days now
- 2 days/yr
- Unhealthy air days in 30 yrs
- 3 days/yr
Risk factors via First Street. Map © Google.
Why this score? — see what drove the D grade
The composite is a weighted blend of 9 inputs, each scored 0–100. Each bar is that input's sub-score; the figure is the points it added to the 100-point composite (weight × sub-score).
- Cash flow +13.7/30.0
- ARV discount +9.1/15.0
- Rent growth +4.3/5.0
- DSCR +4.2/10.0
- Livability +4.1/5.0
- 1% rule +3.5/10.0
- Schools +2.9/10.0
- Condition / age +2.5/5.0
- Appreciation +0.0/10.0
$285,000
🖨 Deal sheet (PDF) 📄 Offer letter ✓ Due diligence
Listing remarks MLS
Beautiful 3 bedroom 1 full 1 half bath townhome in Box Hill South. The first floor offers huge family room that leads to an open kitchen with an island and plenty of space for a table. A sliding glass door leads to the deck and fenced in rear yard that backs to common area. The second floor has three bedrooms, including the master with a large walk-in closet and an attached bath. Finished lower level with fireplace, storage, and laundry area. The carpet was just replaced in the entire home.
Key facts
- $85 HOA
- Built 1989
- Listed 10 days
Property features AI
Finance
- Other: Total below-grade finished area: 400 (assessor); Above-grade finished area: 1,240 (assessor); Ground rent paid annually
- HOA & community: HOA fee of $85 monthly
Exterior
- Parking: On-street parking
- Utilities: Public water; Public sewer; Electric service
- Home design: Interior townhouse/rowhouse; Fee simple ownership; Good condition; Year built estimated
- Construction: Vinyl siding; Block foundation; Asphalt roof; Partially finished basement with interior access and rough plumbing
- Exterior features: Fully fenced yard; Backs to open common area; Rear yard
Interior
- Bedrooms: 3 bedrooms on main level
- Flooring: Carpet; Wood floors
- Bathrooms: 1 full bathroom on main level; 1 half bathroom (total)
- Heating & cooling: Heat pump(s); Central A/C (electric); Electric hot water
- Interior features: Built-in shelving/units; Carpet; Ceiling fan(s); Dining area; Pantry; Walk-in closet(s); Wood floors; Has fireplace (1)
Neighborhood map
What this means for you Summary
Snapshot
- This is a 3-bed/1.5-bath townhouse listed at $285k.
Deal economics
- At list price, monthly cash flow is $23 ($278/yr) — positive.
- The deal already cash-flows at list — no discount required.
- To meet the 1% rule (rent ≥ 1% of price), the offer needs to be $243k (14.7% below list).
- Recommended offer: $243k (14.7% below list) — sets the bar for 1% rule.
- Cap rate 6.4% vs local median 4.2% in Bel Air South — top-decile yield for the area; either an underpriced asset or a hidden risk that comps aren't pricing in. Stress-test before assuming the spread holds.
Location & tenants
- Location reads 82/100 on livability (#33 in MD, #1,172 nationally) — a professional / high-income tenant draw. Strengths: employment A+, housing A+, health & safety A+; Watch: crime D, cost of living D.
- Harford County Public Schools (suburban): math 22% / reading 39% proficiency, ranked #9 of 24 in MD (top 38%) — families likely to look elsewhere, expect single-tenant / working-renter base with shorter leases.
- Zoned schools: Abingdon Elementary (math 20% / reading 25%, grade F, #292 of 860 statewide, top 34%, 658 students, 48% FRL); Edgewood Middle (math 7% / reading 31%, grade F, #155 of 225 statewide, top 70%, 999 students, 72% FRL); Edgewood High (math 43% / reading 54%, grade D, #111 of 222 statewide, top 50%, 1,415 students, 62% FRL) — zoned schools average 61% FRL vs 24% district-wide (36 pts higher); higher-poverty schools than district average — tighter screening recommended.
- Market conditions: Rents rising fast (+7.1%/yr); 160 active listings in the ZIP; 11 comparable units currently listed for rent nearby; rentals at typical pace (median 26d on market — plan ~3-4 weeks tenant-placement turnaround); high-income renter base; 803 units permitted in Harford County in 2024 (26 in 5+ unit buildings).
Forward outlook
- Local home prices are declining (-3.0%/yr); year-one equity from $2k of loan paydown is wiped out by about $9k of value loss. Plan a longer hold.
Negotiation context
- Only 11 days on market — expect competitive offers; lowballing is unlikely to land.
- 2 sale attempts since 25y ago; this cycle's ask is 46% above the opening price — seller raised mid-cycle; expect resistance to lowballs.
- Current owner paid $196k; 45% above their basis — modest negotiation headroom, anchor on the comps not their cost.
Risks & watch-outs
- Climate carrying-cost: major wind risk, 27% chance of damaging wind over 30y; extreme-heat days projected 7→15/yr by 2055 (HVAC capex compounding) — expect insurance premiums to compound above CPI over the hold.
Questions for the listing agent
- What does the HOA fee cover, when was the last increase, and are there any pending special assessments or reserve-fund shortfalls?
- Is there a deadline driving the sale (1031 exchange, divorce, estate, relocation)? That informs how much negotiation room exists.
- Schools are B-rated — typically a magnet for longer-tenancy family renters. What's the average tenant stay here, and is there a school-zone premium baked into asking?
- Crime grade is D in this area — have there been break-ins, vandalism, or insurance claims at this property in the last 3 years? What carrier currently insures it and at what premium?
- The area grade is low — what's the realistic commute time and amenity access for the typical tenant pool here? Any planned neighborhood developments (good or bad) we should know about?
- What's the average days-on-market for RENTAL listings here right now (not sales)? A rising rental-DOM trend means longer vacancies and softer asking-rent achievability than the comps imply.
- What's the recent tenant-quality profile in this submarket — average credit score on applications, eviction rate, late-payment / NSF rate, and stable-employment percentage? A property-management company in the area should have these aggregated.
- How much new for-sale + rental construction is in the pipeline within 1–3 miles? Heavy new supply typically softens prices + rents 12–24 months out; constrained supply supports both.
Investment metrics
- 1% rule
- 0.85% ✗
- Cap rate
- 6.39%
- Cash-on-cash
- 0.35%
- DSCR
- 1.02
- GRM
- 9.8
CMA / ARV
- ARV (on-the-fly)
- $295,200
- Comps found
- 12
Show comp detail 12 sales within ~0.75 mi
| Address | Dist | Beds/Ba | Sqft | Sold | Price | $/sf | Match |
|---|---|---|---|---|---|---|---|
| 3336 Racoon Ct | 0.05mi | 3/2.0 | 1,690 (+3%) | 1mo | $285,000 | $169 | 90 |
| 3315 Timberwolf Ct | 0.10mi | 3/2.5 | 1,690 (+3%) | 6mo | $305,000 | $180 | 81 |
| 3102 Holly Berry Ct | 0.25mi | 3/2.5 | 1,615 (-2%) | 5mo | $310,000 | $192 | 77 |
| 3322 Racoon Ct | 0.01mi | 3/2.0 | 1,860 (+13%) | 6mo | $251,000 | $135 | 71 |
| 3147 Thornapple Ct | 0.20mi | 3/3.0 | 1,826 (+11%) | 1mo | $315,000 | $173 | 65 |
| 3172 Hidden Ridge Ter | 0.41mi | 3/2.5 | 1,760 (+7%) | 2mo | $338,000 | $192 | 63 |
| 2910 Ruskin Ct | 0.66mi | 3/2.5 | 1,705 (+4%) | 6mo | $310,000 | $182 | 54 |
| 2931 Shelley Ct | 0.68mi | 3/3.5 | 1,588 (-3%) | 7mo | $324,900 | $205 | 49 |
| 2921 Shelley Ct | 0.68mi | 3/3.5 | 1,722 (+5%) | 3mo | $307,000 | $178 | 49 |
| 2932 Carlyle Ct | 0.70mi | 3/2.5 | 1,770 (+8%) | 6mo | $320,000 | $181 | 45 |
| 2835 Meredith Ct | 0.66mi | 3/2.5 | 1,842 (+12%) | 1mo | $330,000 | $179 | 44 |
| 2916 Carlyle Ct | 0.71mi | 4/2.5 (+1) | 1,800 (+10%) | 5mo | $243,000 | $135 | 37 |
Match score weights: distance 35% · size 25% · config 20% · recency 20%. Top-matched comps best support the ARV.
Projected returns pro-forma
-3.0% appreciation · 7.12% rent growth · sell at horizon
- IRR
- -11.4%
- Equity multiple
- 0.57×
- Total profit
- $-34,228
- Equity at exit
- $42,494
- IRR
- 2.8%
- Equity multiple
- 1.24×
- Total profit
- $18,924
- Equity at exit
- $24,642
Cash invested: $79,800 (down + closing). Projections, not guarantees.
Landlord ↔ Tenant lean methodology
- Overall (STATE)
- 27 Tenant-Leaning
- State Maryland
- 27 Tenant-Leaning · D+14
- County
- — inherits STATE
- City
- — inherits STATE
ZIP-level market 21009
- Rents YoY
- 7.1%
- Active inventory
- 160
- Price-to-rent
- 9.8×
Monthly cashflow live
- Estimated rent
- $2,430 high interval (Pro) →
- Mortgage (P&I)
- −$1,495
- Tax from tax record
- −$198 /mo · $2,377/yr
- Insurance
- −$119
- HOA
- −$85
- Vacancy / Maint / Mgmt
- −$510
- Net cashflow
- $23
Break-even live
Sensitivity live
| Price | -10% $184 | -5% $104 | +0% $23 | +5% $-58 | +10% $-138 |
|---|---|---|---|---|---|
| Rent | -10% $-169 | -5% $-73 | +0% $23 | +5% $119 | +10% $215 |
| Rate | -1.0pp $167 | -0.5pp $96 | base $23 | +0.5pp $-51 | +1.0pp $-126 |
UW: 25.0% down · 7.5% · 30yr · 1.5% tax · 5.0% vac · 8.0% maint · 8.0% mgmt
Financing live
Cash to close
- Down payment
- $71,250
- Closing costs
- $8,550
- Reserves months
- —
- Total cash needed
- —
Loan-product check · same deal, 3 products live
Conventional
25% down · 7.5% · 30yr
- Down + closing
- —
- Monthly P&I
- —
- Monthly cashflow
- —
- DSCR
- —
- Eligible?
- —
Personal DTI + credit; lowest rate.
DSCR
20% down · 8.5% · 30yr
- Down + closing
- —
- Monthly P&I
- —
- Monthly cashflow
- —
- DSCR
- —
- Eligible?
- —
No personal income docs; deal must DSCR.
Hard money
10% down · 12.0% · 12mo
- Down + closing
- —
- Monthly P&I
- —
- Monthly cashflow
- —
- DSCR
- —
- Eligible?
- —
Short-term bridge; refi at stabilization.
Rent comps 11 comps
| Address | Beds | Baths | Sqft | Rent | $/sqft | DOM | Units | Dist |
|---|---|---|---|---|---|---|---|---|
| 3406 Winter Moss Ct Abingdon, MD | 2.0 | 2.5 | 2004 | $2,300 | $1.15 | 14d | 1 | 0.16mi |
| 3405 McCurley Dr Abingdon, MD | 1.0–3.0 | 1.0–2.5 | 1263 | $3,264 | $2.58 | 0d | 27 | 0.68mi |
| 2814 Meredith Ct Abingdon, MD | 3.0 | 2.5 | 1320 | $2,300 | $1.74 | 25d | 1 | 0.70mi |
| 3361 Cheverly Ct Abingdon, MD | 3.0 | 2.5 | 1500 | $2,195 | $1.46 | 45d | 1 | 1.14mi |
| 158 Glen View Ter Abingdon, MD | 2.0 | 2.5 | 1176 | $1,995 | $1.70 | 19d | 1 | 1.27mi |
| 129 Long Meadow Ct Abingdon, MD | 3.0 | 1.5 | 1240 | $2,200 | $1.77 | 45d | 1 | 1.38mi |
| 307L Tall Pines Ct Unit L Abingdon, MD | 3.0 | 2.0 | 1300 | $2,399 | $1.85 | 16d | 1 | 1.41mi |
| 2509 Merrick Ct Abingdon, MD | 3.0 | 1.5 | 1230 | $1,900 | $1.54 | 45d | 1 | 1.44mi |
| 2902 Indiansummer Ct Abingdon, MD | 3.0 | 3.5 | 2180 | $2,350 | $1.08 | 45d | 1 | 1.44mi |
| 618 Milford Ct Abingdon, MD | 3.0 | 2.5 | 1540 | $2,450 | $1.59 | 25d | 1 | 1.45mi |
| 618 Milford Ct Abingdon, MD | 3.0 | 2.5 | 1540 | $2,450 | $1.59 | 6d | 1 | 1.45mi |
HOA detail
- Monthly dues
- $85 · $1,020/yr
Listing history 14 events
-
2026-06-21days on market $285,000 Active 11 DOM
-
2026-06-18days on market $285,000 Active 8 DOM
-
2026-06-17days on market $285,000 Active 7 DOM
-
2026-06-16days on market $285,000 Active 6 DOM
-
2026-06-15days on market $285,000 Active 5 DOM
-
2026-06-13statusdays on market $285,000 Active 3 DOM
-
2026-06-09days on market $285,000 Coming Soon 9 DOM
-
2026-06-08days on market $285,000 Coming Soon 8 DOM
-
2026-06-07days on market $285,000 Coming Soon 7 DOM
-
2026-06-04days on market $285,000 Coming Soon 4 DOM
-
2026-06-03days on market $285,000 Coming Soon 3 DOM
-
2026-06-02days on market $285,000 Coming Soon 2 DOM
-
2026-06-01remarks 687-char remark
-
2026-06-01$285,000 Coming Soon 1 DOM
ⓘ Source: listings_history table (triggers on properties + properties_extension) + one-shot
backfill from property_details.listing_events for pre-trigger history.
Tax reassessment forecast MD · Partial reset (capped growth)
- Current annual tax
- $2,377 · $198/mo
- Projected year-2 tax
- $2,742 · $228/mo
- Expected delta
- +$365/yr (+$30/mo · 15.3%)
ⓘ Screening estimate from a state-policy table — verify with the county assessor before closing.
Climate risk First Street
- Flood 1/10 Low FEMA zone X (unshaded) · 0% chance over 30 yrs
- Wildfire 1/10 Low
- Heat 7/10 Severe 7 d/yr ≥104°F today · 15 d/yr by 30 yrs out
- Wind 6/10 Major 27% chance of damaging wind over 30 yrs
- Air quality 3/10 Moderate 2 unhealthy d/yr today · 3 by 30 yrs out
Nearby sold comps map
Loading sold comps map…
Walkable amenities ~0.75 mi
Loading nearby amenities…
Taxation est. · year 1
- Rental income
- $29,158
- − Mortgage interest
- −$15,964
- − Property taxes
- −$2,377
- − Insurance
- −$1,425
- − Repairs & maintenance
- −$2,333
- − Management
- −$2,333
- − HOA
- −$1,020
- − Depreciation
- −$8,291
- Taxable loss
- −$4,585
- Est. tax savings @ 24.0%
- +$1,100
- After-tax cash flow
- $1,378/yr
For passive investors: Depreciation is non-cash, so a rental often shows a tax loss while cash-flowing — sheltering income. Rental losses are passive: they offset passive income freely, and up to $25,000/yr can offset ordinary (W-2) income if you actively participate and your MAGI is under $100k (phasing out to $0 by $150k); unused losses carry forward. On sale, claimed depreciation is recaptured at up to 25%, and gains may owe capital-gains tax (a 1031 exchange can defer both). Figures are a year-1 estimate at your 24.0% rate — not tax advice; consult a CPA.
Schools (NCES district)
- District
- Harford County Public Schools
- NCES district ID
- 2400390
- Math proficiency
- 22% ▼ -23.00%
- Reading proficiency
- 39% ▼ -12.00%
- Median HH income
- $79,569
- Composite
- 29.38/100
- National rank
- #6527
- State rank
- #9 of 24 in MD
Livability — Bel Air South
- Score
- 82/100
- State rank
- #33
- US rank
- #1172
Category grades
Schools grade is shown separately in the Schools card above.
Census & demographics
- Census place
- Bel Air South, MD
- County
- Harford County · 198,512 people
- City population
- 63,895
- Metro
- Baltimore-Columbia-Towson, MD
- Population (ZIP)
- 33,679
- Household income
- $121,660
- Rent vs Own
- Severe rent burden
- 437.0
Population outlook (Harford County) Hauer SSP2
- Today (2025)
- 262,292 people
- By 2030
- 266,437 · +1.6%
- By 2040
- 269,954 · +2.9%
- By 2050
- 265,659 · +1.3%
- By 2075
- 252,886 · -3.6%
- By 2100
- 224,014 · -14.6%
Race, ethnicity, and origin ACS 2023
- Neighborhood character
- Predominantly White (68%)
- Race & ethnicity
- White 68% Black 18% Hispanic / Latino 6% Asian 4% Two or more races 4%
- Hispanic origin (detail)
- Mexican 2% Puerto Rican 1%
- Common ancestry
- Romanian 5% Lithuanian 2% Slovak 2%
- Foreign-born
- 7% · Canada, South Korea, China
- Languages at home
- 89% English-only · Spanish 3% Other Indo-European 2% Other Asian/Pacific 1%
Political lean MEDSL · Harford
- 2024 margin
- R (+13.8) · D 41.9% · R 55.7% · Other 2.4%
- 2008→2024 swing
- +5.0pp toward D · 2008: -18.8pp · 2024: -13.8pp
- All cycles
- 2024: R+13.8 2020: R+12.0 2016: R+24.5 2012: R+19.5 2008: R+18.8
Not yet ingested
- Civics
- —
Market trends
- HPI YoY
- ▼ -176.25%
- Current HPI
- 251.4376
- Rent YoY
- ▲ 7.12%
- Metro
- Baltimore-Columbia-Towson, MD
- State GDP YoY
- ▲ 2.97%
- F500 in state
- 12
Industry mix (Fortune 500 HQ in MD)
| Industry | F500 HQs | Revenue |
|---|---|---|
| Aerospace / Defense | 1 | $71B |
|
||
| Utilities | 1 | $25B |
|
||
| Hotels | 1 | $24B |
|
||
| Consumer Goods | 1 | $7B |
|
||
| Real Estate | 1 | $6B |
|
||
| Chemicals | 1 | $2B |
|
||
Price history
+234.1% since first listed12 events — show timeline
- 2026-05-31 Coming Soon $285,000 BRIGHT MLS
- 2020-01-30 Sold (MLS) $195,900 BRIGHT MLS
- 2019-12-31 Pending — BRIGHT MLS
- 2019-12-31 Price Changed $195,900 BRIGHT MLS
- 2019-12-05 Price Changed $189,900 BRIGHT MLS
- 2019-10-18 Listed $195,000 BRIGHT MLS
- 2001-06-20 Sold (Public Records) $103,000 Public Records
- 2001-05-10 Sold (MLS) $103,000 MRIS
- 2001-04-02 Delisted — MRIS
- 2001-03-05 Listed $105,000 MRIS
- 1993-04-30 Sold (Public Records) $90,000 Public Records
- 1988-12-30 Sold (Public Records) $85,300 Public Records
Property tax history
+2.3%/yrLatest (2025): $2,377 · +7.4% YoY. Source: county tax records.
Cash-flow waterfall
monthlySold comps — $/sqft
last 12 mo · ≤1 miLoading sold comps…