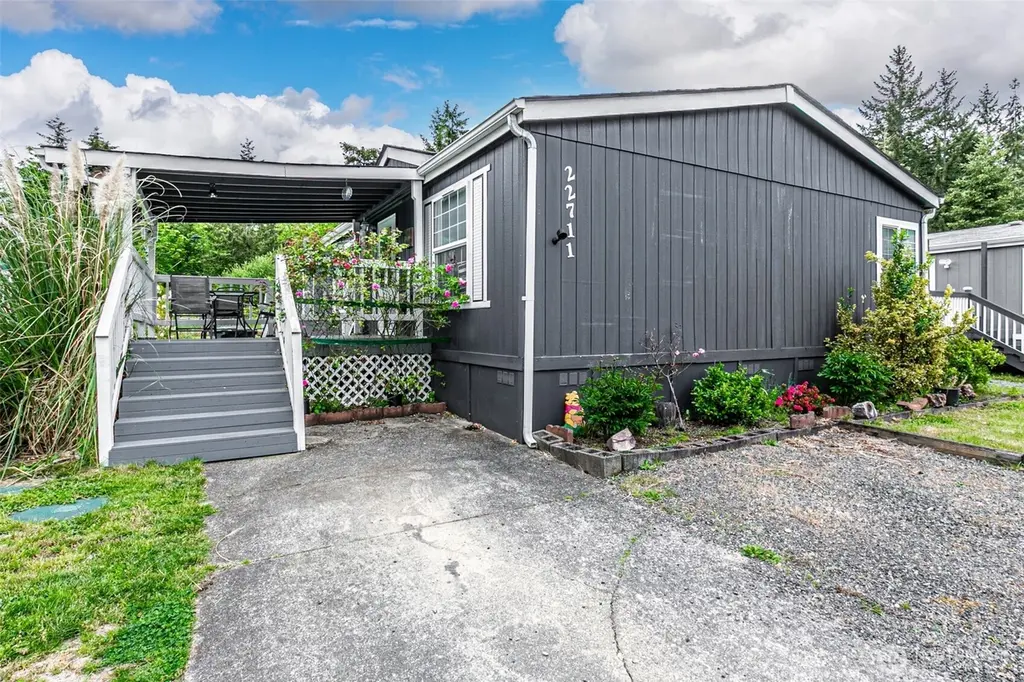
22711 91st Avenue Ct E · Graham, WA
Flood risk 3/10 · Minor
- FEMA flood zone
- X (unshaded)
- Chance of flooding over 30 yrs
- 0.2%
- Est. flood insurance / yr
- $507 – $1,088
Fire risk 1/10 · Minimal
- Est. fire insurance / yr
- $604 – $1,122
Heat risk 3/10 · Minor
- Hot days now (above 87°F)
- 7 days/yr
- Hot days in 30 yrs
- 15 days/yr
Wind risk 1/10 · Minimal
- Chance of severe wind over 30 yrs
- —
Air-quality risk 7/10 · Major
- Unhealthy air days now
- 9 days/yr
- Unhealthy air days in 30 yrs
- 11 days/yr
Risk factors via First Street. Map © Google.
Why this score? — see what drove the B- grade
The composite is a weighted blend of 9 inputs, each scored 0–100. Each bar is that input's sub-score; the figure is the points it added to the 100-point composite (weight × sub-score).
- Cash flow +30.0/30.0
- 1% rule +10.0/10.0
- DSCR +10.0/10.0
- Schools +4.9/10.0
- Condition / age +3.8/5.0
- Rent growth +3.3/5.0
- Livability +3.2/5.0
- ARV discount +0.0/15.0
- Appreciation +0.0/10.0
$164,950
🖨 Deal sheet (PDF) 📄 Offer letter ✓ Due diligence
Listing remarks
Fresh and move-in ready, this beautiful 1,296 sq. ft. home is located in a quiet all-ages community and feels just like home as soon as you enter. The spacious kitchen featuring a huge walk-in pantry opens to a bright great room and casual dining area, creating an inviting space for everyday living and entertaining. The private primary suite features a full adjoining bath with soaking tub and walk-in closet, while two additional bedrooms and a full bath are located on the opposite side of the home for added privacy and functionality. Enjoy relaxing mornings or evenings on the covered front deck and step outside to a peaceful and spacious backyard with a greenbelt setting for added privacy.
Key facts
- Greenbelt setting
- Spacious backyard
- Covered front deck
Tags
Property features AI
Finance
- Other: Buyer to verify schools
- Financial info: Listing terms: Cash or Conventional; Land lease amount applies
- HOA & community: Located in The Ridge manufactured home park; Park has approximately 40 homes; Park amenities include common area, high-speed internet availability, recreational area, and RV parking; Land lease applies
Exterior
- Parking: RV parking available in the park
- Utilities: Electric energy; Public water; Septic sewer; TPU power company; Xfinity internet available
- Home design: Manufactured home (double wide); One level; Entry level information not specified; Mobile home remains
- Construction: Wood construction; Composition roof; Tie down foundation (see remarks)
- Exterior features: Wood exterior; Wood products; Paved lot
Interior
- Kitchen: Dishwasher; Microwave; Refrigerator; Stove/Range
- Bedrooms: 3 bedrooms
- Flooring: Vinyl; Carpet
- Bathrooms: 2 full bathrooms; 2 bathtubs; 2 showers
- Heating & cooling: Forced air heating; No cooling
- Interior features: Dining room; Family room; Living room; Kitchen with eating space; Utility room; Walk-in pantry; Jetted/soaking tub; Double pane windows; Landscaped; Patio/porch/deck
- Laundry & utility: Washer; Dryer; Utility room
Neighborhood map
What this means for you Summary
Snapshot
- This is a 3-bed/2.0-bath manufactured listed at $165k. Condition is rated good.
Deal economics
- At list price, monthly cash flow is $1k ($12k/yr) — positive.
- The deal already cash-flows at list — no discount required.
- Meets the 1% rule at list price ($3k rent vs $165k).
- Recommended offer: $160k (3.0% below list) — sets the bar for market timing.
- Cap rate 13.8% vs local median 3.6% in Graham — top-decile yield for the area; either an underpriced asset or a hidden risk that comps aren't pricing in. Stress-test before assuming the spread holds.
Location & tenants
- Location reads 64/100 on livability (#373 in WA) — a middle-class / working-renter tenant base. Strengths: employment A+, housing A+; Watch: crime C-, health & safety C-, amenities F.
- Bethel School District (suburban): math 47% / reading 59% proficiency, ranked #103 of 291 in WA (top 35%) — acceptable for families but not a draw, mixed tenant base, ~2y average lease.
- Zoned schools: Elk Plain School of Choice (570 students, 39% FRL); Frontier Middle School (647 students, 44% FRL); Graham Kapowsin High School (2,011 students, 49% FRL).
- Market conditions: Rents rising (+3.3%/yr); 236 active listings in the ZIP; high-income renter base; 3,209 units permitted in Pierce County in 2024 (1,269 in 5+ unit buildings).
Forward outlook
- Local home prices are declining (-3.0%/yr); year-one equity from $1k of loan paydown is wiped out by about $5k of value loss. Plan a longer hold.
- Pierce County population projected at +26% by 2050 — long-run rental-demand tailwind backs the buy-and-hold thesis.
- At projected returns (-3.0% appreciation + 3.3% rent growth), your $46k cash investment doubles in ~5 years — after that, you're playing with house money.
Negotiation context
- It's been on market 31 days — a 3% lower offer ($160k) is reasonable based on typical stale-listing flexibility.
Questions for the listing agent
- It's been on market 31 days. Have you received any prior offers? Is the seller open to a 3% concession, seller financing, or rate buy-down credit?
- Is there a deadline driving the sale (1031 exchange, divorce, estate, relocation)? That informs how much negotiation room exists.
- What's the average days-on-market for RENTAL listings here right now (not sales)? A rising rental-DOM trend means longer vacancies and softer asking-rent achievability than the comps imply.
- What's the recent tenant-quality profile in this submarket — average credit score on applications, eviction rate, late-payment / NSF rate, and stable-employment percentage? A property-management company in the area should have these aggregated.
- How much new for-sale + rental construction is in the pipeline within 1–3 miles? Heavy new supply typically softens prices + rents 12–24 months out; constrained supply supports both.
Investment metrics
- 1% rule
- 1.67% ✓
- Cap rate
- 13.79%
- Cash-on-cash
- 26.77%
- DSCR
- 2.19
- GRM
- 5.0
CMA / ARV
- ARV (on-the-fly)
- $129,600
- Comps found
- 7
Show comp detail 7 sales within ~0.75 mi
| Address | Dist | Beds/Ba | Sqft | Sold | Price | $/sf | Match |
|---|---|---|---|---|---|---|---|
| 22505 91st Ave E | 0.06mi | 3/2.0 | 1,344 (+4%) | 6mo | $113,300 | $84 | 86 |
| 22607 91st Avenue Ct E #10 | 0.02mi | 3/2.0 | 1,344 (+4%) | 15mo | $150,000 | $112 | 80 |
| 9016 220th Street Ct E | 0.40mi | 3/2.0 | 1,288 (-1%) | 3mo | $405,000 | $314 | 78 |
| 22716 91st Avenue Ct E #40 | 0.04mi | 3/2.0 | 1,232 (-5%) | 20mo | $120,000 | $97 | 73 |
| 22210 92nd Avenue Ct E #6 | 0.27mi | 3/2.0 | 1,294 (-0%) | 18mo | $130,000 | $100 | 72 |
| 9005 219th Street Ct E | 0.49mi | 3/2.0 | 1,340 (+3%) | 1mo | $380,000 | $284 | 70 |
| 8911 226th St E #18 | 0.16mi | 3/2.0 | 1,188 (-8%) | 18mo | $105,000 | $88 | 64 |
Match score weights: distance 35% · size 25% · config 20% · recency 20%. Top-matched comps best support the ARV.
Projected returns pro-forma
-3.0% appreciation · 3.32% rent growth · sell at horizon
- IRR
- 21.0%
- Equity multiple
- 1.86×
- Total profit
- $39,820
- Equity at exit
- $24,595
- IRR
- 29.4%
- Equity multiple
- 3.66×
- Total profit
- $123,005
- Equity at exit
- $14,262
Cash invested: $46,186 (down + closing). Projections, not guarantees.
Landlord ↔ Tenant lean methodology
- Overall (STATE)
- 28 Tenant-Leaning
- State Washington
- 28 Tenant-Leaning · D+8
- County
- — inherits STATE
- City
- — inherits STATE
ZIP-level market 98338
- Rents YoY
- 3.3%
- Active inventory
- 236
- Price-to-rent
- 5.0×
Monthly cashflow live
- Estimated rent
- $2,747 medium interval (Pro) →
- Mortgage (P&I)
- −$865
- Tax est. 1.5%
- −$206 /mo · $2,474/yr
- Insurance
- −$69
- HOA
- −$0
- Vacancy / Maint / Mgmt
- −$577
- Net cashflow
- $1,030
Break-even live
Sensitivity live
| Price | -10% $1,144 | -5% $1,087 | +0% $1,030 | +5% $973 | +10% $916 |
|---|---|---|---|---|---|
| Rent | -10% $813 | -5% $922 | +0% $1,030 | +5% $1,139 | +10% $1,247 |
| Rate | -1.0pp $1,113 | -0.5pp $1,072 | base $1,030 | +0.5pp $988 | +1.0pp $944 |
UW: 25.0% down · 7.5% · 30yr · 1.5% tax · 5.0% vac · 8.0% maint · 8.0% mgmt
Financing live
Cash to close
- Down payment
- $41,238
- Closing costs
- $4,948
- Reserves months
- —
- Total cash needed
- —
Loan-product check · same deal, 3 products live
Conventional
25% down · 7.5% · 30yr
- Down + closing
- —
- Monthly P&I
- —
- Monthly cashflow
- —
- DSCR
- —
- Eligible?
- —
Personal DTI + credit; lowest rate.
DSCR
20% down · 8.5% · 30yr
- Down + closing
- —
- Monthly P&I
- —
- Monthly cashflow
- —
- DSCR
- —
- Eligible?
- —
No personal income docs; deal must DSCR.
Hard money
10% down · 12.0% · 12mo
- Down + closing
- —
- Monthly P&I
- —
- Monthly cashflow
- —
- DSCR
- —
- Eligible?
- —
Short-term bridge; refi at stabilization.
Listing history 16 events
-
2026-06-21days on market $164,950 Active 31 DOM
-
2026-06-18days on market $164,950 Active 28 DOM
-
2026-06-17days on market $164,950 Active 27 DOM
-
2026-06-16days on market $164,950 Active 26 DOM
-
2026-06-15days on market $164,950 Active 25 DOM
-
2026-06-13days on market $164,950 Active 23 DOM
-
2026-06-13days on market $164,950 Active 22 DOM
-
2026-06-09days on market $164,950 Active 19 DOM
-
2026-06-08days on market $164,950 Active 18 DOM
-
2026-06-07days on market $164,950 Active 17 DOM
-
2026-06-04days on market $164,950 Active 14 DOM
-
2026-06-03days on market $164,950 Active 13 DOM
-
2026-06-02days on market $164,950 Active 12 DOM
-
2026-06-01days on market $164,950 Active 11 DOM
-
2026-05-31days on market $164,950 Active 10 DOM
-
2026-05-21$164,950 Active
ⓘ Source: listings_history table (triggers on properties + properties_extension) + one-shot
backfill from property_details.listing_events for pre-trigger history.
Climate risk First Street
- Flood 3/10 Moderate FEMA zone X (unshaded) · 20% chance over 30 yrs
- Wildfire 1/10 Low
- Heat 3/10 Moderate 7 d/yr ≥87°F today · 15 d/yr by 30 yrs out
- Wind 1/10 Low
- Air quality 7/10 Severe 9 unhealthy d/yr today · 11 by 30 yrs out
Nearby sold comps map
Loading sold comps map…
Walkable amenities ~0.75 mi
Loading nearby amenities…
Taxation est. · year 1
- Rental income
- $32,966
- − Mortgage interest
- −$9,240
- − Property taxes
- −$2,474
- − Insurance
- −$825
- − Repairs & maintenance
- −$2,637
- − Management
- −$2,637
- − Depreciation
- −$4,799
- Taxable income
- $10,354
- Est. tax owed @ 24.0%
- −$2,485
- After-tax cash flow
- $9,879/yr
For passive investors: Depreciation is non-cash, so a rental often shows a tax loss while cash-flowing — sheltering income. Rental losses are passive: they offset passive income freely, and up to $25,000/yr can offset ordinary (W-2) income if you actively participate and your MAGI is under $100k (phasing out to $0 by $150k); unused losses carry forward. On sale, claimed depreciation is recaptured at up to 25%, and gains may owe capital-gains tax (a 1031 exchange can defer both). Figures are a year-1 estimate at your 24.0% rate — not tax advice; consult a CPA.
Condition & rehab AI · 30 photos
This move-in ready home offers a good condition with minor updates needed for a fresh look and increased value.
Repairs flagged
- Minor Kitchen cabinets — Worn appearance
- Minor Kitchen countertops — Need cleaning
Value-add opportunities
- Both Paint freshening — Fresh paint enhances curb appeal and interior
- Both Kitchen cabinet refinishing — Refinishing worn cabinets improves aesthetics and functionality
- Both Landscaping enhancement — Enhanced landscaping improves curb appeal and adds value
Renovation cost estimate screening
| Repair item | Severity | Est. cost |
|---|---|---|
| Kitchen cabinets · Worn appearance | Minor | $500–3,000 |
| Kitchen countertops · Need cleaning | Minor | $500–3,000 |
| Total estimated repair cost · 2 items | $1,000–6,000 |
Value-add ROI direction
- Both Paint freshening — Fresh paint enhances curb appeal and interior ↑
- Both Kitchen cabinet refinishing — Refinishing worn cabinets improves aesthetics and functionality ↑
- Both Landscaping enhancement — Enhanced landscaping improves curb appeal and adds value ↑
ⓘ Cost ranges are severity-bucket heuristics (US national rule-of-thumb). Get contractor quotes + a written scope before underwriting a rehab budget.
Schools (NCES district)
- District
- Bethel School District
- NCES district ID
- 5300480
- Math proficiency
- 47% ▬ 0.00%
- Reading proficiency
- 59% ▲ 2.00%
- Median HH income
- $65,872
- Composite
- 48.66/100
- National rank
- #4568
- State rank
- #103 of 291 in WA
Livability — Graham
- Score
- 64/100
- State rank
- #373
- US rank
- #14219
Category grades
Schools grade is shown separately in the Schools card above.
Census & demographics
- Census place
- Graham, WA
- County
- Pierce County · 788,257 people
- City population
- 32,687
- Metro
- Seattle-Tacoma-Bellevue, WA
- Population (ZIP)
- 32,687
- Household income
- $114,819
- Rent vs Own
- Severe rent burden
- 236.0
Population outlook (Pierce County) Hauer SSP2
- Today (2025)
- 956,648 people
- By 2030
- 1,010,862 · +5.7%
- By 2040
- 1,113,170 · +16.4%
- By 2050
- 1,206,524 · +26.1%
- By 2075
- 1,436,425 · +50.2%
- By 2100
- 1,563,654 · +63.5%
Race, ethnicity, and origin ACS 2023
- Neighborhood character
- Predominantly White (71%)
- Race & ethnicity
- White 71% Two or more races 15% Hispanic / Latino 12% Asian 3% Black 3% Pacific Islander 2% Native American 1%
- Hispanic origin (detail)
- Mexican 7%
- Common ancestry
- Italian 4% Portuguese 4% Iranian 3%
- Foreign-born
- 7% · Canada, South Korea, China
- Languages at home
- 88% English-only · Spanish 5% Russian/Polish/Slavic 2% Other Asian/Pacific 1%
Political lean MEDSL · Pierce
- 2024 margin
- D (+10.8) · D 53.9% · R 43.1% · Other 3.0%
- 2008→2024 swing
- -1.4pp toward R · 2008: 12.2pp · 2024: 10.8pp
- All cycles
- 2024: D+10.8 2020: D+11.2 2016: D+7.5 2012: D+11.0 2008: D+12.2
Not yet ingested
- Civics
- —
Market trends
- HPI YoY
- ▼ -501.28%
- Current HPI
- 304.4241
- Rent YoY
- ▲ 3.32%
- Metro
- Seattle-Tacoma-Bellevue, WA
- State GDP YoY
- ▲ 4.65%
- F500 in state
- 22
Industry mix (Fortune 500 HQ in WA)
| Industry | F500 HQs | Revenue |
|---|---|---|
| Retail | 2 | $269B |
|
||
| Technology / Retail | 1 | $638B |
|
||
| Technology | 1 | $245B |
|
||
| Telecommunications | 1 | $38B |
|
||
| Food / Beverage | 1 | $36B |
|
||
| Automotive / Trucks | 1 | $34B |
|
||
Price history
1 event — show timeline
- 2026-05-21 Listed $164,950 NWMLS as Distributed by MLS Grid
Cash-flow waterfall
monthlySold comps — $/sqft
last 12 mo · ≤1 miLoading sold comps…