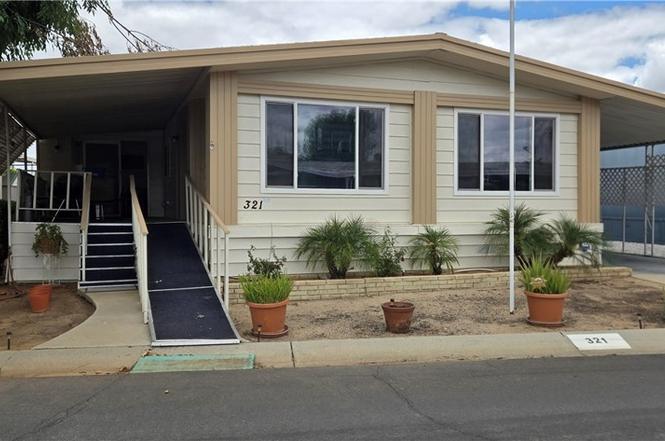
27601 Sun City Blvd #321 · Menifee, CA
Flood risk 1/10 · Minimal
- FEMA flood zone
- X (unshaded)
- Chance of flooding over 30 yrs
- 0.0%
- Est. flood insurance / yr
- $507 – $1,088
Fire risk 7/10 · Major
- Est. fire insurance / yr
- $659 – $1,223
Heat risk 7/10 · Major
- Hot days now (above 105°F)
- 5 days/yr
- Hot days in 30 yrs
- 14 days/yr
Wind risk 1/10 · Minimal
- Chance of severe wind over 30 yrs
- —
Air-quality risk 5/10 · Moderate
- Unhealthy air days now
- 9 days/yr
- Unhealthy air days in 30 yrs
- 11 days/yr
Risk factors via First Street. Map © Google.
Why this score? — see what drove the B+ grade
The composite is a weighted blend of 9 inputs, each scored 0–100. Each bar is that input's sub-score; the figure is the points it added to the 100-point composite (weight × sub-score).
- Cash flow +30.0/30.0
- ARV discount +15.0/15.0
- 1% rule +10.0/10.0
- DSCR +10.0/10.0
- Schools +4.5/10.0
- Rent growth +4.0/5.0
- Livability +3.2/5.0
- Condition / age +2.5/5.0
- Appreciation +0.0/10.0
$167,000
🖨 Deal sheet 📄 Offer letter ✓ Due diligence
Listing remarks MLS
Triple Wide located in Sun City Estates offering over 1,700 sq feet of living space. This home is turn-key with lots of upgrades. Bamboo flooring, new carpet, white shaker cabinets in kitchen with brushed nickel hardware. Massive family room with wood accented ceiling. Dining room is also good size with built in hutch. Just around the corner is the kitchen open to the living room with rounded island, built in appliances and ample cabinet space. Perfect space for those who enjoy entertaining and spending time in the kitchen. Guest bedroom has new carpet and new closet doors. Primary bedroom is large with walk in closet and ensuite bath with tub and shower. Interior laundry room. High end HVAC unit. Extra storage outside. New interior paint. Newer exterior trim paint work has been done as well, offering great curb appeal. Large covered patio area. Enclosed room off rear perfect for a small workshop. Great clubhouse with swimming pool, spa and workout room. Close to all amenities. Make this home a must see.
Key facts
- Gated community
- Beautiful hill views
- Open beam ceilings
Tags
Property features AI
Finance
- Other: Park name: Sun City Estates
- Financial info: Land lease $707 monthly
- HOA & community: Part of an association; Senior community; Community has curbs; Suburban setting; Located in Sun City Estates (land lease community)
Exterior
- Parking: 2 covered carport spaces
- Utilities: Public sewer; District/Public water
- Home design: Single-story; Mobile home remains on site; Mobile home approx. 24' x 60'; 3 sheds on property
- Construction: Year built per assessor; Living area per assessor's data
- Exterior features: Association pool; Yard
Interior
- Kitchen: Gas cooktop; Gas oven
- Bedrooms: Main floor primary bedroom; Main floor bedroom
- Bathrooms: 2 full bathrooms
- Heating & cooling: Forced air heating; Evaporative cooling
- Interior features: Front south entry; Entry at main level; Double-pane windows
- Laundry & utility: Dedicated laundry room; Washer included; Dryer included
Neighborhood map
What this means for you Summary
Snapshot
- This is a 2-bed/2.0-bath manufactured listed at $167k.
Deal economics
- At list price, monthly cash flow is $902 ($11k/yr) — positive.
- The deal already cash-flows at list — no discount required.
- Meets the 1% rule at list price ($3k rent vs $167k).
- Cap rate 12.8% vs local median 3.6% in Menifee — top-decile yield for the area; either an underpriced asset or a hidden risk that comps aren't pricing in. Stress-test before assuming the spread holds.
Location & tenants
- Location reads 64/100 on livability (#407 in CA) — a middle-class / working-renter tenant base. Strengths: housing A+, crime A, employment A-; Watch: schools D+, health & safety D+, amenities D.
- Menifee Union Elementary (suburban): math 43% / reading 56% proficiency, ranked #434 of 1,400 in CA (top 31%) — families likely to look elsewhere, expect single-tenant / working-renter base with shorter leases.
- Market conditions: Rents rising fast (+6.1%/yr); 197 active listings in the ZIP; 22 comparable units currently listed for rent nearby; rentals leasing fast (median 2d on market — plan ~1-2 weeks tenant-placement turnaround); 9,195 units permitted in Riverside County in 2024 (1,512 in 5+ unit buildings).
- At $2,603/mo this rent would consume 54% of the median local household income ($58k/yr) (locally 1163% of renters already pay >50% of income on rent) — very limited rent-growth headroom before tenants either downsize or default.
Forward outlook
- Local home prices are declining (-3.0%/yr); year-one equity from $1k of loan paydown is wiped out by about $5k of value loss. Plan a longer hold.
- Riverside County population projected at +22% by 2050 — long-run rental-demand tailwind backs the buy-and-hold thesis.
- At projected returns (-3.0% appreciation + 6.1% rent growth), your $47k cash investment doubles in ~5 years — after that, you're playing with house money.
Negotiation context
- Only 7 days on market — expect competitive offers; lowballing is unlikely to land.
- 12 sale attempts since 22y ago; this cycle's ask is 11% above the opening price — seller raised mid-cycle; expect resistance to lowballs.
- Current owner paid $145k; 15% above their basis — modest negotiation headroom, anchor on the comps not their cost.
Risks & watch-outs
- Climate carrying-cost: major wildfire risk; extreme-heat days projected 5→14/yr by 2055 (HVAC capex compounding) — expect insurance premiums to compound above CPI over the hold.
Questions for the listing agent
- Built in 1977 — when were the roof, HVAC, electrical panel, plumbing, and water heater last replaced?
- Is there a deadline driving the sale (1031 exchange, divorce, estate, relocation)? That informs how much negotiation room exists.
- Schools are D-rated, which usually means shorter tenancies and higher turnover. Who's the typical renter profile here, and what's been the actual vacancy rate?
- What's the average days-on-market for RENTAL listings here right now (not sales)? A rising rental-DOM trend means longer vacancies and softer asking-rent achievability than the comps imply.
- What's the recent tenant-quality profile in this submarket — average credit score on applications, eviction rate, late-payment / NSF rate, and stable-employment percentage? A property-management company in the area should have these aggregated.
- How much new for-sale + rental construction is in the pipeline within 1–3 miles? Heavy new supply typically softens prices + rents 12–24 months out; constrained supply supports both.
Investment metrics
- 1% rule
- 1.56% ✓
- Cap rate
- 12.77%
- Cash-on-cash
- 23.15%
- DSCR
- 2.03
- GRM
- 5.3
CMA / ARV
- ARV (on-the-fly)
- $204,240
- Comps found
- 12
Show comp detail 12 sales within ~0.75 mi
| Address | Dist | Beds/Ba | Sqft | Sold | Price | $/sf | Match |
|---|---|---|---|---|---|---|---|
| 27601 Sun City Blvd Sp 127 | 0.09mi | 2/2.0 | 1,704 (-4%) | 12mo | $85,000 | $50 | 79 |
| 27601 Sun City Blvd #312 | 0.01mi | 2/2.0 | 1,636 (-8%) | 11mo | $180,000 | $110 | 77 |
| 27601 Sun City #292 | 0.16mi | 2/2.0 | 1,632 (-8%) | 12mo | $110,000 | $67 | 69 |
| 27250 Murrieta Rd #1 | 0.65mi | 3/2.0 (+1) | 1,830 (+3%) | 6mo | $127,500 | $70 | 55 |
| 27250 Murrieta #85 | 0.65mi | 2/2.0 | 1,570 (-12%) | 0mo | $145,000 | $92 | 50 |
| 27250 Murrieta Rd #332 | 0.65mi | 2/2.0 | 1,570 (-12%) | 1mo | $160,000 | $102 | 49 |
| 27250 Murrieta #126 | 0.56mi | 3/2.0 (+1) | 1,568 (-12%) | 0mo | $225,000 | $143 | 49 |
| 27250 Murrieta #84 | 0.65mi | 2/2.0 | 1,560 (-12%) | 4mo | $179,900 | $115 | 46 |
| 27250 Murrieta Rd #241 | 0.51mi | 3/2.0 (+1) | 1,547 (-13%) | 8mo | $216,800 | $140 | 43 |
| 27250 Murrieta Rd #298 | 0.65mi | 3/2.0 (+1) | 1,568 (-12%) | 4mo | $210,000 | $134 | 42 |
| 27250 Murrieta Rd #304 | 0.65mi | 3/2.0 (+1) | 1,537 (-14%) | 3mo | $219,500 | $143 | 40 |
| 27250 Murrieta Rd #225 | 0.65mi | 3/2.0 (+1) | 1,568 (-12%) | 10mo | $222,500 | $142 | 37 |
Match score weights: distance 35% · size 25% · config 20% · recency 20%. Top-matched comps best support the ARV.
Projected returns pro-forma
-3.0% appreciation · 6.1% rent growth · sell at horizon
- IRR
- 19.6%
- Equity multiple
- 1.83×
- Total profit
- $38,795
- Equity at exit
- $24,900
- IRR
- 30.0%
- Equity multiple
- 4.09×
- Total profit
- $144,519
- Equity at exit
- $14,439
Cash invested: $46,760 (down + closing). Projections, not guarantees.
Landlord ↔ Tenant lean methodology
- Overall (STATE)
- 18 Strongly Tenant-Friendly
- State California
- 18 Strongly Tenant-Friendly · D+13
- County
- — inherits STATE
- City
- — inherits STATE
ZIP-level market 92586
- Home prices YoY
- -19.1%
- Rents YoY
- 6.1%
- Active inventory
- 197
- Price-to-rent
- 5.3×
Monthly cashflow live
- Estimated rent
- $2,603 high interval (Pro) →
- Mortgage (P&I)
- −$876
- Tax est. 1.5%
- −$209 /mo · $2,505/yr
- Insurance
- −$70
- HOA
- −$0
- Vacancy / Maint / Mgmt
- −$547
- Net cashflow
- $902
Break-even live
UW: 25.0% down · 7.5% · 30yr · 1.5% tax · 5.0% vac · 8.0% maint · 8.0% mgmt
Financing live
Cash to close
- Down payment
- $41,750
- Closing costs
- $5,010
- Reserves months
- —
- Total cash needed
- —
Loan-product check · same deal, 3 products live
Conventional
25% down · 7.5% · 30yr
- Down + closing
- —
- Monthly P&I
- —
- Monthly cashflow
- —
- DSCR
- —
- Eligible?
- —
Personal DTI + credit; lowest rate.
DSCR
20% down · 8.5% · 30yr
- Down + closing
- —
- Monthly P&I
- —
- Monthly cashflow
- —
- DSCR
- —
- Eligible?
- —
No personal income docs; deal must DSCR.
Hard money
10% down · 12.0% · 12mo
- Down + closing
- —
- Monthly P&I
- —
- Monthly cashflow
- —
- DSCR
- —
- Eligible?
- —
Short-term bridge; refi at stabilization.
Rent comps 22 comps
| Address | Beds | Baths | Sqft | Rent | $/sqft | DOM | Units | Dist |
|---|---|---|---|---|---|---|---|---|
| 29196 Crestone Dr Sun City, CA | 2.0 | 2.0 | 1393 | $1,995 | $1.43 | 19d | 1 | 0.53mi |
| 27218 Pennywhistle Way Menifee, CA | 3.0 | 2.0 | 2000 | $3,700 | $1.85 | 1d | 1 | 0.57mi |
| 27055 Fan Ln Menifee, CA | 2.0 | 2.0 | 1800 | $2,950 | $1.64 | 1d | 1 | 0.59mi |
| 28055 Grosse Point Dr Menifee, CA | 1.0 | 1.0 | 1767 | $1,495 | $0.85 | 1d | 1 | 0.61mi |
| 26460 Spaniel Ln Menifee, CA | 3.0 | 2.0 | 2000 | $2,995 | $1.50 | 1d | 1 | 0.72mi |
| 26156 Birkdale Rd Menifee, CA | 2.0 | 2.0 | 1285 | $2,000 | $1.56 | 1d | 1 | 0.79mi |
| 28375 Paseo Grande Dr Menifee, CA | 2.0 | 2.0 | 1285 | $2,395 | $1.86 | 1d | 1 | 0.80mi |
| 26838 Wildrose Ct Menifee, CA | 1.0 | 1.0 | 2500 | $750 | $0.30 | 24d | 1 | 0.87mi |
| 26805 China Dr Menifee, CA | 3.0 | 2.5 | 1773 | $3,000 | $1.69 | 24d | 1 | 0.88mi |
| 27709 Camino Donaire Menifee, CA | 3.0 | 2.0 | 1317 | $3,000 | $2.28 | 1d | 1 | 0.93mi |
| 26542 Sun City Blvd Menifee, CA | 2.0 | 2.0 | 1530 | $2,295 | $1.50 | 10d | 1 | 0.94mi |
| 25861 McCall Blvd Menifee, CA | 2.0 | 2.0 | 1378 | $2,350 | $1.71 | 1d | 1 | 0.95mi |
| 28033 Radford Dr Menifee, CA | 2.0 | 2.0 | 1520 | $2,400 | $1.58 | 10d | 1 | 1.05mi |
| 27305 Uppercrest Ct Menifee, CA | 3.0 | 2.0 | 1318 | $2,353 | $1.79 | 21d | 1 | 1.11mi |
| 26772 Maris Ct Menifee, CA | 3.0 | 2.0 | 1715 | $2,800 | $1.63 | 1d | 1 | 1.11mi |
| 25650 Hartwick Rd Menifee, CA | 3.0 | 2.0 | 1603 | $2,650 | $1.65 | 21d | 1 | 1.22mi |
| 25615 Union Hill Dr Menifee, CA | 3.0 | 2.0 | 1350 | $2,550 | $1.89 | 15d | 1 | 1.23mi |
| 27757 Aspel Rd Menifee, CA | 1.0–2.0 | 1.0–2.0 | 1026 | $2,869 | $2.80 | 1d | 15 | 1.32mi |
| 28880 Amersfoot Way Menifee, CA | 2.0 | 2.0 | 1386 | $2,400 | $1.73 | 1d | 1 | 1.34mi |
| 28461 Portsmouth Dr Menifee, CA | 3.0 | 2.0 | 1450 | $2,685 | $1.85 | 1d | 1 | 1.40mi |
| 25781 Interlechen Dr Menifee, CA | 3.0 | 2.0 | 1554 | $2,800 | $1.80 | 1d | 1 | 1.44mi |
| 27077 El Rancho Dr Menifee, CA | 3.0 | 2.0 | 1364 | $2,600 | $1.91 | 1d | 1 | 1.50mi |
Listing history 6 events
-
2026-06-18days on market $167,000 Coming Soon 7 DOM
-
2026-06-17days on market $167,000 Coming Soon 6 DOM
-
2026-06-16days on market $167,000 Coming Soon 5 DOM
-
2026-06-15days on market $167,000 Coming Soon 4 DOM
-
2026-06-13remarks 699-char remark
-
2026-06-13$167,000 Coming Soon 2 DOM
ⓘ Source: listings_history table (triggers on properties + properties_extension) + one-shot
backfill from property_details.listing_events for pre-trigger history.
Climate risk First Street
- Flood 1/10 Low FEMA zone X (unshaded) · 0% chance over 30 yrs
- Wildfire 7/10 Severe
- Heat 7/10 Severe 5 d/yr ≥105°F today · 14 d/yr by 30 yrs out
- Wind 1/10 Low
- Air quality 5/10 Major 9 unhealthy d/yr today · 11 by 30 yrs out
Nearby sold comps map
Loading sold comps map…
Walkable amenities ~0.75 mi
Loading nearby amenities…
Taxation est. · year 1
- Rental income
- $31,232
- − Mortgage interest
- −$9,355
- − Property taxes
- −$2,505
- − Insurance
- −$835
- − Repairs & maintenance
- −$2,499
- − Management
- −$2,499
- − Depreciation
- −$4,858
- Taxable income
- $8,682
- Est. tax owed @ 24.0%
- −$2,084
- After-tax cash flow
- $8,740/yr
For passive investors: Depreciation is non-cash, so a rental often shows a tax loss while cash-flowing — sheltering income. Rental losses are passive: they offset passive income freely, and up to $25,000/yr can offset ordinary (W-2) income if you actively participate and your MAGI is under $100k (phasing out to $0 by $150k); unused losses carry forward. On sale, claimed depreciation is recaptured at up to 25%, and gains may owe capital-gains tax (a 1031 exchange can defer both). Figures are a year-1 estimate at your 24.0% rate — not tax advice; consult a CPA.
Schools (NCES district)
- District
- Menifee Union Elementary
- NCES district ID
- 0624540
- Math proficiency
- 43% ▬ 0.00%
- Reading proficiency
- 56% ▲ 3.00%
- Median HH income
- $58,228
- Composite
- 45.17/100
- National rank
- #5790
- State rank
- #434 of 1400 in CA
Livability — Menifee
- Score
- 64/100
- State rank
- #407
- US rank
- #13882
Category grades
Schools grade is shown separately in the Schools card above.
Census & demographics
- Census place
- Menifee, CA
- County
- Riverside County · 2,287,001 people
- City population
- 111,667
- Metro
- Riverside-San Bernardino-Ontario, CA
- Population (ZIP)
- 20,767
- Household income
- $57,708
- Rent vs Own
- Severe rent burden
- 1163.0
Population outlook (Riverside County) Hauer SSP2
- Today (2025)
- 2,664,475 people
- By 2030
- 2,802,692 · +5.2%
- By 2040
- 3,050,904 · +14.5%
- By 2050
- 3,256,783 · +22.2%
- By 2075
- 3,655,058 · +37.2%
- By 2100
- 3,766,594 · +41.4%
Race, ethnicity, and origin ACS 2023
- Neighborhood character
- Diverse neighborhood (Simpson 0.59)
- Race & ethnicity
- White 55% Hispanic / Latino 31% Two or more races 17% Black 6% Asian 3%
- Hispanic origin (detail)
- Mexican 25% Puerto Rican 1%
- Common ancestry
- Lithuanian 3% Italian 2% Romanian 1%
- Foreign-born
- 15% · Canada, Vietnam, China
- Languages at home
- 77% English-only · Spanish 18% Other Asian/Pacific 1% Other Indo-European 1%
Political lean MEDSL · Riverside
- 2024 margin
- Toss-up / Even · D 48.0% · R 49.3% · Other 2.6%
- 2008→2024 swing
- -3.6pp toward R · 2008: 2.3pp · 2024: -1.3pp
- All cycles
- 2024: R+1.3 2020: D+8.0 2016: D+4.3 2012: R+0.4 2008: D+2.3
Not yet ingested
- Civics
- —
Market trends
- HPI YoY
- ▼ -86.18%
- Current HPI
- 364.9577
- Rent YoY
- ▲ 6.10%
- Metro
- Riverside-San Bernardino-Ontario, CA
- State GDP YoY
- ▲ 3.21%
- F500 in state
- 116
Industry mix (Fortune 500 HQ in CA)
| Industry | F500 HQs | Revenue |
|---|---|---|
| Technology | 27 | $1,492B |
|
||
| Financial Services | 3 | $174B |
|
||
| Retail | 3 | $44B |
|
||
| Insurance | 3 | $26B |
|
||
| Media / Entertainment | 2 | $115B |
|
||
| Pharmaceuticals / Biotech | 2 | $62B |
|
||
Price history
+142.4% since first listed35 events — show timeline
- 2026-06-12 Coming Soon $167,000 CRMLS
- 2024-01-25 Sold (MLS) $145,000 CRMLS
- 2024-01-11 Pending — CRMLS
- 2023-11-28 Listed $149,900 CRMLS
- 2023-11-17 Coming Soon $149,900 CRMLS
- 2018-09-28 Sold (MLS) $75,000 CRMLS
- 2018-09-09 Pending — CRMLS
- 2018-08-30 Contingent — CRMLS
- 2018-07-23 Price Changed $77,500 CRMLS
- 2018-07-10 Relisted — CRMLS
- 2018-07-04 Contingent — CRMLS
- 2018-07-02 Relisted — CRMLS
- 2018-06-29 Pending — CRMLS
- 2018-06-25 Contingent — CRMLS
- 2018-06-19 Listed $79,000 CRMLS
- 2017-10-24 Pending — CRMLS
- 2017-10-24 Sold (MLS) $72,500 CRMLS
- 2017-10-12 Contingent — CRMLS
- 2017-08-15 Price Changed $72,500 CRMLS
- 2017-07-06 Relisted — CRMLS
- 2017-07-03 Contingent — CRMLS
- 2017-06-06 Listed $75,000 CRMLS
- 2017-06-05 Listing Removed — CRMLS
- 2017-05-19 Price Changed $75,000 CRMLS
- 2017-04-08 Relisted — CRMLS
- 2017-04-04 Contingent — CRMLS
- 2017-03-07 Relisted — CRMLS
- 2017-02-25 Relisted — CRMLS
- 2017-02-25 Delisted — CRMLS
- 2016-11-05 Relisted — CRMLS
- 2016-11-05 Delisted — CRMLS
- 2016-10-08 Delisted — CRMLS
- 2016-09-10 Listed $80,000 CRMLS
- 2004-10-19 Listing Removed — CRMLS
- 2004-08-18 Listed $68,900 CRMLS
Cash-flow waterfall
monthlySold comps — $/sqft
last 12 mo · ≤1 miLoading sold comps…