241 N Checola Cir · Boise City, ID
Flood risk No data
- FEMA flood zone
- —
- Chance of flooding over 30 yrs
- —
- Est. flood insurance / yr
- —
Fire risk No data
- Est. fire insurance / yr
- —
Heat risk No data
- Hot days now (above threshold)
- —
- Hot days in 30 yrs
- —
Wind risk No data
- Chance of severe wind over 30 yrs
- —
Air-quality risk No data
- Unhealthy air days now
- —
- Unhealthy air days in 30 yrs
- —
Risk factors via First Street. Map © Google.
Why this score? — see what drove the C+ grade
The composite is a weighted blend of 9 inputs, each scored 0–100. Each bar is that input's sub-score; the figure is the points it added to the 100-point composite (weight × sub-score).
- Cash flow +30.0/30.0
- 1% rule +10.0/10.0
- DSCR +10.0/10.0
- Schools +5.2/10.0
- Rent growth +3.5/5.0
- Livability +2.5/5.0
- Condition / age +2.5/5.0
- ARV discount +0.0/15.0
- Appreciation +0.0/10.0
$99,000
🖨 Deal sheet 📄 Offer letter ✓ Due diligence
Listing remarks
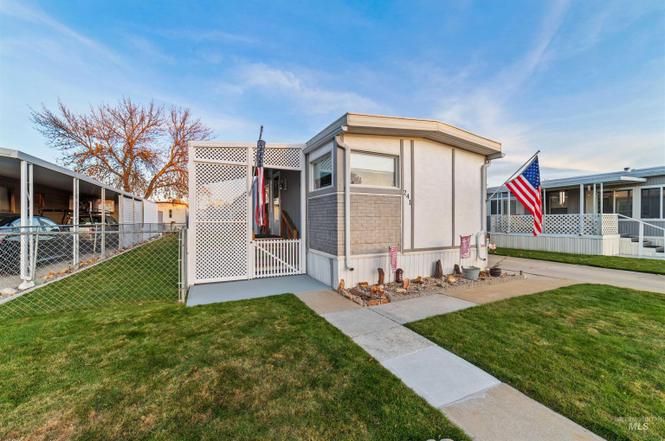
Welcome to this charming manufactured home, nestled in the highly desirable 55+ gated community of West Meadows Estates. From the moment you step inside, you’ll notice the thoughtful layout, abundant natural light, and meticulous care throughout. The open-concept design offers plenty of storage and upscale finishes. Upgrades include modern fixtures, a new walk-in shower with power grout, a resealed roof, new flooring, and fresh paint. Each bedroom is generously sized, featuring spacious closets, ceiling fans, and ample storage. Outside, enjoy serene surroundings, a fenced yard, and undeniable curb appeal, perfect for relaxing. Conveniently located near shopping, dining, and entertainm
Key facts
- Gated community
- Open-concept design
- Fenced yard
Tags
Neighborhood map
What this means for you Summary
Snapshot
- This is a 2-bed/2.0-bath manufactured listed at $99k.
Deal economics
- At list price, monthly cash flow is $545 ($7k/yr) — positive.
- The deal already cash-flows at list — no discount required.
- Meets the 1% rule at list price ($2k rent vs $99k).
- Recommended offer: $87k (12.0% below list) — sets the bar for market timing.
- Cap rate 12.9% vs local median 2.6% in Boise City — top-decile yield for the area; either an underpriced asset or a hidden risk that comps aren't pricing in. Stress-test before assuming the spread holds.
Location & tenants
- Location reads: area grade C — affects rentability + tenant quality, not the cash-flow math above.
- Joint School District No. 2 (suburban): math 53% / reading 67% proficiency, ranked #11 of 92 in ID (top 12%) — acceptable for families but not a draw, mixed tenant base, ~2y average lease.
- Zoned schools: Ustick Elementary School (math 32% / reading 37%, grade F, #272 of 357 statewide, top 80%, 357 students, 60% FRL); Centennial High School (math 53% / reading 76%, grade B-, #10 of 169 statewide, top 7%, 1,931 students, 22% FRL) — zoned schools average 41% FRL vs 23% district-wide (18 pts higher); higher-poverty schools than district average — tighter screening recommended.
- Market conditions: Rents rising fast (+4.0%/yr); 135 active listings in the ZIP; 13 comparable units currently listed for rent nearby; rentals at typical pace (median 15d on market — plan ~3-4 weeks tenant-placement turnaround); solid renter incomes; 5,129 units permitted in Ada County in 2024 (414 in 5+ unit buildings).
Forward outlook
- Local home prices are declining (-3.0%/yr); year-one equity from $684 of loan paydown is wiped out by about $3k of value loss. Plan a longer hold.
- Ada County population projected at +45% by 2050 — long-run rental-demand tailwind backs the buy-and-hold thesis.
- At projected returns (-3.0% appreciation + 4.0% rent growth), your $28k cash investment doubles in ~5 years — after that, you're playing with house money.
Negotiation context
- It's been on market 139 days — a 12% lower offer ($87k) is reasonable based on typical stale-listing flexibility.
Questions for the listing agent
- It's been on market 139 days. Have you received any prior offers? Is the seller open to a 12% concession, seller financing, or rate buy-down credit?
- Built in 1977 — when were the roof, HVAC, electrical panel, plumbing, and water heater last replaced?
- Why hasn't it sold? Are there any deal-killer items the seller is aware of (foundation, flood, title, zoning, code violations)?
- Is there a deadline driving the sale (1031 exchange, divorce, estate, relocation)? That informs how much negotiation room exists.
- What's the average days-on-market for RENTAL listings here right now (not sales)? A rising rental-DOM trend means longer vacancies and softer asking-rent achievability than the comps imply.
- What's the recent tenant-quality profile in this submarket — average credit score on applications, eviction rate, late-payment / NSF rate, and stable-employment percentage? A property-management company in the area should have these aggregated.
- How much new for-sale + rental construction is in the pipeline within 1–3 miles? Heavy new supply typically softens prices + rents 12–24 months out; constrained supply supports both.
Investment metrics
- 1% rule
- 1.57% ✓
- Cap rate
- 12.90%
- Cash-on-cash
- 23.58%
- DSCR
- 2.05
- GRM
- 5.3
CMA / ARV
- ARV (on-the-fly)
- $72,226
- Comps found
- 12
Show comp detail 12 sales within ~0.75 mi
| Address | Dist | Beds/Ba | Sqft | Sold | Price | $/sf | Match |
|---|---|---|---|---|---|---|---|
| 540 Meadowland Cir | 0.22mi | 2/2.0 | 924 (-2%) | 1mo | $46,500 | $50 | 87 |
| 376 Bonanza St | 0.05mi | 3/1.5 (+1) | 935 (-0%) | 6mo | $49,900 | $53 | 85 |
| 558 Silver City Dr | 0.25mi | 2/2.0 | 924 (-2%) | 2mo | $39,900 | $43 | 84 |
| 425 Mesquite | 0.19mi | 3/2.0 (+1) | 924 (-2%) | 0mo | $54,990 | $60 | 83 |
| 145 N Rainbow Dr | 0.10mi | 2/1.0 | 968 (+3%) | 5mo | $78,500 | $81 | 82 |
| 424 W Mesquite | 0.18mi | 3/1.5 (+1) | 924 (-2%) | 7mo | $78,000 | $84 | 76 |
| 618 Empress St | 0.31mi | 2/2.0 | 975 (+4%) | 4mo | $74,700 | $77 | 76 |
| 358 Bonanza Dr | 0.08mi | 2/1.0 | 840 (-10%) | 2mo | $80,000 | $95 | 74 |
| 329 Oak Cir | 0.06mi | 2/1.0 | 1,022 (+9%) | 8mo | $76,900 | $75 | 71 |
| 505 Greenleaf | 0.31mi | 3/2.0 (+1) | 980 (+4%) | 6mo | $85,000 | $87 | 68 |
| 315 Driftwood Rd | 0.14mi | 2/2.0 | 1,056 (+13%) | 7mo | $115,000 | $109 | 67 |
| 10369 W Florence Ln | 0.26mi | 3/2.0 (+1) | 1,064 (+13%) | 3mo | $75,000 | $70 | 58 |
Match score weights: distance 35% · size 25% · config 20% · recency 20%. Top-matched comps best support the ARV.
Projected returns pro-forma
-3.0% appreciation · 4.01% rent growth · sell at horizon
- IRR
- 17.8%
- Equity multiple
- 1.73×
- Total profit
- $20,270
- Equity at exit
- $14,761
- IRR
- 27.0%
- Equity multiple
- 3.49×
- Total profit
- $69,105
- Equity at exit
- $8,560
Cash invested: $27,720 (down + closing). Projections, not guarantees.
Landlord ↔ Tenant lean methodology
- Overall (STATE)
- 91 Strongly Landlord-Friendly
- State Idaho
- 91 Strongly Landlord-Friendly · R+18
- County
- — inherits STATE
- City
- — inherits STATE
ZIP-level market 83713
- Home prices YoY
- -26.5%
- Rents YoY
- 4.0%
- Active inventory
- 135
- Price-to-rent
- 5.3×
Monthly cashflow live
- Estimated rent
- $1,556 high interval (Pro) →
- Mortgage (P&I)
- −$519
- Tax est. 1.5%
- −$124 /mo · $1,485/yr
- Insurance
- −$41
- HOA
- −$0
- Vacancy / Maint / Mgmt
- −$327
- Net cashflow
- $545
Break-even live
UW: 25.0% down · 7.5% · 30yr · 1.5% tax · 5.0% vac · 8.0% maint · 8.0% mgmt
Financing live
Cash to close
- Down payment
- $24,750
- Closing costs
- $2,970
- Reserves months
- —
- Total cash needed
- —
Loan-product check · same deal, 3 products live
Conventional
25% down · 7.5% · 30yr
- Down + closing
- —
- Monthly P&I
- —
- Monthly cashflow
- —
- DSCR
- —
- Eligible?
- —
Personal DTI + credit; lowest rate.
DSCR
20% down · 8.5% · 30yr
- Down + closing
- —
- Monthly P&I
- —
- Monthly cashflow
- —
- DSCR
- —
- Eligible?
- —
No personal income docs; deal must DSCR.
Hard money
10% down · 12.0% · 12mo
- Down + closing
- —
- Monthly P&I
- —
- Monthly cashflow
- —
- DSCR
- —
- Eligible?
- —
Short-term bridge; refi at stabilization.
Rent comps 13 comps
| Address | Beds | Baths | Sqft | Rent | $/sqft | DOM | Units | Dist |
|---|---|---|---|---|---|---|---|---|
| 10077 W Rifleman Ln Unit 103 Boise, ID | 2.0 | 2.0 | 860 | $1,395 | $1.62 | 12d | 1 | 0.49mi |
| 11383 W Fairview Ave Boise, ID | 2.0 | 2.0 | 1123 | $1,575 | $1.40 | 3d | 4 | 0.51mi |
| 10105 W Garverdale Ln Ste 201 Boise, ID | 2.0 | 2.0 | 915 | $1,350 | $1.48 | 14d | 1 | 0.63mi |
| 10096 W Garverdale Ln Boise, ID | 3.0 | 2.0 | 1113 | $1,600 | $1.44 | 23d | 1 | 0.68mi |
| 9130 W Irving St Boise, ID | 2.0 | 1.5 | 952 | $1,575 | $1.65 | 3d | 5 | 1.06mi |
| 930 N Maple Grove Rd Boise, ID | 1.0–3.0 | 1.0–2.0 | 950 | $1,920 | $2.02 | 3d | 14 | 1.23mi |
| 10887 W Ustick Rd Boise, ID | 2.0–3.0 | 1.0–2.0 | 874 | $1,345 | $1.54 | 3d | 3 | 1.33mi |
| 10811 W Ustick Rd Boise, ID | 2.0 | 1.0 | 794 | $1,345 | $1.69 | 21d | 1 | 1.35mi |
| 9169 W Cory Ln #202 Boise, ID | 2.0 | 1.5 | 968 | $1,395 | $1.44 | 21d | 1 | 1.37mi |
| 10222 W Ustick Rd Boise, ID | 2.0 | 2.0 | 1010 | $1,575 | $1.56 | 23d | 1 | 1.43mi |
| 2555 N Workland Ln Unit 202 Boise, ID | 2.0 | 1.0 | 800 | $1,325 | $1.66 | 14d | 1 | 1.45mi |
| 9056 W Sigmont Ln Unit 201 Boise, ID | 2.0 | 2.0 | 900 | $1,300 | $1.44 | 14d | 1 | 1.48mi |
| 8443 W Rifleman St Unit 8443 Boise, ID | 2.0 | 1.0 | 846 | $1,900 | $2.25 | 3d | 1 | 1.49mi |
Listing history 2 events
-
2026-04-02status Pending
-
2025-11-14$99,000 Active
ⓘ Source: listings_history table (triggers on properties + properties_extension) + one-shot
backfill from property_details.listing_events for pre-trigger history.
Nearby sold comps map
Loading sold comps map…
Walkable amenities ~0.75 mi
Loading nearby amenities…
Taxation est. · year 1
- Rental income
- $18,666
- − Mortgage interest
- −$5,546
- − Property taxes
- −$1,485
- − Insurance
- −$495
- − Repairs & maintenance
- −$1,493
- − Management
- −$1,493
- − Depreciation
- −$2,880
- Taxable income
- $5,274
- Est. tax owed @ 24.0%
- −$1,266
- After-tax cash flow
- $5,271/yr
For passive investors: Depreciation is non-cash, so a rental often shows a tax loss while cash-flowing — sheltering income. Rental losses are passive: they offset passive income freely, and up to $25,000/yr can offset ordinary (W-2) income if you actively participate and your MAGI is under $100k (phasing out to $0 by $150k); unused losses carry forward. On sale, claimed depreciation is recaptured at up to 25%, and gains may owe capital-gains tax (a 1031 exchange can defer both). Figures are a year-1 estimate at your 24.0% rate — not tax advice; consult a CPA.
Schools (NCES district)
- District
- Joint School District No. 2
- NCES district ID
- 1602100
- Math proficiency
- 53% ▼ -6.00%
- Reading proficiency
- 67% ▼ -1.00%
- Median HH income
- $64,573
- Composite
- 52.42/100
- National rank
- #1576
- State rank
- #11 of 92 in ID
Livability — Boise City
No livability data for this city. (Only ~50 U.S. cities are tracked.)
Census & demographics
- Census place
- Boise City, ID
- County
- Ada County · 522,161 people
- City population
- 152,689
- Metro
- Boise City, ID
- Population (ZIP)
- 31,549
- Household income
- $91,295
- Rent vs Own
- Severe rent burden
- 805.0
Population outlook (Ada County) Hauer SSP2
- Today (2025)
- 535,818 people
- By 2030
- 585,751 · +9.3%
- By 2040
- 682,435 · +27.4%
- By 2050
- 775,818 · +44.8%
- By 2075
- 994,458 · +85.6%
- By 2100
- 1,148,884 · +114.4%
Race, ethnicity, and origin ACS 2023
- Neighborhood character
- Predominantly White (79%)
- Race & ethnicity
- White 79% Two or more races 10% Hispanic / Latino 10% Asian 3% Black 1%
- Hispanic origin (detail)
- Mexican 8%
- Common ancestry
- Portuguese 4% Slovak 2% Lithuanian 2%
- Foreign-born
- 9% · Canada, Jamaica, China
- Languages at home
- 87% English-only · Spanish 7% Other Indo-European 2% German/W. Germanic 1%
Political lean MEDSL · Ada
- 2024 margin
- R (+10.3) · D 43.4% · R 53.8% · Other 2.8%
- 2008→2024 swing
- -4.2pp toward R · 2008: -6.2pp · 2024: -10.3pp
- All cycles
- 2024: R+10.3 2020: R+3.9 2016: R+9.2 2012: R+11.3 2008: R+6.2
Not yet ingested
- Civics
- —
Market trends
- HPI YoY
- ▼ -122.31%
- Current HPI
- 338.9271
- Rent YoY
- ▲ 4.01%
- Metro
- Boise City, ID
- State GDP YoY
- ▲ 4.51%
- F500 in state
- 6
Industry mix (Fortune 500 HQ in ID)
| Industry | F500 HQs | Revenue |
|---|---|---|
| Retail | 1 | $79B |
|
||
| Technology | 1 | $25B |
|
||
| Food / Agriculture | 1 | $6B |
|
||
Price history
2 events — show timeline
- 2026-04-02 Pending — IMLS
- 2025-11-14 Listed $99,000 IMLS
Cash-flow waterfall
monthlySold comps — $/sqft
last 12 mo · ≤1 miLoading sold comps…