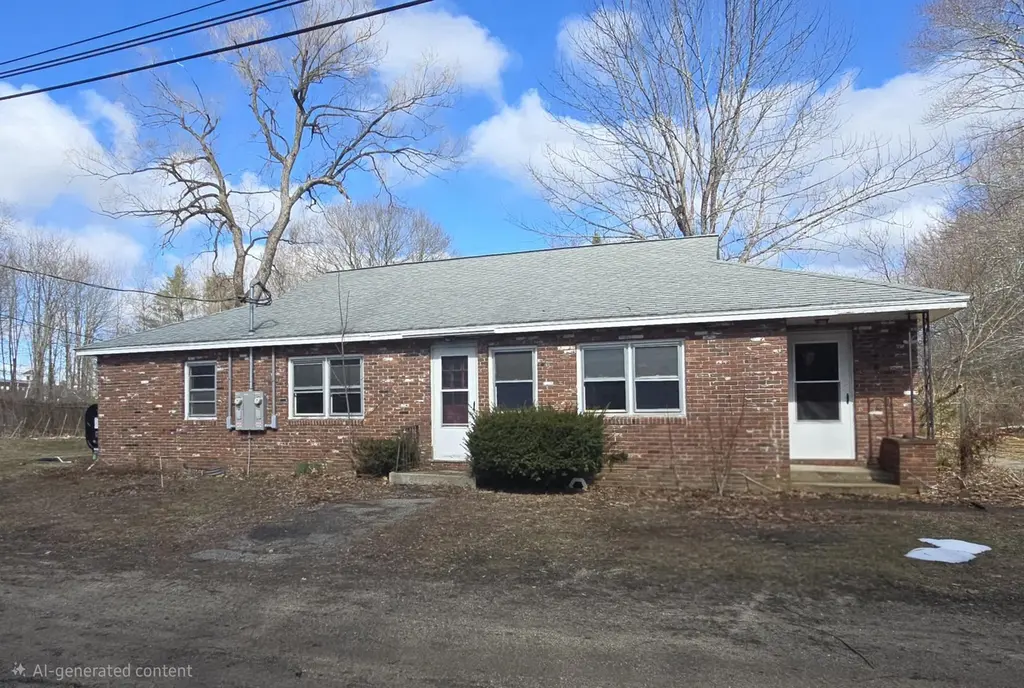
 Duplex
773 Salmon Falls Rd · Rochester, NH
Flood risk 1/10 · Minimal
- FEMA flood zone
- X (unshaded)
- Chance of flooding over 30 yrs
- 0.0%
- Est. flood insurance / yr
- $507 – $1,088
Fire risk 1/10 · Minimal
- Est. fire insurance / yr
- $507 – $941
Heat risk 3/10 · Minor
- Hot days now (above 97°F)
- 7 days/yr
- Hot days in 30 yrs
- 15 days/yr
Wind risk 4/10 · Minor
- Chance of severe wind over 30 yrs
- 17.0%
Air-quality risk 2/10 · Minimal
- Unhealthy air days now
- 1 days/yr
- Unhealthy air days in 30 yrs
- 1 days/yr
Risk factors via First Street. Map © Google.
Why this score? — see what drove the C+ grade
The composite is a weighted blend of 9 inputs, each scored 0–100. Each bar is that input's sub-score; the figure is the points it added to the 100-point composite (weight × sub-score).
- Cash flow +30.0/30.0
- DSCR +10.0/10.0
- 1% rule +9.1/10.0
- Livability +4.2/5.0
- ARV discount +3.2/15.0
- Schools +2.7/10.0
- Rent growth +2.5/5.0
- Condition / age +2.5/5.0
- Appreciation +0.0/10.0
$295,000
🖨 Deal sheet 📄 Offer letter ✓ Due diligence
Multi-family units
County records classify this as Multi-Family (2-4 Unit). Listing-text estimate: 2 units. confirmed
Listing remarks
Investor Special!!! 2-unit ranch on 1.5 acres in a desirable rural location just minutes to town, schools, and amenities. Each unit includes 2 bedrooms and 1 full bath, all on one level. Property has substantial structural issues and requires major repairs. This is a full rehab or tear-down project. Will not qualify for conventional financing—cash or rehab loans only. Options include renovating for rental income, occupying one unit while rehabbing the other, or removing the structure and replacing with a mobile modular or stick built home. Property is serviced by town water and has a good septic system. Large 30x40 detached garage (built in 2018) offers excellent storage or workshop
Key facts
- Expansive backyard
- Ranch-style property
- 1.5-acre lot
Tags
Property features AI
Finance
- Financial info: Two-unit multifamily property (both units 2-bedroom, 1-bath); Total finished living area approximately 1,737
Exterior
- Parking: 4-car garage
- Utilities: Public water; Private sewer; Electric service with circuit breakers; Cable available; High-speed internet available
- Home design: Ranch-style building; Existing structure built in 1964
- Construction: Wood frame construction; Shingle roof; Crawl space foundation
- Exterior features: Open, rolling, rural lot; Public road frontage (approximately 150 feet); Gravel driveway
Interior
- Kitchen: Each unit includes an electric range and refrigerator
- Bedrooms: Each unit has 2 bedrooms (Unit 1 on level 1; Unit 2 level not specified)
- Bathrooms: Each unit has 1 full bathroom (total of 2 full bathrooms)
- Heating & cooling: Heating: kerosene (heat included in units); No central cooling
- Interior features: Two-unit layout with similar unit configurations; Walk-up basement with crawl space; Heat included in units
- Laundry & utility: Each unit has laundry hookup
Neighborhood map
What this means for you Summary
Snapshot
- This is a 2 × 2-bed/1.0-bath units multifamily listed at $295k.
Deal economics
- At list price, monthly cash flow is $1k ($13k/yr) — positive. Per door: $549/mo.
- The deal already cash-flows at list — no discount required.
- Meets the 1% rule at list price ($4k rent vs $295k).
- Recommended offer: $291k (1.5% below list) — sets the bar for market timing.
- Cap rate 10.8% vs local median 3.6% in Rochester — top-decile yield for the area; either an underpriced asset or a hidden risk that comps aren't pricing in. Stress-test before assuming the spread holds.
Location & tenants
- Location reads 84/100 on livability (#8 in NH, #698 nationally) — a professional / high-income tenant draw. Strengths: crime A+, commute A+, cost of living A+; Watch: amenities C-.
- Rochester School District (suburban): math 27% / reading 35% proficiency, ranked #83 of 98 in NH (top 85%) — families likely to look elsewhere, expect single-tenant / working-renter base with shorter leases.
- Zoned schools: East Rochester School (math 37% / reading 42%, grade F, #164 of 263 statewide, top 64%, 293 students, 38% FRL) — zoned schools at 38% FRL track the district average.
- Market conditions: 35 active listings in the ZIP; 1 comparable units currently listed for rent nearby; 951 units permitted in Strafford County in 2024 (551 in 5+ unit buildings).
Forward outlook
- Local home prices are declining (-3.0%/yr); year-one equity from $2k of loan paydown is wiped out by about $9k of value loss. Plan a longer hold.
- Strafford County population projected at +7% by 2050 — modest demand growth; plan on rents tracking national, not racing it.
- At projected returns (-3.0% appreciation + 3.0% rent growth), your $83k cash investment doubles in ~8 years — after that, you're playing with house money.
Negotiation context
- It's been on market 29 days — a 2% lower offer ($291k) is reasonable based on typical stale-listing flexibility.
- 2 sale attempts; this cycle's ask has dropped $105k (26%) from the opening price — seller is motivated, your offer sets the floor, not the list.
Questions for the listing agent
- Can we see the unit-by-unit rent roll, current vacancy, and any below-market leases? What's the average tenancy length?
- What capital expenditures (roof, boiler, parking lot, exteriors) have been made in the last 5 years, and what's planned in the next 2?
- Built in 1964 — when were the roof, HVAC, electrical panel, plumbing, and water heater last replaced?
- Is there a deadline driving the sale (1031 exchange, divorce, estate, relocation)? That informs how much negotiation room exists.
- What's the average days-on-market for RENTAL listings here right now (not sales)? A rising rental-DOM trend means longer vacancies and softer asking-rent achievability than the comps imply.
- What's the recent tenant-quality profile in this submarket — average credit score on applications, eviction rate, late-payment / NSF rate, and stable-employment percentage? A property-management company in the area should have these aggregated.
- How much new apartment / multifamily construction is in the pipeline within 1–3 miles? Heavy new supply (>2% of stock underway) typically softens rents 12–24 months out; light construction supports rent growth.
Investment metrics
- 1% rule
- 1.41% ✓
- Cap rate
- 10.76%
- Cash-on-cash
- 15.96%
- DSCR
- 1.71
- GRM
- 5.9
CMA / ARV
- ARV (on-the-fly)
- $269,235
- Comps found
- 1
Show comp detail 1 sale within ~0.75 mi
| Address | Dist | Beds/Ba | Sqft | Sold | Price | $/sf | Match |
|---|---|---|---|---|---|---|---|
| 773 Salmon Falls Rd | 0.00mi | 4/2.0 | 1,737 (0%) | 1mo | $270,000 | $155 | 99 |
Match score weights: distance 35% · size 25% · config 20% · recency 20%. Top-matched comps best support the ARV.
Projected returns pro-forma
-3.0% appreciation · 3.0% rent growth · sell at horizon
- IRR
- 6.9%
- Equity multiple
- 1.27×
- Total profit
- $22,342
- Equity at exit
- $43,985
- IRR
- 16.3%
- Equity multiple
- 2.33×
- Total profit
- $110,211
- Equity at exit
- $25,506
Cash invested: $82,600 (down + closing). Projections, not guarantees.
Landlord ↔ Tenant lean methodology
- Overall (STATE)
- 56 Moderately Landlord-Leaning
- State New Hampshire
- 56 Moderately Landlord-Leaning · D+1
- County
- — inherits STATE
- City
- — inherits STATE
ZIP-level market 03868
- Home prices YoY
- -6.6%
- Active inventory
- 35
- Price-to-rent
- 11.8×
Monthly cashflow live
- Estimated rent
- $4,164 medium interval (Pro) →
- Mortgage (P&I)
- −$1,547
- Tax from tax record
- −$521 /mo · $6,249/yr
- Insurance
- −$123
- HOA
- −$0
- Vacancy / Maint / Mgmt
- −$874
- Net cashflow
- $1,099
Break-even live
2-unit breakdown (identical units grouped — click to expand)
| Units | Beds | Baths | Est. rent |
|---|---|---|---|
| 2× units | 2 | 1 | $4,164 |
| #1 | 2 | 1 | $2,082 |
| #2 | 2 | 1 | $2,082 |
| Total (2 units) | $4,164 | ||
UW: 25.0% down · 7.5% · 30yr · 1.5% tax · 5.0% vac · 8.0% maint · 8.0% mgmt
Financing live
Cash to close
- Down payment
- $73,750
- Closing costs
- $8,850
- Reserves months
- —
- Total cash needed
- —
Loan-product check · same deal, 3 products live
Conventional
25% down · 7.5% · 30yr
- Down + closing
- —
- Monthly P&I
- —
- Monthly cashflow
- —
- DSCR
- —
- Eligible?
- —
Personal DTI + credit; lowest rate.
DSCR
20% down · 8.5% · 30yr
- Down + closing
- —
- Monthly P&I
- —
- Monthly cashflow
- —
- DSCR
- —
- Eligible?
- —
No personal income docs; deal must DSCR.
Hard money
10% down · 12.0% · 12mo
- Down + closing
- —
- Monthly P&I
- —
- Monthly cashflow
- —
- DSCR
- —
- Eligible?
- —
Short-term bridge; refi at stabilization.
Rent comps 1 comps
| Address | Beds | Baths | Sqft | Rent | $/sqft | DOM | Units | Dist |
|---|---|---|---|---|---|---|---|---|
| 2 Townsend Ln Rochester, NH | 3.0 | 2.5 | 1600 | $2,350 | $1.47 | 2d | 1 | 1.27mi |
Listing history 5 events
-
2026-04-24status Pending
-
2026-04-20price $295,000
-
2026-04-20status Active
-
2026-04-02historical Active with Contract
-
2026-03-25$399,900 Active
ⓘ Source: listings_history table (triggers on properties + properties_extension) + one-shot
backfill from property_details.listing_events for pre-trigger history.
Tax reassessment forecast NH · Partial reset (capped growth)
- Current annual tax
- $6,249 · $521/mo
- Projected year-2 tax
- $6,340 · $528/mo
- Expected delta
- +$91/yr (+$8/mo · 1.5%)
ⓘ Screening estimate from a state-policy table — verify with the county assessor before closing.
Climate risk First Street
- Flood 1/10 Low FEMA zone X (unshaded) · 0% chance over 30 yrs
- Wildfire 1/10 Low
- Heat 3/10 Moderate 7 d/yr ≥97°F today · 15 d/yr by 30 yrs out
- Wind 4/10 Moderate 17% chance of damaging wind over 30 yrs
- Air quality 2/10 Low 1 unhealthy d/yr today · 1 by 30 yrs out
Nearby sold comps map
Loading sold comps map…
Walkable amenities ~0.75 mi
Loading nearby amenities…
Taxation est. · year 1
- Rental income
- $49,968
- − Mortgage interest
- −$16,525
- − Property taxes
- −$6,249
- − Insurance
- −$1,475
- − Repairs & maintenance
- −$3,997
- − Management
- −$3,997
- − Depreciation
- −$8,582
- Taxable income
- $9,143
- Est. tax owed @ 24.0%
- −$2,194
- After-tax cash flow
- $10,992/yr
For passive investors: Depreciation is non-cash, so a rental often shows a tax loss while cash-flowing — sheltering income. Rental losses are passive: they offset passive income freely, and up to $25,000/yr can offset ordinary (W-2) income if you actively participate and your MAGI is under $100k (phasing out to $0 by $150k); unused losses carry forward. On sale, claimed depreciation is recaptured at up to 25%, and gains may owe capital-gains tax (a 1031 exchange can defer both). Figures are a year-1 estimate at your 24.0% rate — not tax advice; consult a CPA.
Schools (NCES district)
- District
- Rochester School District
- NCES district ID
- 3305940
- Math proficiency
- 27% ▼ -15.00%
- Reading proficiency
- 35% ▼ -14.00%
- Median HH income
- $51,080
- Composite
- 27.11/100
- National rank
- #7039
- State rank
- #83 of 98 in NH
Livability — Rochester
- Score
- 84/100
- State rank
- #8
- US rank
- #698
Category grades
Schools grade is shown separately in the Schools card above.
Census & demographics
- Census place
- Rochester, NH
- City population
- 22,732
- Population (ZIP)
- 5,830
Population outlook (Strafford County) Hauer SSP2
- Today (2025)
- 132,503 people
- By 2030
- 135,377 · +2.2%
- By 2040
- 139,609 · +5.4%
- By 2050
- 141,803 · +7.0%
- By 2075
- 149,280 · +12.7%
- By 2100
- 148,667 · +12.2%
Race, ethnicity, and origin ACS 2023
- Neighborhood character
- Predominantly White (91%)
- Race & ethnicity
- White 91% Two or more races 4% Asian 4% Black 1%
- Common ancestry
- Lithuanian 10% Serbian 3% Portuguese 2%
- Foreign-born
- 4% · Canada, Jamaica
- Languages at home
- 94% English-only · Other Asian/Pacific 2% Other Indo-European 2% Spanish 1%
Political lean MEDSL · Strafford
- 2024 margin
- D (+12.1) · D 55.5% · R 43.5% · Other 1.0%
- 2008→2024 swing
- -8.3pp toward R · 2008: 20.4pp · 2024: 12.1pp
- All cycles
- 2024: D+12.1 2020: D+15.2 2016: D+8.6 2012: D+14.5 2008: D+20.4
Not yet ingested
- Civics
- —
Market trends
- HPI YoY
- ▼ -29.24%
- Current HPI
- 411.2075
- Rent YoY
- —
- Metro
- —
- State GDP YoY
- —
- F500 in state
- 0
Price history
-26.2% since first listed5 events — show timeline
- 2026-04-24 Pending — PrimeMLS
- 2026-04-20 Price Changed $295,000 PrimeMLS
- 2026-04-20 Relisted — PrimeMLS
- 2026-04-02 Contingent — PrimeMLS
- 2026-03-25 Listed $399,900 PrimeMLS
Property tax history
+3.6%/yrLatest (2025): $6,249 · +3.0% YoY. Source: county tax records.
Cash-flow waterfall
monthlySold comps — $/sqft
last 12 mo · ≤1 miLoading sold comps…