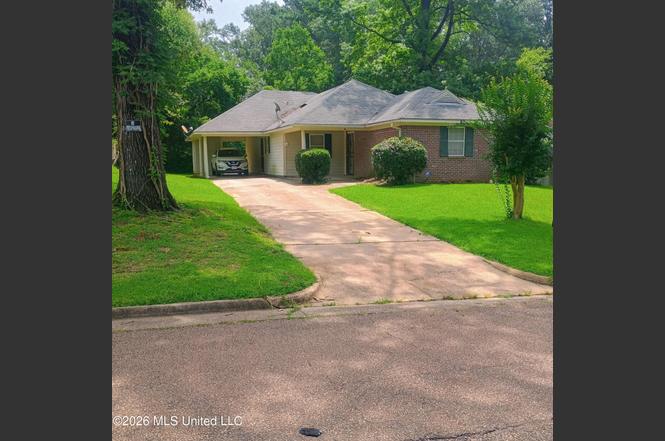
1954 Elaine St · Jackson, MS
Flood risk 1/10 · Minimal
- FEMA flood zone
- X (unshaded)
- Chance of flooding over 30 yrs
- 0.0%
- Est. flood insurance / yr
- $507 – $1,088
Fire risk 1/10 · Minimal
- Est. fire insurance / yr
- $1,241 – $2,305
Heat risk 7/10 · Major
- Hot days now (above 108°F)
- 7 days/yr
- Hot days in 30 yrs
- 18 days/yr
Wind risk 8/10 · Major
- Chance of severe wind over 30 yrs
- 80.0%
Air-quality risk 1/10 · Minimal
- Unhealthy air days now
- 0 days/yr
- Unhealthy air days in 30 yrs
- 0 days/yr
Risk factors via First Street. Map © Google.
Why this score? — see what drove the C- grade
The composite is a weighted blend of 9 inputs, each scored 0–100. Each bar is that input's sub-score; the figure is the points it added to the 100-point composite (weight × sub-score).
- Cash flow +15.1/30.0
- Appreciation +10.0/10.0
- ARV discount +7.5/15.0
- Rent growth +5.0/5.0
- 1% rule +4.6/10.0
- DSCR +4.6/10.0
- Livability +3.4/5.0
- Condition / age +2.5/5.0
- Schools +1.1/10.0
$127,500
🖨 Deal sheet (PDF) 📄 Offer letter ✓ Due diligence
Listing remarks MLS
All brick 3br/2ba that is in move in condition! Fresh interior paint, NEW flooring and NEW carpet in the bedrooms. NEW Stove. NEW HVAC to be installed prior to closing. Bedrooms have good closet space. Come see this wonderful home!
Key facts
- 7,840 sq ft lot
- Garage
- Built 2000
Property features AI
Finance
- Other: Living area source: appraiser; Lot size approximately 0.18 acres
- Financial info: Financial details not provided
- HOA & community: No HOA information provided
Exterior
- Parking: Attached garage; 1 carport space; Storage; Concrete parking surfaces; 1 total parking space
- Security: No specific security features listed
- Utilities: Public water; Public sewer; Electricity connected; Natural gas connected; Sewer connected; Water connected
- Home design: Single-family house; One level; Move-in ready
- Construction: Brick and siding exterior; Shingle roof; Slab foundation; Built year source: appraiser
- Exterior features: Front porch; Wood fencing; City lot
Interior
- Kitchen: Refrigerator; See remarks
- Bedrooms: Bedrooms information not provided
- Flooring: Carpet; Laminate
- Bathrooms: 2 full bathrooms
- Heating & cooling: Central heating; Central air; Ceiling fans for cooling
- Interior features: Ceiling fans; Rain gutters
- Laundry & utility: Washer hookup; Electric dryer hookup
Neighborhood map
What this means for you Summary
Snapshot
- This is a 3-bed/2.0-bath single-family listed at $128k.
Deal economics
- At list price, monthly cash flow is $42 ($503/yr) — positive.
- The deal already cash-flows at list — no discount required.
- To meet the 1% rule (rent ≥ 1% of price), the offer needs to be $122k (4.3% below list).
- Recommended offer: $122k (4.3% below list) — sets the bar for 1% rule.
- Cap rate 6.7% vs local median 9.9% in Jackson — below-typical yield; the buyer is paying a premium for something (appreciation thesis, condition, location) that the cap rate doesn't capture.
Location & tenants
- Location reads 68/100 on livability (#66 in MS) — a middle-class / working-renter tenant base. Strengths: commute A+, cost of living A+, housing A+; Watch: amenities F, employment F, health & safety F.
- Jackson Public School District (urban): math 9% / reading 18% proficiency, ranked #112 of 130 in MS (top 86%) — low school quality limits family demand, transient renter base, plan for 1-2y turnover; 88% free/reduced lunch — lower-income household profile, screen leases tightly.
- Zoned schools: Lester Elementary School (math 8% / reading 42%, grade F, #220 of 375 statewide, top 59%, 187 students, 100% FRL); Peeples Middle School (math 11% / reading 15%, grade F, #141 of 179 statewide, top 79%, 298 students, 100% FRL); Wingfield High School (math 7% / reading 12%, grade F, #179 of 197 statewide, top 92%, 608 students, 100% FRL).
- Market conditions: Rents rising fast (+13.6%/yr); 121 active listings in the ZIP; 25 comparable units currently listed for rent nearby; rentals at typical pace (median 26d on market — plan ~3-4 weeks tenant-placement turnaround); lower-income renter base — watch delinquency; 167 units permitted in Hinds County in 2024 (0 in 5+ unit buildings).
- At $1,220/mo this rent would consume 48% of the median local household income ($30k/yr) (locally 1099% of renters already pay >50% of income on rent) — very limited rent-growth headroom before tenants either downsize or default.
Forward outlook
- In year one you build about $14k of equity ($882 loan paydown + $13k appreciation (10.0% local appreciation)).
- Hinds County population projected to shrink 6% by 2050 — rents likely to lag national; underwrite the cash flow, not the appreciation.
- At projected returns (10.0% appreciation + 8.0% rent growth), your $36k cash investment doubles in ~3 years — after that, you're playing with house money.
- By year 3, paydown + projected appreciation supports a ~$35k cash-out refi (75% LTV) — recoverable capital for the next deal without selling this one.
Negotiation context
- Only 4 days on market — expect competitive offers; lowballing is unlikely to land.
- 6 sale attempts since 3y ago with the ask held roughly flat each time — persistent listings suggest the price (not the market) is what's stuck; bring a comps-based counter.
Risks & watch-outs
- Climate carrying-cost: severe wind risk, 80% chance of damaging wind over 30y; extreme-heat days projected 7→18/yr by 2055 (HVAC capex compounding) — expect insurance premiums to compound above CPI over the hold.
Questions for the listing agent
- Is there a deadline driving the sale (1031 exchange, divorce, estate, relocation)? That informs how much negotiation room exists.
- Schools are F-rated, which usually means shorter tenancies and higher turnover. Who's the typical renter profile here, and what's been the actual vacancy rate?
- What's the average days-on-market for RENTAL listings here right now (not sales)? A rising rental-DOM trend means longer vacancies and softer asking-rent achievability than the comps imply.
- What's the recent tenant-quality profile in this submarket — average credit score on applications, eviction rate, late-payment / NSF rate, and stable-employment percentage? A property-management company in the area should have these aggregated.
- How much new for-sale + rental construction is in the pipeline within 1–3 miles? Heavy new supply typically softens prices + rents 12–24 months out; constrained supply supports both.
Investment metrics
- 1% rule
- 0.96% ✗
- Cap rate
- 6.69%
- Cash-on-cash
- 1.41%
- DSCR
- 1.06
- GRM
- 8.7
CMA / ARV
- ARV (on-the-fly)
- $56,498
- Comps found
- 12
Show comp detail 12 sales within ~0.75 mi
| Address | Dist | Beds/Ba | Sqft | Sold | Price | $/sf | Match |
|---|---|---|---|---|---|---|---|
| 2261 Paden St | 0.39mi | 3/2.0 | 1,369 (-1%) | 3mo | $70,000 | $51 | 78 |
| 1941 Catalina Dr | 0.26mi | 3/1.5 | 1,458 (+6%) | 1mo | $85,000 | $58 | 75 |
| 1746 Casteel Dr | 0.50mi | 3/2.0 | 1,376 (-0%) | 1mo | $65,000 | $47 | 75 |
| 2081 Shady Lane Dr | 0.42mi | 3/2.0 | 1,420 (+3%) | 4mo | $12,000 | $8 | 72 |
| 837 Combs St | 0.46mi | 4/2.0 (+1) | 1,408 (+2%) | 1mo | $15,500 | $11 | 69 |
| 1945 Camellia Ln | 0.21mi | 3/2.0 | 1,525 (+11%) | 5mo | $62,900 | $41 | 68 |
| 2112 Paden St | 0.31mi | 3/1.0 | 1,259 (-9%) | 1mo | $35,000 | $28 | 66 |
| 931 Stuart St | 0.66mi | 3/2.0 | 1,363 (-1%) | 3mo | $32,500 | $24 | 65 |
| 2005 Oakhurst Dr | 0.66mi | 3/2.0 | 1,433 (+4%) | 4mo | $52,500 | $37 | 59 |
| 545 Merigold Dr | 0.41mi | 3/2.0 | 1,220 (-12%) | 4mo | $79,000 | $65 | 58 |
| 2416 Paden St | 0.61mi | 4/2.0 (+1) | 1,178 (-14%) | 0mo | $84,900 | $72 | 42 |
| 263 Shady Cir | 0.69mi | 3/2.0 | 1,574 (+14%) | 5mo | $55,000 | $35 | 40 |
Match score weights: distance 35% · size 25% · config 20% · recency 20%. Top-matched comps best support the ARV.
Projected returns pro-forma
10.0% appreciation · 8.0% rent growth · sell at horizon
- IRR
- 27.2%
- Equity multiple
- 3.20×
- Total profit
- $78,600
- Equity at exit
- $114,862
- IRR
- 25.3%
- Equity multiple
- 7.87×
- Total profit
- $245,426
- Equity at exit
- $247,704
Cash invested: $35,700 (down + closing). Projections, not guarantees.
Landlord ↔ Tenant lean methodology
- Overall (STATE)
- 90 Strongly Landlord-Friendly
- State Mississippi
- 90 Strongly Landlord-Friendly · R+11
- County
- — inherits STATE
- City
- — inherits STATE
ZIP-level market 39204
- Home prices YoY
- 8.0%
- Rents YoY
- 13.6%
- Active inventory
- 121
- Price-to-rent
- 8.7×
Monthly cashflow live
- Estimated rent
- $1,220 high interval (Pro) →
- Mortgage (P&I)
- −$669
- Tax from tax record
- −$200 /mo · $2,402/yr
- Insurance
- −$53
- HOA
- −$0
- Vacancy / Maint / Mgmt
- −$256
- Net cashflow
- $42
Break-even live
Sensitivity live
| Price | -10% $114 | -5% $78 | +0% $42 | +5% $6 | +10% $-30 |
|---|---|---|---|---|---|
| Rent | -10% $-54 | -5% $-6 | +0% $42 | +5% $90 | +10% $138 |
| Rate | -1.0pp $106 | -0.5pp $74 | base $42 | +0.5pp $9 | +1.0pp $-25 |
UW: 25.0% down · 7.5% · 30yr · 1.5% tax · 5.0% vac · 8.0% maint · 8.0% mgmt
Financing live
Cash to close
- Down payment
- $31,875
- Closing costs
- $3,825
- Reserves months
- —
- Total cash needed
- —
Loan-product check · same deal, 3 products live
Conventional
25% down · 7.5% · 30yr
- Down + closing
- —
- Monthly P&I
- —
- Monthly cashflow
- —
- DSCR
- —
- Eligible?
- —
Personal DTI + credit; lowest rate.
DSCR
20% down · 8.5% · 30yr
- Down + closing
- —
- Monthly P&I
- —
- Monthly cashflow
- —
- DSCR
- —
- Eligible?
- —
No personal income docs; deal must DSCR.
Hard money
10% down · 12.0% · 12mo
- Down + closing
- —
- Monthly P&I
- —
- Monthly cashflow
- —
- DSCR
- —
- Eligible?
- —
Short-term bridge; refi at stabilization.
Rent comps 25 comps
| Address | Beds | Baths | Sqft | Rent | $/sqft | DOM | Units | Dist |
|---|---|---|---|---|---|---|---|---|
| 1848 Willaneel Dr Jackson, MS | 4.0 | 2.0 | 1623 | $1,100 | $0.68 | 16d | 1 | 0.15mi |
| 2401 Coronet Pl Jackson, MS | 3.0 | 1.0 | 1200 | $1,400 | $1.17 | 25d | 1 | 0.56mi |
| 1645 Camellia Ln Jackson, MS | 3.0 | 2.0 | 1268 | $1,200 | $0.95 | 16d | 1 | 0.57mi |
| 2242 Castle Hill Dr Jackson, MS | 4.0 | 2.0 | 1500 | $1,475 | $0.98 | 25d | 1 | 0.65mi |
| 2242 Castle Hill Dr Jackson, MS | 4.0 | 2.0 | 1500 | $1,475 | $0.98 | 16d | 1 | 0.65mi |
| 245 Shady Cir Jackson, MS | 3.0 | 2.0 | 1510 | $1,100 | $0.73 | 25d | 1 | 0.70mi |
| 843 Reaves St Jackson, MS | 3.0 | 2.0 | 1408 | $1,084 | $0.77 | 45d | 1 | 0.73mi |
| 125 Wingfield Ct Unit NA Jackson, MS | 4.0 | 2.0 | 1797 | $1,650 | $0.92 | 25d | 1 | 0.93mi |
| 2858 Fairhill Dr Jackson, MS | 2.0 | 1.0 | 900 | $825 | $0.92 | 45d | 1 | 0.96mi |
| 225 W McDowell Rd Jackson, MS | 1.0–3.0 | 1.0–2.0 | 900 | $1,200 | $1.33 | 45d | 18 | 1.00mi |
| 1126 Barbara Ann Dr Jackson, MS | 3.0 | 1.0 | 1343 | $1,000 | $0.74 | 16d | 1 | 1.00mi |
| 1126 Barbara Ann Dr Jackson, MS | 3.0 | 1.0 | 1343 | $1,000 | $0.74 | 45d | 1 | 1.00mi |
| 2694 Woodside Dr Jackson, MS | 3.0 | 1.0 | 1509 | $1,075 | $0.71 | 16d | 1 | 1.05mi |
| 2694 Woodside Dr Jackson, MS | 3.0 | 1.0 | 1509 | $1,075 | $0.71 | 25d | 1 | 1.05mi |
| 1513 Maria Dr Jackson, MS | 3.0 | 2.0 | 1120 | $1,200 | $1.07 | 25d | 1 | 1.09mi |
| 1513 Maria Dr Jackson, MS | 3.0 | 2.0 | 1120 | $1,200 | $1.07 | 16d | 1 | 1.09mi |
| 2732 Woodside Dr Jackson, MS | 4.0 | 2.0 | 1566 | $1,050 | $0.67 | 25d | 1 | 1.09mi |
| 2729 Carleton St Jackson, MS | 4.0 | 2.0 | 1666 | $1,575 | $0.95 | 16d | 1 | 1.10mi |
| 2786 Brookwood Dr Jackson, MS | 3.0 | 1.0 | 1003 | $1,100 | $1.10 | 45d | 1 | 1.15mi |
| 2873 Teresa Dr Jackson, MS | 3.0 | 1.0 | 1100 | $1,100 | $1.00 | 45d | 1 | 1.35mi |
| 201 W Santa Clair St Jackson, MS | 2.0 | 1.0 | 1182 | $950 | $0.80 | 16d | 1 | 1.40mi |
| 201 W Santa Clair St Jackson, MS | 2.0 | 1.0 | 1182 | $950 | $0.80 | 25d | 1 | 1.40mi |
| 427 McDowell Park Cir Jackson, MS | 3.0 | 1.5 | 1308 | $1,200 | $0.92 | 16d | 1 | 1.42mi |
| 1805 Hospital Dr Jackson, MS | 3.0 | 2.0 | 1335 | $1,050 | $0.79 | 16d | 1 | 1.45mi |
| 1223 Marydale Dr Jackson, MS | 3.0 | 1.0 | 1300 | $950 | $0.73 | 45d | 1 | 1.47mi |
Listing history 3 events
-
2026-06-22statusdays on market $127,500 Pending 4 DOM
-
2026-06-18remarks 316-char remark
-
2026-06-18$127,500 Active 1 DOM
ⓘ Source: listings_history table (triggers on properties + properties_extension) + one-shot
backfill from property_details.listing_events for pre-trigger history.
Tax reassessment forecast MS · Resets to sale price
- Current annual tax
- $2,402 · $200/mo
- Projected year-2 tax
- $2,402 · $200/mo
- Expected delta
- $0/yr ($0/mo · 0.0%)
ⓘ Screening estimate from a state-policy table — verify with the county assessor before closing.
Climate risk First Street
- Flood 1/10 Low FEMA zone X (unshaded) · 0% chance over 30 yrs
- Wildfire 1/10 Low
- Heat 7/10 Severe 7 d/yr ≥108°F today · 18 d/yr by 30 yrs out
- Wind 8/10 Severe 80% chance of damaging wind over 30 yrs
- Air quality 1/10 Low 0 unhealthy d/yr today · 0 by 30 yrs out
Nearby sold comps map
Loading sold comps map…
Walkable amenities ~0.75 mi
Loading nearby amenities…
Taxation est. · year 1
- Rental income
- $14,641
- − Mortgage interest
- −$7,142
- − Property taxes
- −$2,402
- − Insurance
- −$638
- − Repairs & maintenance
- −$1,171
- − Management
- −$1,171
- − Depreciation
- −$3,709
- Taxable loss
- −$1,593
- Est. tax savings @ 24.0%
- +$382
- After-tax cash flow
- $885/yr
For passive investors: Depreciation is non-cash, so a rental often shows a tax loss while cash-flowing — sheltering income. Rental losses are passive: they offset passive income freely, and up to $25,000/yr can offset ordinary (W-2) income if you actively participate and your MAGI is under $100k (phasing out to $0 by $150k); unused losses carry forward. On sale, claimed depreciation is recaptured at up to 25%, and gains may owe capital-gains tax (a 1031 exchange can defer both). Figures are a year-1 estimate at your 24.0% rate — not tax advice; consult a CPA.
Schools (NCES district)
- District
- Jackson Public School District
- NCES district ID
- 2802190
- Math proficiency
- 9% ▼ -14.00%
- Reading proficiency
- 18% ▼ -7.00%
- Median HH income
- $33,234
- Composite
- 10.89/100
- National rank
- #9755
- State rank
- #112 of 130 in MS
Livability — Jackson
- Score
- 68/100
- State rank
- #66
- US rank
- #9695
Category grades
Schools grade is shown separately in the Schools card above.
Census & demographics
- Census place
- Jackson, MS
- County
- Hinds County · 167,040 people
- City population
- 140,204
- Metro
- Jackson, MS
- Population (ZIP)
- 13,249
- Household income
- $30,237
- Rent vs Own
- Severe rent burden
- 1099.0
Population outlook (Hinds County) Hauer SSP2
- Today (2025)
- 242,528 people
- By 2030
- 241,113 · -0.6%
- By 2040
- 235,557 · -2.9%
- By 2050
- 226,946 · -6.4%
- By 2075
- 199,995 · -17.5%
- By 2100
- 164,165 · -32.3%
Race, ethnicity, and origin ACS 2023
- Neighborhood character
- Predominantly Black (90%)
- Race & ethnicity
- Black 90% White 5% Two or more races 4% Hispanic / Latino 3%
- Foreign-born
- 2% · Canada
- Languages at home
- 97% English-only · Spanish 2%
Political lean MEDSL · Hinds
- 2024 margin
- Solid D (+46.1) · D 72.4% · R 26.3% · Other 1.4%
- 2008→2024 swing
- +7.1pp toward D · 2008: 39.0pp · 2024: 46.1pp
- All cycles
- 2024: D+46.1 2020: D+48.3 2016: D+43.7 2012: D+45.1 2008: D+39.0
Not yet ingested
- Civics
- —
Market trends
- HPI YoY
- ▲ 17.25%
- Current HPI
- 233.9061
- Rent YoY
- ▲ 13.56%
- Metro
- Jackson, MS
- State GDP YoY
- —
- F500 in state
- 0
Price history
+160.2% since first listed17 events — show timeline
- 2026-06-17 Listed $127,500 MLSU
- 2025-03-14 Sold (MLS) — MLSU
- 2025-02-01 Pending — MLSU
- 2025-01-21 Price Changed $114,000 MLSU
- 2025-01-08 Listed $119,000 MLSU
- 2024-12-01 Rental Removed $1,285 BUILDIUM
- 2024-11-09 Listed for Rent $1,285 BUILDIUM
- 2023-11-30 Sold (MLS) — MLSU
- 2023-11-13 Sold (Public Records) — Public Records
- 2023-10-19 Pending — MLSU
- 2023-10-19 Relisted — MLSU
- 2023-10-18 Listing Removed — MLSU
- 2023-10-16 Relisted — MLSU
- 2023-10-16 Listing Removed — MLSU
- 2023-10-12 Price Changed $45,000 MLSU
- 2023-09-29 Listed $49,000 MLSU
- 2000-12-30 Sold (Public Records) — Public Records
Property tax history
+7.5%/yrLatest (2025): $2,402 · +3.7% YoY. Source: county tax records.
Cash-flow waterfall
monthlySold comps — $/sqft
last 12 mo · ≤1 miLoading sold comps…