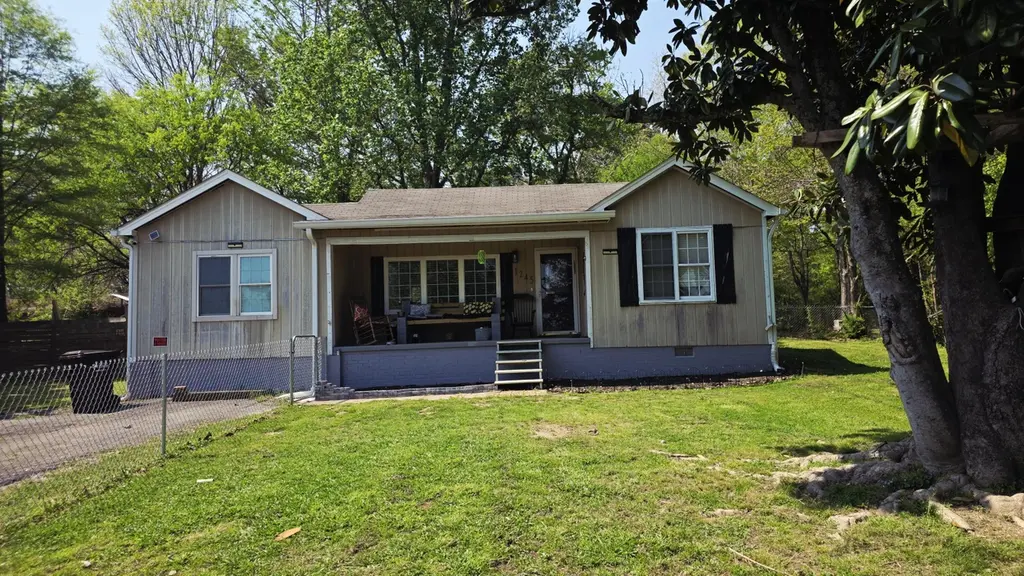
1245 Eagle Rd NE · Cleveland, TN
Flood risk 1/10 · Minimal
- FEMA flood zone
- X (unshaded)
- Chance of flooding over 30 yrs
- 0.0%
- Est. flood insurance / yr
- $507 – $1,088
Fire risk 3/10 · Minor
- Est. fire insurance / yr
- $949 – $1,763
Heat risk 6/10 · Moderate
- Hot days now (above 104°F)
- 7 days/yr
- Hot days in 30 yrs
- 19 days/yr
Wind risk 3/10 · Minor
- Chance of severe wind over 30 yrs
- 6.0%
Air-quality risk 3/10 · Minor
- Unhealthy air days now
- 2 days/yr
- Unhealthy air days in 30 yrs
- 3 days/yr
Risk factors via First Street. Map © Google.
Why this score? — see what drove the B grade
The composite is a weighted blend of 9 inputs, each scored 0–100. Each bar is that input's sub-score; the figure is the points it added to the 100-point composite (weight × sub-score).
- Cash flow +29.7/30.0
- ARV discount +15.0/15.0
- DSCR +10.0/10.0
- 1% rule +7.1/10.0
- Livability +3.5/5.0
- Schools +3.0/10.0
- Rent growth +2.5/5.0
- Condition / age +2.5/5.0
- Appreciation +0.0/10.0
$139,900
🖨 Deal sheet (PDF) 📄 Offer letter ✓ Due diligence
Listing remarks MLS
Seller says let 'er go. Location, Location, Location in between Hwy 64 and Benton Pike and Whirlpool at the end of the street. Easy access to all areas of Cleveland. This handyman special is ready for your personal touches. Hardwood floors ready for refinishing. Ceramic tile in kitchen and laundry room. Home inspection report is available. Houses in the neighborhood are being updated for a revitalized community. Another bonus is walk to work if you are employed at Whirlpool. Come check it out and make your best offer.
Key facts
- Easy access
- Walk to work
- Ceramic tile
Tags
Property features AI
Exterior
- Parking: Driveway with gravel surface
- Utilities: Public water available; Septic tank; Water service available
- Home design: Single-family residence; Residential property; Three or more levels
- Construction: Fiber cement exterior; Shingle roof
- Exterior features: Level lot
Interior
- Kitchen: Electric oven; Electric range; Dishwasher; Refrigerator; Microwave
- Bedrooms: 3 bedrooms (all on the main level)
- Flooring: Carpet; Wood; Tile
- Bathrooms: 1 full bathroom
- Interior features: Ceiling fans
Neighborhood map
What this means for you Summary
Snapshot
- This is a 3-bed/1.0-bath single-family listed at $140k.
Deal economics
- At list price, monthly cash flow is $508 ($6k/yr) — positive.
- The deal already cash-flows at list — no discount required.
- Meets the 1% rule at list price ($2k rent vs $140k).
- Cap rate 10.6% vs local median 3.5% in Cleveland — top-decile yield for the area; either an underpriced asset or a hidden risk that comps aren't pricing in. Stress-test before assuming the spread holds.
Location & tenants
- Location reads 70/100 on livability (#55 in TN) — a middle-class / working-renter tenant base. Strengths: cost of living A+, health & safety A+, housing A; Watch: schools D, employment D, crime F.
- Bradley County (other): math 35% / reading 34% proficiency, ranked #33 of 139 in TN (top 24%) — families likely to look elsewhere, expect single-tenant / working-renter base with shorter leases.
- Market conditions: 375 active listings in the ZIP; 768 units permitted in Bradley County in 2024 (0 in 5+ unit buildings).
Forward outlook
- Local home prices are declining (-3.0%/yr); year-one equity from $967 of loan paydown is wiped out by about $4k of value loss. Plan a longer hold.
- Bradley County population projected at +21% by 2050 — long-run rental-demand tailwind backs the buy-and-hold thesis.
- At projected returns (-3.0% appreciation + 3.0% rent growth), your $39k cash investment doubles in ~8 years — after that, you're playing with house money.
Negotiation context
- Only 4 days on market — expect competitive offers; lowballing is unlikely to land.
- 2 sale attempts; this cycle's ask has dropped $15k (10%) from the opening price — seller is motivated, your offer sets the floor, not the list.
Risks & watch-outs
- Watch-outs: built in 1953 — expect roof / HVAC / electrical / plumbing capex.
- Climate carrying-cost: extreme-heat days projected 7→19/yr by 2055 (HVAC capex compounding) — expect insurance premiums to compound above CPI over the hold.
Questions for the listing agent
- Built in 1953 — when were the roof, HVAC, electrical panel, plumbing, and water heater last replaced?
- Is there a deadline driving the sale (1031 exchange, divorce, estate, relocation)? That informs how much negotiation room exists.
- Schools are D-rated, which usually means shorter tenancies and higher turnover. Who's the typical renter profile here, and what's been the actual vacancy rate?
- Crime grade is F in this area — have there been break-ins, vandalism, or insurance claims at this property in the last 3 years? What carrier currently insures it and at what premium?
- What's the average days-on-market for RENTAL listings here right now (not sales)? A rising rental-DOM trend means longer vacancies and softer asking-rent achievability than the comps imply.
- What's the recent tenant-quality profile in this submarket — average credit score on applications, eviction rate, late-payment / NSF rate, and stable-employment percentage? A property-management company in the area should have these aggregated.
- How much new for-sale + rental construction is in the pipeline within 1–3 miles? Heavy new supply typically softens prices + rents 12–24 months out; constrained supply supports both.
Investment metrics
- 1% rule
- 1.21% ✓
- Cap rate
- 10.65%
- Cash-on-cash
- 15.56%
- DSCR
- 1.69
- GRM
- 6.9
CMA / ARV
- ARV (median comp)
- $196,652
- List price
- $139,900
- Delta
- -21.18%
- Verdict
- UNDERPRICED
- Comps
- 20 within 1.0 mi
Show comp detail 11 sales within ~0.75 mi
| Address | Dist | Beds/Ba | Sqft | Sold | Price | $/sf | Match |
|---|---|---|---|---|---|---|---|
| 1255 Eagle Park Rd NE | 0.02mi | 3/2.0 | 1,076 (+1%) | 3mo | $252,500 | $235 | 91 |
| 1260 Eagle Park Rd NE | 0.04mi | 3/2.0 | 1,016 (-5%) | 8mo | $170,000 | $167 | 79 |
| 1240 Eagle Park NE | 0.03mi | 3/1.0 | 1,000 (-6%) | 15mo | $195,000 | $195 | 75 |
| 445 Ledford Rd NE | 0.56mi | 3/1.0 | 1,092 (+2%) | 3mo | $199,000 | $182 | 67 |
| 148 Cloverleaf Ct NE | 0.46mi | 3/1.5 | 1,104 (+3%) | 23mo | $254,000 | $230 | 52 |
| 235 NE Parker Dr | 0.59mi | 3/1.0 | 1,015 (-5%) | 22mo | $205,000 | $202 | 46 |
| 645 Ledford Rd NE | 0.62mi | 3/2.0 | 1,004 (-6%) | 15mo | $215,000 | $214 | 45 |
| 145 Cherokee Dr | 0.75mi | 3/2.0 | 1,074 (+1%) | 21mo | $205,000 | $191 | 42 |
| 275 Orlando Dr | 0.59mi | 2/1.0 (-1) | 972 (-9%) | 21mo | $146,500 | $151 | 36 |
| 729 Minnis Rd | 0.74mi | 3/1.5 | 1,219 (+14%) | 21mo | $267,000 | $219 | 22 |
| 730 NE Ledford Rd | 0.61mi | 2/2.0 (-1) | 922 (-14%) | 21mo | $201,100 | $218 | 22 |
Match score weights: distance 35% · size 25% · config 20% · recency 20%. Top-matched comps best support the ARV.
Projected returns pro-forma
-3.0% appreciation · 3.0% rent growth · sell at horizon
- IRR
- 6.3%
- Equity multiple
- 1.25×
- Total profit
- $9,624
- Equity at exit
- $20,860
- IRR
- 15.7%
- Equity multiple
- 2.27×
- Total profit
- $49,810
- Equity at exit
- $12,096
Cash invested: $39,172 (down + closing). Projections, not guarantees.
Landlord ↔ Tenant lean methodology
- Overall (STATE)
- 87 Strongly Landlord-Friendly
- State Tennessee
- 87 Strongly Landlord-Friendly · R+13
- County
- — inherits STATE
- City
- — inherits STATE
ZIP-level market 37323
- Home prices YoY
- -23.5%
- Active inventory
- 375
- Price-to-rent
- 6.9×
Monthly cashflow live
- Estimated rent
- $1,700 medium interval (Pro) →
- Mortgage (P&I)
- −$734
- Tax from tax record
- −$43 /mo · $514/yr
- Insurance
- −$58
- HOA
- −$0
- Vacancy / Maint / Mgmt
- −$357
- Net cashflow
- $508
Break-even live
Sensitivity live
| Price | -10% $587 | -5% $548 | +0% $508 | +5% $468 | +10% $429 |
|---|---|---|---|---|---|
| Rent | -10% $374 | -5% $441 | +0% $508 | +5% $575 | +10% $642 |
| Rate | -1.0pp $578 | -0.5pp $543 | base $508 | +0.5pp $472 | +1.0pp $435 |
UW: 25.0% down · 7.5% · 30yr · 1.5% tax · 5.0% vac · 8.0% maint · 8.0% mgmt
Financing live
Cash to close
- Down payment
- $34,975
- Closing costs
- $4,197
- Reserves months
- —
- Total cash needed
- —
Loan-product check · same deal, 3 products live
Conventional
25% down · 7.5% · 30yr
- Down + closing
- —
- Monthly P&I
- —
- Monthly cashflow
- —
- DSCR
- —
- Eligible?
- —
Personal DTI + credit; lowest rate.
DSCR
20% down · 8.5% · 30yr
- Down + closing
- —
- Monthly P&I
- —
- Monthly cashflow
- —
- DSCR
- —
- Eligible?
- —
No personal income docs; deal must DSCR.
Hard money
10% down · 12.0% · 12mo
- Down + closing
- —
- Monthly P&I
- —
- Monthly cashflow
- —
- DSCR
- —
- Eligible?
- —
Short-term bridge; refi at stabilization.
Listing history 24 events
-
2026-06-21pricedays on market $139,900 Active 4 DOM
-
2026-06-19days on market $155,000 Active 2 DOM
-
2026-06-17days on market $155,000 Active 1 DOM
-
2026-06-17days on market $155,000 Active 68 DOM
-
2026-06-16days on market $155,000 Active 67 DOM
-
2026-06-15days on market $155,000 Active 66 DOM
-
2026-06-14days on market $155,000 Active 64 DOM
-
2026-06-13days on market $155,000 Active 63 DOM
-
2026-06-10days on market $155,000 Active 61 DOM
-
2026-06-09days on market $155,000 Active 60 DOM
-
2026-06-08pricedays on market $155,000 Active 59 DOM
-
2026-06-07days on market $160,000 Active 58 DOM
Show marketing remark (523 chars)
Seller says let 'er go. Location, Location, Location in between Hwy 64 and Benton Pike and Whirlpool at the end of the street. Easy access to all areas of Cleveland. This handyman special is ready for your personal touches. Hardwood floors ready for refinishing. Ceramic tile in kitchen and laundry room. Home inspection report is available. Houses in the neighborhood are being updated for a revitalized community. Another bonus is walk to work if you are employed at Whirlpool. Come check it out and make your best offer.
-
2026-06-05days on market $160,000 Active 55 DOM
-
2026-06-02days on market $160,000 Active 53 DOM
-
2026-06-01days on market $160,000 Active 52 DOM
-
2026-05-31days on market $160,000 Active 51 DOM
-
2026-05-30days on market $160,000 Active 50 DOM
-
2026-04-10$180,000 Active 499-char remark
Show marketing remark (523 chars)
Seller says let 'er go. Location, Location, Location in between Hwy 64 and Benton Pike and Whirlpool at the end of the street. Easy access to all areas of Cleveland. This handyman special is ready for your personal touches. Hardwood floors ready for refinishing. Ceramic tile in kitchen and laundry room. Home inspection report is available. Houses in the neighborhood are being updated for a revitalized community. Another bonus is walk to work if you are employed at Whirlpool. Come check it out and make your best offer.
-
2025-07-10soldstatus $124,900
-
2007-04-19soldstatus $41,700
-
2007-01-31soldstatus $97,000
-
2000-08-16soldstatus $52,000
-
1993-07-28soldstatus $28,736
-
1987-09-30soldstatus $24,000
ⓘ Source: listings_history table (triggers on properties + properties_extension) + one-shot
backfill from property_details.listing_events for pre-trigger history.
Tax reassessment forecast TN · Resets to sale price
- Current annual tax
- $514 · $43/mo
- Projected year-2 tax
- $993 · $83/mo
- Expected delta
- +$479/yr (+$40/mo · 93.2%)
ⓘ Screening estimate from a state-policy table — verify with the county assessor before closing.
Climate risk First Street
- Flood 1/10 Low FEMA zone X (unshaded) · 0% chance over 30 yrs
- Wildfire 3/10 Moderate
- Heat 6/10 Major 7 d/yr ≥104°F today · 19 d/yr by 30 yrs out
- Wind 3/10 Moderate 6% chance of damaging wind over 30 yrs
- Air quality 3/10 Moderate 2 unhealthy d/yr today · 3 by 30 yrs out
Nearby sold comps map
Loading sold comps map…
Walkable amenities ~0.75 mi
Loading nearby amenities…
Taxation est. · year 1
- Rental income
- $20,395
- − Mortgage interest
- −$7,837
- − Property taxes
- −$514
- − Insurance
- −$700
- − Repairs & maintenance
- −$1,632
- − Management
- −$1,632
- − Depreciation
- −$4,070
- Taxable income
- $4,012
- Est. tax owed @ 24.0%
- −$963
- After-tax cash flow
- $5,132/yr
For passive investors: Depreciation is non-cash, so a rental often shows a tax loss while cash-flowing — sheltering income. Rental losses are passive: they offset passive income freely, and up to $25,000/yr can offset ordinary (W-2) income if you actively participate and your MAGI is under $100k (phasing out to $0 by $150k); unused losses carry forward. On sale, claimed depreciation is recaptured at up to 25%, and gains may owe capital-gains tax (a 1031 exchange can defer both). Figures are a year-1 estimate at your 24.0% rate — not tax advice; consult a CPA.
Schools (NCES district)
- District
- Bradley County
- NCES district ID
- 4700330
- Math proficiency
- 35% ▼ -5.00%
- Reading proficiency
- 34% ▼ -2.00%
- Median HH income
- $45,807
- Composite
- 29.54/100
- National rank
- #6494
- State rank
- #33 of 139 in TN
Livability — Cleveland
- Score
- 70/100
- State rank
- #55
- US rank
- #7689
Category grades
Schools grade is shown separately in the Schools card above.
Census & demographics
- County
- Bradley County · 99,337 people
- City population
- 99,337
- Metro
- Cleveland, TN
- Population (ZIP)
- 31,948
- Household income
- $68,768
- Rent vs Own
- Severe rent burden
- 371.0
Population outlook (Bradley County) Hauer SSP2
- Today (2025)
- 114,901 people
- By 2030
- 120,137 · +4.6%
- By 2040
- 130,125 · +13.2%
- By 2050
- 139,257 · +21.2%
- By 2075
- 161,664 · +40.7%
- By 2100
- 179,767 · +56.5%
Race, ethnicity, and origin ACS 2023
- Neighborhood character
- Predominantly White (88%)
- Race & ethnicity
- White 88% Hispanic / Latino 7% Two or more races 6% Black 1%
- Hispanic origin (detail)
- Mexican 4% Puerto Rican 1%
- Common ancestry
- Lithuanian 2% Subsaharan African 2% Italian 1%
- Foreign-born
- 4% · Canada
- Languages at home
- 93% English-only · Spanish 5% Russian/Polish/Slavic 2%
Political lean MEDSL · Bradley
- 2024 margin
- Solid R (+58.9) · D 20.0% · R 78.9% · Other 1.1%
- 2008→2024 swing
- -9.2pp toward R · 2008: -49.7pp · 2024: -58.9pp
- All cycles
- 2024: R+58.9 2020: R+55.3 2016: R+59.1 2012: R+53.9 2008: R+49.7
Not yet ingested
- Civics
- —
Market trends
- HPI YoY
- ▼ -88.38%
- Current HPI
- 287.3643
- Rent YoY
- —
- Metro
- Cleveland, TN
- State GDP YoY
- ▲ 2.78%
- F500 in state
- 22
Industry mix (Fortune 500 HQ in TN)
| Industry | F500 HQs | Revenue |
|---|---|---|
| Healthcare | 3 | $91B |
|
||
| Retail | 3 | $72B |
|
||
| Transportation / Logistics | 1 | $88B |
|
||
| Paper / Packaging | 1 | $19B |
|
||
| Insurance | 1 | $13B |
|
||
| Energy | 1 | $12B |
|
||
Price history
+545.8% since first listed11 events — show timeline
- 2026-06-07 Price Changed $155,000 RCAOR
- 2026-05-27 Price Changed $160,000 RCAOR
- 2026-05-19 Price Changed $170,000 RCAOR
- 2026-04-10 Listed $155,000 REALTRACS as Distributed by MLS Grid
- 2026-04-10 Listed $180,000 RCAOR
- 2025-07-10 Sold (Public Records) $124,900 Public Records
- 2007-04-19 Sold (Public Records) $41,700 Public Records
- 2007-01-31 Sold (Public Records) $97,000 Public Records
- 2000-08-16 Sold (Public Records) $52,000 Public Records
- 1993-07-28 Sold (Public Records) $28,736 Public Records
- 1987-09-30 Sold (Public Records) $24,000 Public Records
Property tax history
+2.3%/yrLatest (2025): $514 · +15.8% YoY. Source: county tax records.
Cash-flow waterfall
monthlySold comps — $/sqft
last 12 mo · ≤1 miLoading sold comps…