20512 Prairie Rd · Alger, WA
Flood risk 1/10 · Minimal
- FEMA flood zone
- —
- Chance of flooding over 30 yrs
- 0.0%
- Est. flood insurance / yr
- —
Fire risk 3/10 · Minor
- Est. fire insurance / yr
- $604 – $1,122
Heat risk 2/10 · Minimal
- Hot days now (above 84°F)
- 8 days/yr
- Hot days in 30 yrs
- 19 days/yr
Wind risk 1/10 · Minimal
- Chance of severe wind over 30 yrs
- —
Air-quality risk 6/10 · Moderate
- Unhealthy air days now
- 9 days/yr
- Unhealthy air days in 30 yrs
- 9 days/yr
Risk factors via First Street. Map © Google.
Why this score? — see what drove the D- grade
The composite is a weighted blend of 9 inputs, each scored 0–100. Each bar is that input's sub-score; the figure is the points it added to the 100-point composite (weight × sub-score).
- ARV discount +11.4/15.0
- Appreciation +10.0/10.0
- Schools +4.7/10.0
- Cash flow +3.3/30.0
- Livability +2.9/5.0
- Rent growth +2.5/5.0
- Condition / age +2.5/5.0
- 1% rule +0.0/10.0
- DSCR +0.0/10.0
$629,000
🖨 Deal sheet (PDF) 📄 Offer letter ✓ Due diligence
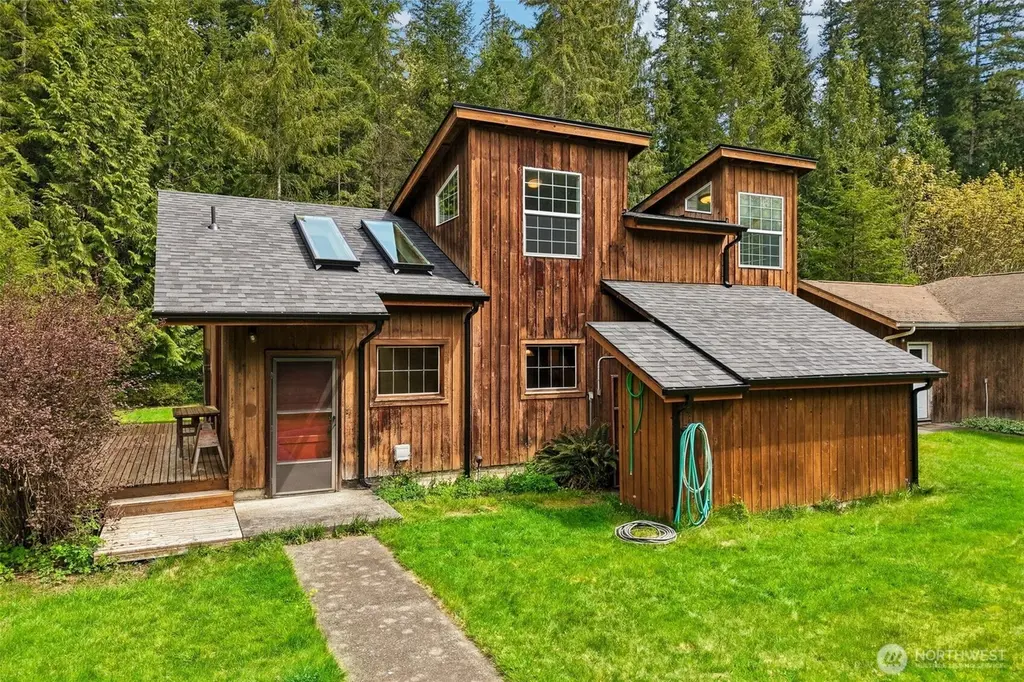
Listing remarks
Tucked away on 1.4 acres of private, usable land, this 3-bedroom, 1.75-bath home offers a peaceful setting with character, just minutes from Sedro-Woolley and I-5. The home is clean, well cared for, and move-in ready, with fresh interior paint and new flooring throughout the main living areas. The living room gets great natural light and opens to a long deck along the side of the home, perfect for morning coffee or summer evenings. The kitchen is functional and spacious, with room to update over time. Upstairs features a bedroom, an updated bathroom, and a flexible bonus space that can work as a dressing room, yoga room, or creative area. The attic offers additional storage. Outside, this
Key facts
- Flexible bonus space
- Shed for tools
- Long deck
Tags
Property features AI
Finance
- Financial info: Financing: Cash, Conventional, FHA, USDA, VA
Exterior
- Parking: Detached garage (2 covered spaces); Approximately 400 sq ft garage; RV parking
- Utilities: Electric, propane, and wood energy sources; Individual well water; Septic tank sewer service; Power provided by PSE; Electric water heater
- Home design: Single-family residence, two stories; Entry on lower level; Built on lot; Has view
- Construction: Wood construction; Composition (shingle) roof; Foundation: concrete ribbon, pillar/post/pier, slab; Built condition: good
- Exterior features: Wood exterior; Wood products; Deck; Outbuildings; RV parking; Garden space; Wooded setting; Secluded lot; Value in land
Interior
- Kitchen: Refrigerator; Stove/Range
- Bedrooms: 3 bedrooms (1 upper, 2 lower)
- Flooring: Ceramic tile; Hardwood; Vinyl plank
- Bathrooms: 1 full bath; 1 three-quarter bath
- Heating & cooling: Baseboard heating; Stove / free-standing heating; Additional heating noted in remarks; No central cooling
- Interior features: Fireplace (wood-burning); Sauna; Skylights; Vaulted ceilings; Water heater in closet
- Laundry & utility: Washer; Dryer
Neighborhood map
What this means for you Summary
Snapshot
- This is a 3-bed/2.0-bath single-family listed at $629k.
Deal economics
- At list price, monthly cash flow is $-2k ($-24k/yr) — negative.
- To cash-flow at today's rent, offer at most $282k (55.2% below list).
- To meet the 1% rule (rent ≥ 1% of price), the offer needs to be $255k (59.4% below list).
- Recommended offer: $255k (59.4% below list) — sets the bar for 1% rule.
Location & tenants
- Location reads 57/100 on livability (#527 in WA) — a working-class tenant base; expect higher turnover. Strengths: employment A; Watch: health & safety D, amenities F, commute F.
- Sedro-Woolley School District (suburban): math 47% / reading 58% proficiency, ranked #117 of 291 in WA (top 40%) — acceptable for families but not a draw, mixed tenant base, ~2y average lease.
- Zoned schools: Samish Elementary School (176 students, 49% FRL); Cascade Middle School (697 students, 58% FRL); Sedro Woolley Senior High School (1,276 students, 49% FRL).
- Market conditions: 231 active listings in the ZIP; solid renter incomes; 561 units permitted in Skagit County in 2024 (270 in 5+ unit buildings).
- This rent runs 33% of the median local income ($93k/yr) — at the standard rent-burdened threshold; future hikes will face affordability resistance.
Forward outlook
- In year one you build about $67k of equity ($4k loan paydown + $63k appreciation (10.0% local appreciation)).
- Skagit County population projected at +11% by 2050 — modest demand growth; plan on rents tracking national, not racing it.
- By year 2, paydown + projected appreciation supports a ~$108k cash-out refi (75% LTV) — recoverable capital for the next deal without selling this one.
Negotiation context
- Only 7 days on market — expect competitive offers; lowballing is unlikely to land.
Questions for the listing agent
- What do current leases actually rent for vs. the listed asking? Can we see a recent rent roll and the last 12 months of T-12 income?
- Built in 1979 — when were the roof, HVAC, electrical panel, plumbing, and water heater last replaced?
- Is there a deadline driving the sale (1031 exchange, divorce, estate, relocation)? That informs how much negotiation room exists.
- Schools are F-rated, which usually means shorter tenancies and higher turnover. Who's the typical renter profile here, and what's been the actual vacancy rate?
- The area grade is low — what's the realistic commute time and amenity access for the typical tenant pool here? Any planned neighborhood developments (good or bad) we should know about?
- What's the average days-on-market for RENTAL listings here right now (not sales)? A rising rental-DOM trend means longer vacancies and softer asking-rent achievability than the comps imply.
- What's the recent tenant-quality profile in this submarket — average credit score on applications, eviction rate, late-payment / NSF rate, and stable-employment percentage? A property-management company in the area should have these aggregated.
- How much new for-sale + rental construction is in the pipeline within 1–3 miles? Heavy new supply typically softens prices + rents 12–24 months out; constrained supply supports both.
Investment metrics
- 1% rule
- 0.41% ✗
- Cap rate
- 2.54%
- Cash-on-cash
- -13.40%
- DSCR
- 0.40
- GRM
- 20.5
CMA / ARV
- ARV (median comp)
- $688,218
- List price
- $629,000
- Delta
- -8.60%
- Verdict
- FAIR
- Comps
- 6 within 1.0 mi
Show comp detail 2 sales within ~0.75 mi
| Address | Dist | Beds/Ba | Sqft | Sold | Price | $/sf | Match |
|---|---|---|---|---|---|---|---|
| 20512 Prairie Rd | 0.00mi | 3/2.0 | 1,728 (-3%) | 0mo | $600,000 | $347 | 95 |
| 20063 Park Ridge Ln | 0.70mi | 3/2.5 | 1,851 (+4%) | 6mo | $910,000 | $492 | 54 |
Match score weights: distance 35% · size 25% · config 20% · recency 20%. Top-matched comps best support the ARV.
Projected returns pro-forma
10.0% appreciation · 3.0% rent growth · sell at horizon
- IRR
- 14.9%
- Equity multiple
- 2.23×
- Total profit
- $217,107
- Equity at exit
- $566,653
- IRR
- 14.7%
- Equity multiple
- 5.19×
- Total profit
- $737,492
- Equity at exit
- $1,222,009
Cash invested: $176,120 (down + closing). Projections, not guarantees.
Landlord ↔ Tenant lean methodology
- Overall (STATE)
- 28 Tenant-Leaning
- State Washington
- 28 Tenant-Leaning · D+8
- County
- — inherits STATE
- City
- — inherits STATE
ZIP-level market 98284
- Home prices YoY
- 3.5%
- Active inventory
- 231
- Price-to-rent
- 20.5×
Monthly cashflow live
- Estimated rent
- $2,551 medium interval (Pro) →
- Mortgage (P&I)
- −$3,299
- Tax from tax record
- −$422 /mo · $5,062/yr
- Insurance
- −$262
- HOA
- −$0
- Vacancy / Maint / Mgmt
- −$536
- Net cashflow
- $-1,967
Break-even live
Sensitivity live
| Price | -10% $-1,611 | -5% $-1,789 | +0% $-1,967 | +5% $-2,145 | +10% $-2,323 |
|---|---|---|---|---|---|
| Rent | -10% $-2,169 | -5% $-2,068 | +0% $-1,967 | +5% $-1,866 | +10% $-1,765 |
| Rate | -1.0pp $-1,650 | -0.5pp $-1,807 | base $-1,967 | +0.5pp $-2,130 | +1.0pp $-2,296 |
UW: 25.0% down · 7.5% · 30yr · 1.5% tax · 5.0% vac · 8.0% maint · 8.0% mgmt
Financing live
Cash to close
- Down payment
- $157,250
- Closing costs
- $18,870
- Reserves months
- —
- Total cash needed
- —
Loan-product check · same deal, 3 products live
Conventional
25% down · 7.5% · 30yr
- Down + closing
- —
- Monthly P&I
- —
- Monthly cashflow
- —
- DSCR
- —
- Eligible?
- —
Personal DTI + credit; lowest rate.
DSCR
20% down · 8.5% · 30yr
- Down + closing
- —
- Monthly P&I
- —
- Monthly cashflow
- —
- DSCR
- —
- Eligible?
- —
No personal income docs; deal must DSCR.
Hard money
10% down · 12.0% · 12mo
- Down + closing
- —
- Monthly P&I
- —
- Monthly cashflow
- —
- DSCR
- —
- Eligible?
- —
Short-term bridge; refi at stabilization.
Listing history 3 events
-
2026-06-05status $629,000 Pending 7 DOM
-
2026-05-09status Pending - Backup Offer Requested
-
2026-05-01$629,000 Active
ⓘ Source: listings_history table (triggers on properties + properties_extension) + one-shot
backfill from property_details.listing_events for pre-trigger history.
Tax reassessment forecast WA · Resets to sale price
- Current annual tax
- $5,062 · $422/mo
- Projected year-2 tax
- $6,164 · $514/mo
- Expected delta
- +$1,102/yr (+$92/mo · 21.8%)
ⓘ Screening estimate from a state-policy table — verify with the county assessor before closing.
Climate risk First Street
- Flood 1/10 Low 0% chance over 30 yrs
- Wildfire 3/10 Moderate
- Heat 2/10 Low 8 d/yr ≥84°F today · 19 d/yr by 30 yrs out
- Wind 1/10 Low
- Air quality 6/10 Major 9 unhealthy d/yr today · 9 by 30 yrs out
Nearby sold comps map
Loading sold comps map…
Walkable amenities ~0.75 mi
Loading nearby amenities…
Taxation est. · year 1
- Rental income
- $30,615
- − Mortgage interest
- −$35,234
- − Property taxes
- −$5,062
- − Insurance
- −$3,145
- − Repairs & maintenance
- −$2,449
- − Management
- −$2,449
- − Depreciation
- −$18,298
- Taxable loss
- −$36,022
- Est. tax savings @ 24.0%
- +$8,645
- After-tax cash flow
- $-14,958/yr
For passive investors: Depreciation is non-cash, so a rental often shows a tax loss while cash-flowing — sheltering income. Rental losses are passive: they offset passive income freely, and up to $25,000/yr can offset ordinary (W-2) income if you actively participate and your MAGI is under $100k (phasing out to $0 by $150k); unused losses carry forward. On sale, claimed depreciation is recaptured at up to 25%, and gains may owe capital-gains tax (a 1031 exchange can defer both). Figures are a year-1 estimate at your 24.0% rate — not tax advice; consult a CPA.
Schools (NCES district)
- District
- Sedro-Woolley School District
- NCES district ID
- 5307740
- Math proficiency
- 47% ▼ -2.00%
- Reading proficiency
- 58% ▬ 0.00%
- Median HH income
- $57,385
- Composite
- 47.45/100
- National rank
- #5005
- State rank
- #117 of 291 in WA
Livability — Alger
- Score
- 57/100
- State rank
- #527
- US rank
- #21801
Category grades
Schools grade is shown separately in the Schools card above.
Census & demographics
- County
- Skagit County · 118,108 people
- Metro
- Mount Vernon-Anacortes, WA
- Population (ZIP)
- 27,835
- Household income
- $93,006
- Rent vs Own
- Severe rent burden
- 502.0
Population outlook (Skagit County) Hauer SSP2
- Today (2025)
- 131,498 people
- By 2030
- 135,556 · +3.1%
- By 2040
- 141,717 · +7.8%
- By 2050
- 145,714 · +10.8%
- By 2075
- 152,201 · +15.7%
- By 2100
- 147,980 · +12.5%
Race, ethnicity, and origin ACS 2023
- Neighborhood character
- Predominantly White (76%)
- Race & ethnicity
- White 76% Hispanic / Latino 14% Two or more races 8% Asian 2% Native American 1%
- Hispanic origin (detail)
- Mexican 12% Puerto Rican 1%
- Common ancestry
- Portuguese 6% Slovak 4% Italian 3%
- Foreign-born
- 5% · Canada, China
- Languages at home
- 88% English-only · Spanish 10% German/W. Germanic 1%
Political lean MEDSL · Skagit
- 2024 margin
- Lean D (+8.9) · D 52.9% · R 44.0% · Other 3.0%
- 2008→2024 swing
- -0.7pp no change · 2008: 9.6pp · 2024: 8.9pp
- All cycles
- 2024: D+8.9 2020: D+7.5 2016: D+3.2 2012: D+5.8 2008: D+9.6
Not yet ingested
- Civics
- —
Market trends
- HPI YoY
- ▲ 43.42%
- Current HPI
- 1280.83
- Rent YoY
- —
- Metro
- Mount Vernon-Anacortes, WA
- State GDP YoY
- ▲ 4.65%
- F500 in state
- 22
Industry mix (Fortune 500 HQ in WA)
| Industry | F500 HQs | Revenue |
|---|---|---|
| Retail | 2 | $269B |
|
||
| Technology / Retail | 1 | $638B |
|
||
| Technology | 1 | $245B |
|
||
| Telecommunications | 1 | $38B |
|
||
| Food / Beverage | 1 | $36B |
|
||
| Automotive / Trucks | 1 | $34B |
|
||
Price history
-4.6% since first listed6 events — show timeline
- 2026-06-09 Delisted — NWMLS as Distributed by MLS Grid
- 2026-06-09 Sold (Public Records) $600,280 Public Records
- 2026-06-09 Sold (MLS) $600,000 NWMLS as Distributed by MLS Grid
- 2026-06-04 Pending — NWMLS as Distributed by MLS Grid
- 2026-05-09 Pending — NWMLS as Distributed by MLS Grid
- 2026-05-01 Listed $629,000 NWMLS as Distributed by MLS Grid
Property tax history
+3.8%/yrLatest (2026): $5,062 · +2.4% YoY. Source: county tax records.
Cash-flow waterfall
monthlySold comps — $/sqft
last 12 mo · ≤1 miLoading sold comps…