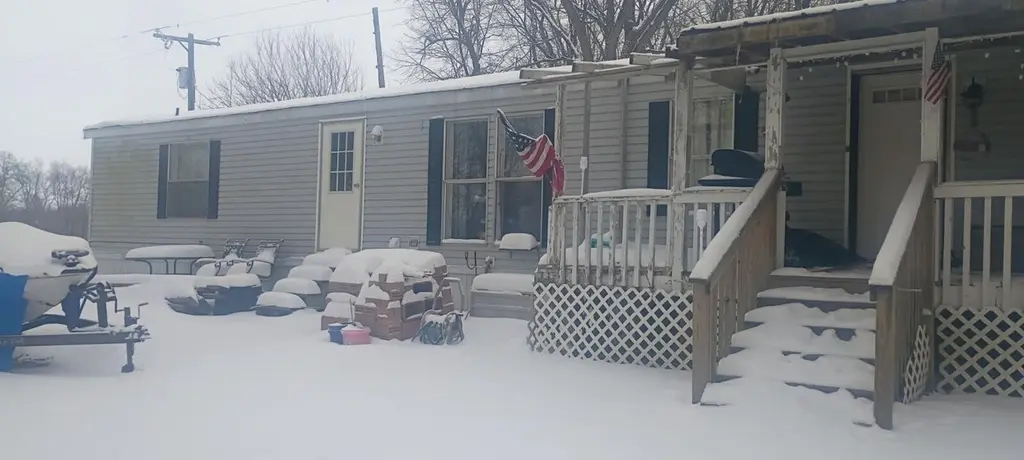
4450 22 Mile Rd · Homer, MI
Flood risk 1/10 · Minimal
- FEMA flood zone
- X (unshaded)
- Chance of flooding over 30 yrs
- 0.0%
- Est. flood insurance / yr
- $473 – $860
Fire risk 1/10 · Minimal
- Est. fire insurance / yr
- $784 – $1,456
Heat risk 2/10 · Minimal
- Hot days now (above 98°F)
- 7 days/yr
- Hot days in 30 yrs
- 15 days/yr
Wind risk 2/10 · Minimal
- Chance of severe wind over 30 yrs
- —
Air-quality risk 2/10 · Minimal
- Unhealthy air days now
- 0 days/yr
- Unhealthy air days in 30 yrs
- 1 days/yr
Risk factors via First Street. Map © Google.
Why this score? — see what drove the B grade
The composite is a weighted blend of 9 inputs, each scored 0–100. Each bar is that input's sub-score; the figure is the points it added to the 100-point composite (weight × sub-score).
- Cash flow +30.0/30.0
- 1% rule +10.0/10.0
- DSCR +10.0/10.0
- ARV discount +7.5/15.0
- Appreciation +4.8/10.0
- Livability +3.5/5.0
- Rent growth +2.5/5.0
- Condition / age +2.5/5.0
- Schools +2.0/10.0
$45,500
🖨 Deal sheet (PDF) 📄 Offer letter ✓ Due diligence
Key facts
- 0.5 acre lot
- Built 1998
- Listed 33 days
Property features AI
Exterior
- Utilities: Well water
- Home design: Residential property; Other architectural style
- Construction: Built in 1998; Aluminum siding
- Exterior features: Half-acre lot
Interior
- Kitchen: Kitchen about 10 x 10
- Bedrooms: Primary bedroom about 12 x 12; Primary bedroom about 10 x 9
- Bathrooms: 2 full bathrooms; Primary bathroom about 8 x 5; Bathroom about 7 x 5
- Heating & cooling: Forced air heating; Has central cooling
- Interior features: Total of 5 rooms; Crawl space basement
Neighborhood map
What this means for you Summary
Snapshot
- This is a 2-bed/1.5-bath single-family listed at $46k.
Deal economics
- At list price, monthly cash flow is $416 ($5k/yr) — positive.
- The deal already cash-flows at list — no discount required.
- Meets the 1% rule at list price ($925 rent vs $46k).
- Recommended offer: $44k (3.0% below list) — sets the bar for market timing.
Location & tenants
- Location reads 69/100 on livability (#343 in MI) — a middle-class / working-renter tenant base. Strengths: cost of living A+, housing A+, crime A; Watch: amenities F, commute F, employment F.
- Homer Community School District (rural): math 18% / reading 29% proficiency, ranked #437 of 540 in MI (top 81%) — low school quality limits family demand, transient renter base, plan for 1-2y turnover.
- Zoned schools: Lillian Fletcher Elem School (math 22% / reading 37%, grade F, #866 of 1,397 statewide, top 65%, 356 students, 65% FRL); Homer Middle School (math 16% / reading 25%, grade F, #418 of 493 statewide, top 85%, 264 students, 57% FRL); Homer Community High School (math 22% / reading 32%, grade F, #462 of 713 statewide, top 66%, 290 students, 54% FRL).
- Market conditions: 24 active listings in the ZIP; 132 units permitted in Calhoun County in 2024 (0 in 5+ unit buildings).
Forward outlook
- In year one you build about $89 of equity ($315 loan paydown + $-226 appreciation (-0.5% local appreciation)).
- Calhoun County population projected at -16% by 2050 — secular population decline; favor cash flow + early exit over multi-decade hold.
- At projected returns (-0.5% appreciation + 3.0% rent growth), your $13k cash investment doubles in ~3 years — after that, you're playing with house money.
Negotiation context
- It's been on market 33 days — a 3% lower offer ($44k) is reasonable based on typical stale-listing flexibility.
- 8 sale attempts since 6y ago; this cycle's ask has dropped $18k (28%) from the opening price — seller is motivated, your offer sets the floor, not the list.
Questions for the listing agent
- It's been on market 33 days. Have you received any prior offers? Is the seller open to a 3% concession, seller financing, or rate buy-down credit?
- Is there a deadline driving the sale (1031 exchange, divorce, estate, relocation)? That informs how much negotiation room exists.
- Schools are F-rated, which usually means shorter tenancies and higher turnover. Who's the typical renter profile here, and what's been the actual vacancy rate?
- What's the average days-on-market for RENTAL listings here right now (not sales)? A rising rental-DOM trend means longer vacancies and softer asking-rent achievability than the comps imply.
- What's the recent tenant-quality profile in this submarket — average credit score on applications, eviction rate, late-payment / NSF rate, and stable-employment percentage? A property-management company in the area should have these aggregated.
- How much new for-sale + rental construction is in the pipeline within 1–3 miles? Heavy new supply typically softens prices + rents 12–24 months out; constrained supply supports both.
Investment metrics
- 1% rule
- 2.03% ✓
- Cap rate
- 17.27%
- Cash-on-cash
- 39.19%
- DSCR
- 2.74
- GRM
- 4.1
CMA / ARV
- ARV (on-the-fly)
- $153,216
- Comps found
- 1
Show comp detail 1 sale within ~0.75 mi
| Address | Dist | Beds/Ba | Sqft | Sold | Price | $/sf | Match |
|---|---|---|---|---|---|---|---|
| 22457 P Dr S | 0.58mi | 3/1.0 (+1) | 1,203 (+4%) | 18mo | $160,000 | $133 | 44 |
Match score weights: distance 35% · size 25% · config 20% · recency 20%. Top-matched comps best support the ARV.
Projected returns pro-forma
-0.5% appreciation · 3.0% rent growth · sell at horizon
- IRR
- 39.4%
- Equity multiple
- 2.89×
- Total profit
- $24,133
- Equity at exit
- $12,093
- IRR
- 43.1%
- Equity multiple
- 5.71×
- Total profit
- $60,003
- Equity at exit
- $13,671
Cash invested: $12,740 (down + closing). Projections, not guarantees.
Landlord ↔ Tenant lean methodology
- Overall (STATE)
- 62 Landlord-Friendly
- State Michigan
- 62 Landlord-Friendly · EVEN
- County
- — inherits STATE
- City
- — inherits STATE
ZIP-level market 49245
- Home prices YoY
- -0.1%
- Active inventory
- 24
- Price-to-rent
- 4.1×
Monthly cashflow live
- Estimated rent
- $925 medium interval (Pro) →
- Mortgage (P&I)
- −$239
- Tax est. 1.5%
- −$57 /mo · $682/yr
- Insurance
- −$19
- HOA
- −$0
- Vacancy / Maint / Mgmt
- −$194
- Net cashflow
- $416
Break-even live
Sensitivity live
| Price | -10% $448 | -5% $432 | +0% $416 | +5% $400 | +10% $385 |
|---|---|---|---|---|---|
| Rent | -10% $343 | -5% $380 | +0% $416 | +5% $453 | +10% $489 |
| Rate | -1.0pp $439 | -0.5pp $428 | base $416 | +0.5pp $404 | +1.0pp $392 |
UW: 25.0% down · 7.5% · 30yr · 1.5% tax · 5.0% vac · 8.0% maint · 8.0% mgmt
Financing live
Cash to close
- Down payment
- $11,375
- Closing costs
- $1,365
- Reserves months
- —
- Total cash needed
- —
Loan-product check · same deal, 3 products live
Conventional
25% down · 7.5% · 30yr
- Down + closing
- —
- Monthly P&I
- —
- Monthly cashflow
- —
- DSCR
- —
- Eligible?
- —
Personal DTI + credit; lowest rate.
DSCR
20% down · 8.5% · 30yr
- Down + closing
- —
- Monthly P&I
- —
- Monthly cashflow
- —
- DSCR
- —
- Eligible?
- —
No personal income docs; deal must DSCR.
Hard money
10% down · 12.0% · 12mo
- Down + closing
- —
- Monthly P&I
- —
- Monthly cashflow
- —
- DSCR
- —
- Eligible?
- —
Short-term bridge; refi at stabilization.
Listing history 46 events
-
2026-06-07statusdays on market $45,500 Pending 33 DOM
-
2026-06-05days on market $45,500 Active 31 DOM
-
2026-06-04days on market $45,500 Active 29 DOM
-
2026-06-02days on market $45,500 Active 28 DOM
-
2026-06-01days on market $45,500 Active 27 DOM
-
2026-05-31days on market $45,500 Active 26 DOM
-
2026-05-31days on market $45,500 Active 25 DOM
-
2026-05-22price $47,000
-
2026-05-21price $47,000
-
2026-05-21price $47,000
-
2026-05-05price $49,000
-
2026-05-05$49,000 Active
-
2026-05-05$49,000 Active
-
2026-05-05$63,500 Active
-
2026-04-30historical
-
2026-04-29historical
-
2026-04-23price $63,500
-
2026-04-23price $63,500
-
2026-04-23price $63,500
-
2026-04-17price $64,000
-
2026-04-16price $64,000
-
2026-04-16price $64,000
-
2026-04-10price $65,000
-
2026-04-09price $65,000
-
2026-04-09price $65,000
-
2026-04-02price $67,000
-
2026-04-01price $67,000
-
2026-04-01price $67,000
-
2026-03-25price $70,000
-
2026-03-24price $70,000
-
2026-03-24price $70,000
-
2026-03-19price $72,000
-
2026-03-18price $72,000
-
2026-03-18price $72,000
-
2026-03-04price $77,000
-
2026-03-03price $77,000
-
2026-03-03price $77,000
-
2026-02-18$79,000 Active
-
2026-02-18$79,000 Active
-
2020-12-23soldstatus $45,000 Sold
-
2020-12-23soldstatus $45,000 Sold
-
2020-12-11status Pending
-
2020-12-11historical
-
2020-11-30$59,900
-
2020-11-30$59,900 Active
-
2020-11-30$59,900
ⓘ Source: listings_history table (triggers on properties + properties_extension) + one-shot
backfill from property_details.listing_events for pre-trigger history.
Climate risk First Street
- Flood 1/10 Low FEMA zone X (unshaded) · 0% chance over 30 yrs
- Wildfire 1/10 Low
- Heat 2/10 Low 7 d/yr ≥98°F today · 15 d/yr by 30 yrs out
- Wind 2/10 Low
- Air quality 2/10 Low 0 unhealthy d/yr today · 1 by 30 yrs out
Nearby sold comps map
Loading sold comps map…
Walkable amenities ~0.75 mi
Loading nearby amenities…
Taxation est. · year 1
- Rental income
- $11,097
- − Mortgage interest
- −$2,549
- − Property taxes
- −$682
- − Insurance
- −$228
- − Repairs & maintenance
- −$888
- − Management
- −$888
- − Depreciation
- −$1,324
- Taxable income
- $4,539
- Est. tax owed @ 24.0%
- −$1,089
- After-tax cash flow
- $3,904/yr
For passive investors: Depreciation is non-cash, so a rental often shows a tax loss while cash-flowing — sheltering income. Rental losses are passive: they offset passive income freely, and up to $25,000/yr can offset ordinary (W-2) income if you actively participate and your MAGI is under $100k (phasing out to $0 by $150k); unused losses carry forward. On sale, claimed depreciation is recaptured at up to 25%, and gains may owe capital-gains tax (a 1031 exchange can defer both). Figures are a year-1 estimate at your 24.0% rate — not tax advice; consult a CPA.
Schools (NCES district)
- District
- Homer Community School District
- NCES district ID
- 2618540
- Math proficiency
- 18% ▼ -3.00%
- Reading proficiency
- 29% ▼ -3.00%
- Median HH income
- $42,922
- Composite
- 20.1/100
- National rank
- #8646
- State rank
- #437 of 540 in MI
Livability — Homer
- Score
- 69/100
- State rank
- #343
- US rank
- #8726
Category grades
Schools grade is shown separately in the Schools card above.
Census & demographics
- City population
- 4,472
- Population (ZIP)
- 4,472
Population outlook (Calhoun County) Hauer SSP2
- Today (2025)
- 130,157 people
- By 2030
- 126,691 · -2.7%
- By 2040
- 118,517 · -8.9%
- By 2050
- 109,855 · -15.6%
- By 2075
- 90,486 · -30.5%
- By 2100
- 70,766 · -45.6%
Race, ethnicity, and origin ACS 2023
- Neighborhood character
- Predominantly White (94%)
- Race & ethnicity
- White 94% Two or more races 3% Hispanic / Latino 2%
- Common ancestry
- Romanian 4% Slovak 2% Iranian 2%
- Foreign-born
- 0%
- Languages at home
- 95% English-only · German/W. Germanic 4% Spanish 1%
Political lean MEDSL · Calhoun
- 2024 margin
- R (+14.1) · D 42.3% · R 56.4% · Other 1.3%
- 2008→2024 swing
- -23.4pp toward R · 2008: 9.4pp · 2024: -14.1pp
- All cycles
- 2024: R+14.1 2020: R+11.1 2016: R+12.5 2012: D+1.6 2008: D+9.4
Not yet ingested
- Civics
- —
Market trends
- HPI YoY
- ▼ -0.50%
- Current HPI
- 325.4541
- Rent YoY
- —
- Metro
- —
- State GDP YoY
- ▲ 1.37%
- F500 in state
- 28
Industry mix (Fortune 500 HQ in MI)
| Industry | F500 HQs | Revenue |
|---|---|---|
| Automotive Parts | 3 | $48B |
|
||
| Automotive | 2 | $372B |
|
||
| Chemicals | 1 | $45B |
|
||
| Automotive Retail | 1 | $29B |
|
||
| Healthcare / Medical Devices | 1 | $23B |
|
||
| Automotive Technology | 1 | $20B |
|
||
Price history
-21.5% since first listed39 events — show timeline
- 2026-05-22 Price Changed $47,000 MiRealSource-MiMLS
- 2026-05-21 Price Changed $47,000 REALCOMP
- 2026-05-21 Price Changed $47,000 SW Michigan MLS
- 2026-05-05 Price Changed $49,000 SW Michigan MLS
- 2026-05-05 Listed $63,500 SW Michigan MLS
- 2026-05-05 Listed $49,000 REALCOMP
- 2026-05-05 Listed $49,000 MiRealSource-MiMLS
- 2026-04-30 Listing Removed — MiRealSource-MiMLS
- 2026-04-29 Listing Removed — REALCOMP
- 2026-04-23 Price Changed $63,500 MiRealSource-MiMLS
- 2026-04-23 Price Changed $63,500 REALCOMP
- 2026-04-23 Price Changed $63,500 SW Michigan MLS
- 2026-04-17 Price Changed $64,000 MiRealSource-MiMLS
- 2026-04-16 Price Changed $64,000 REALCOMP
- 2026-04-16 Price Changed $64,000 SW Michigan MLS
- 2026-04-10 Price Changed $65,000 MiRealSource-MiMLS
- 2026-04-09 Price Changed $65,000 REALCOMP
- 2026-04-09 Price Changed $65,000 SW Michigan MLS
- 2026-04-02 Price Changed $67,000 MiRealSource-MiMLS
- 2026-04-01 Price Changed $67,000 REALCOMP
- 2026-04-01 Price Changed $67,000 SW Michigan MLS
- 2026-03-25 Price Changed $70,000 MiRealSource-MiMLS
- 2026-03-24 Price Changed $70,000 REALCOMP
- 2026-03-24 Price Changed $70,000 SW Michigan MLS
- 2026-03-19 Price Changed $72,000 MiRealSource-MiMLS
- 2026-03-18 Price Changed $72,000 REALCOMP
- 2026-03-18 Price Changed $72,000 SW Michigan MLS
- 2026-03-04 Price Changed $77,000 MiRealSource-MiMLS
- 2026-03-03 Price Changed $77,000 REALCOMP
- 2026-03-03 Price Changed $77,000 SW Michigan MLS
- 2026-02-18 Listed $79,000 REALCOMP
- 2026-02-18 Listed $79,000 MiRealSource-MiMLS
- 2020-12-23 Sold (MLS) $45,000 SW Michigan MLS
- 2020-12-23 Sold (MLS) $45,000 REALCOMP
- 2020-12-11 Pending — SW Michigan MLS
- 2020-12-11 Listing Removed — REALCOMP
- 2020-11-30 Listed $59,900 MiRealSource-MiMLS
- 2020-11-30 Listed $59,900 SW Michigan MLS
- 2020-11-30 Listed $59,900 REALCOMP
Cash-flow waterfall
monthlySold comps — $/sqft
last 12 mo · ≤1 miLoading sold comps…