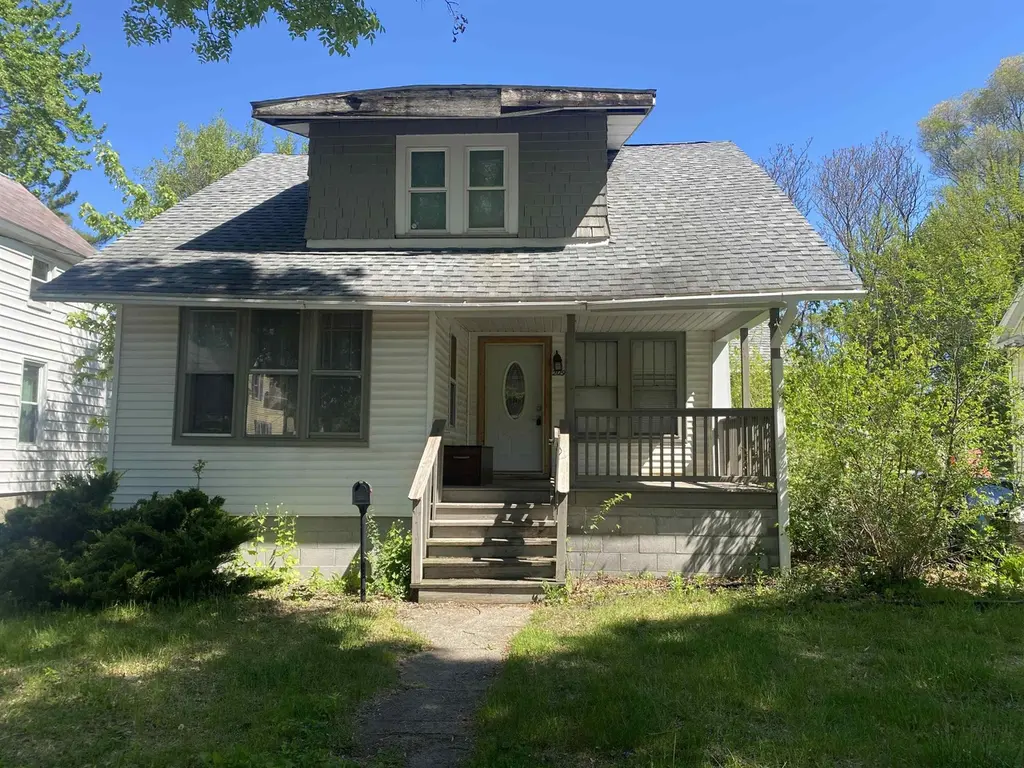
2129 2nd St · Bay City, MI
Flood risk 4/10 · Minor
- FEMA flood zone
- X (unshaded)
- Chance of flooding over 30 yrs
- 0.22%
- Est. flood insurance / yr
- $473 – $860
Fire risk 1/10 · Minimal
- Est. fire insurance / yr
- $784 – $1,456
Heat risk 2/10 · Minimal
- Hot days now (above 97°F)
- 7 days/yr
- Hot days in 30 yrs
- 14 days/yr
Wind risk 1/10 · Minimal
- Chance of severe wind over 30 yrs
- —
Air-quality risk 2/10 · Minimal
- Unhealthy air days now
- 1 days/yr
- Unhealthy air days in 30 yrs
- 2 days/yr
Risk factors via First Street. Map © Google.
Why this score? — see what drove the B- grade
The composite is a weighted blend of 9 inputs, each scored 0–100. Each bar is that input's sub-score; the figure is the points it added to the 100-point composite (weight × sub-score).
- Cash flow +30.0/30.0
- 1% rule +10.0/10.0
- DSCR +10.0/10.0
- ARV discount +7.5/15.0
- Livability +3.4/5.0
- Schools +2.8/10.0
- Rent growth +2.5/5.0
- Condition / age +2.5/5.0
- Appreciation +0.0/10.0
$57,900
🖨 Deal sheet 📄 Offer letter ✓ Due diligence
Listing remarks MLS
Charming Bay City Bungalow! This lovely 4 bedroom 2 bath home is just waiting for some finishing touches. Hardwood floors and original woodwork throughout! Large basement just waiting to be finished and a super long 180 foot yard make this home an entertainer’s dream. A large detached 2 car garage would also make an awesome man-cave, she-shed or workshop. .. So many possibilities! Located very close to beautiful Carroll Park and right around the corner from the rail-trail will keep you active and entertained all year!
Key facts
- Updated electrical
- Vinyl siding
- Updated plumbing
Tags
Property features AI
Exterior
- Parking: Detached 2-car garage (18 x 20); Paved driveway
- Utilities: Public water; Public sanitary sewer; Natural gas service; Gas water heater; Electric service (standard city/paved street access)
- Home design: Residential property; 1 1/2-story structure; Built in 1900
- Construction: Basement foundation
- Exterior features: Vinyl siding; Fenced yard; Porch; Sidewalks; Street lights; Deep lot (150+ ft); City limits location; Road frontage
Interior
- Kitchen: Kitchen on the first floor (11 x 10); Ceramic floor in the kitchen
- Bedrooms: First-floor bedroom; Second-floor bedroom (13 x 12, wood flooring); Second-floor bedroom (12 x 10, carpet); First-floor bedroom (width 10, wood flooring); First-floor bedroom (10 x 10, carpet)
- Flooring: Wood flooring in living room, dining room, and multiple bedrooms; Carpet in some bedrooms; Ceramic flooring in at least one bathroom and the kitchen
- Bathrooms: Main floor full bathroom; Two full bathrooms (total)
- Heating & cooling: Forced air heating; Ceiling fan(s) for cooling; Gas water heater; Natural gas heat/fuel
- Interior features: Dishwasher; Range/Oven
- Laundry & utility: Laundry located in the basement; Basement present (full, block)
Neighborhood map
What this means for you Summary
Snapshot
- This is a 4-bed/1.0-bath single-family listed at $58k.
Deal economics
- At list price, monthly cash flow is $630 ($8k/yr) — positive.
- The deal already cash-flows at list — no discount required.
- Meets the 1% rule at list price ($1k rent vs $58k).
- Recommended offer: $57k (1.5% below list) — sets the bar for market timing.
- Cap rate 19.3% vs local median 5.5% in Bay City — top-decile yield for the area; either an underpriced asset or a hidden risk that comps aren't pricing in. Stress-test before assuming the spread holds.
Location & tenants
- Location reads 68/100 on livability (#360 in MI) — a middle-class / working-renter tenant base. Strengths: cost of living A+, housing A+, health & safety A+; Watch: schools D+, amenities D, crime F.
- Bay City School District (urban): math 27% / reading 40% proficiency, ranked #317 of 540 in MI (top 59%) — families likely to look elsewhere, expect single-tenant / working-renter base with shorter leases.
- Market conditions: 148 active listings in the ZIP; 39 units permitted in Bay County in 2024 (0 in 5+ unit buildings).
- This rent runs 34% of the median local income ($51k/yr) — at the standard rent-burdened threshold; future hikes will face affordability resistance.
Forward outlook
- Local home prices are declining (-3.0%/yr); year-one equity from $400 of loan paydown is wiped out by about $2k of value loss. Plan a longer hold.
- Bay County population projected at -21% by 2050 — secular population decline; favor cash flow + early exit over multi-decade hold.
- At projected returns (-3.0% appreciation + 3.0% rent growth), your $16k cash investment doubles in ~3 years — after that, you're playing with house money.
Negotiation context
- It's been on market 21 days — a 2% lower offer ($57k) is reasonable based on typical stale-listing flexibility.
- 11 sale attempts since 22y ago; this cycle's ask has dropped $7k (11%) from the opening price — seller is motivated, your offer sets the floor, not the list.
- Current owner paid $45k; 29% above their basis — modest negotiation headroom, anchor on the comps not their cost.
Risks & watch-outs
- Watch-outs: property tax is 3.8% of price; built in 1900 — expect roof / HVAC / electrical / plumbing capex.
Questions for the listing agent
- Built in 1900 — when were the roof, HVAC, electrical panel, plumbing, and water heater last replaced?
- Property tax is high relative to price — has the assessment been appealed recently, and will the sale trigger a re-assessment?
- Is there a deadline driving the sale (1031 exchange, divorce, estate, relocation)? That informs how much negotiation room exists.
- Schools are D-rated, which usually means shorter tenancies and higher turnover. Who's the typical renter profile here, and what's been the actual vacancy rate?
- Crime grade is F in this area — have there been break-ins, vandalism, or insurance claims at this property in the last 3 years? What carrier currently insures it and at what premium?
- What's the average days-on-market for RENTAL listings here right now (not sales)? A rising rental-DOM trend means longer vacancies and softer asking-rent achievability than the comps imply.
- What's the recent tenant-quality profile in this submarket — average credit score on applications, eviction rate, late-payment / NSF rate, and stable-employment percentage? A property-management company in the area should have these aggregated.
- How much new for-sale + rental construction is in the pipeline within 1–3 miles? Heavy new supply typically softens prices + rents 12–24 months out; constrained supply supports both.
Investment metrics
- 1% rule
- 2.50% ✓
- Cap rate
- 19.34%
- Cash-on-cash
- 46.61%
- DSCR
- 3.07
- GRM
- 3.3
CMA / ARV
- ARV (on-the-fly)
- $136,818
- Comps found
- 12
Show comp detail 12 sales within ~0.75 mi
| Address | Dist | Beds/Ba | Sqft | Sold | Price | $/sf | Match |
|---|---|---|---|---|---|---|---|
| 1539 Park Ave | 0.34mi | 4/1.0 | 1,371 (-1%) | 0mo | $175,000 | $128 | 82 |
| 2122 2nd St | 0.03mi | 4/1.5 | 1,511 (+9%) | 2mo | $140,000 | $93 | 79 |
| 1316 N Trumbull St | 0.14mi | 3/1.5 (-1) | 1,312 (-5%) | 2mo | $118,303 | $90 | 76 |
| 2131 7th St | 0.42mi | 3/1.0 (-1) | 1,436 (+4%) | 6mo | $134,000 | $93 | 64 |
| 714 Nebobish Ave | 0.38mi | 3/2.0 (-1) | 1,288 (-7%) | 4mo | $69,000 | $54 | 59 |
| 608 Woodside Ln | 0.47mi | 3/2.0 (-1) | 1,320 (-4%) | 4mo | $140,000 | $106 | 58 |
| 1500 6th St | 0.57mi | 3/2.5 (-1) | 1,413 (+2%) | 1mo | $128,500 | $91 | 58 |
| 800 Woodside Ln | 0.59mi | 3/1.0 (-1) | 1,450 (+5%) | 8mo | $144,000 | $99 | 53 |
| 407 Harvard St | 0.70mi | 3/1.0 (-1) | 1,447 (+5%) | 6mo | $140,000 | $97 | 49 |
| 2121 7th St | 0.42mi | 3/1.5 (-1) | 1,182 (-14%) | 2mo | $175,000 | $148 | 47 |
| 200 Tuscola Rd | 0.71mi | 3/2.0 (-1) | 1,288 (-7%) | 4mo | $157,500 | $122 | 44 |
| 500 Princeton St | 0.74mi | 3/2.0 (-1) | 1,260 (-9%) | 5mo | $145,000 | $115 | 38 |
Match score weights: distance 35% · size 25% · config 20% · recency 20%. Top-matched comps best support the ARV.
Projected returns pro-forma
-3.0% appreciation · 3.0% rent growth · sell at horizon
- IRR
- 44.0%
- Equity multiple
- 2.90×
- Total profit
- $30,815
- Equity at exit
- $8,633
- IRR
- 50.0%
- Equity multiple
- 5.86×
- Total profit
- $78,845
- Equity at exit
- $5,006
Cash invested: $16,212 (down + closing). Projections, not guarantees.
Landlord ↔ Tenant lean methodology
- Overall (STATE)
- 62 Landlord-Friendly
- State Michigan
- 62 Landlord-Friendly · EVEN
- County
- — inherits STATE
- City
- — inherits STATE
ZIP-level market 48708
- Home prices YoY
- -30.9%
- Active inventory
- 148
- Price-to-rent
- 3.3×
Monthly cashflow live
- Estimated rent
- $1,445 medium interval (Pro) →
- Mortgage (P&I)
- −$304
- Tax from tax record
- −$184 /mo · $2,205/yr
- Insurance
- −$24
- HOA
- −$0
- Vacancy / Maint / Mgmt
- −$303
- Net cashflow
- $630
Break-even live
UW: 25.0% down · 7.5% · 30yr · 1.5% tax · 5.0% vac · 8.0% maint · 8.0% mgmt
Financing live
Cash to close
- Down payment
- $14,475
- Closing costs
- $1,737
- Reserves months
- —
- Total cash needed
- —
Loan-product check · same deal, 3 products live
Conventional
25% down · 7.5% · 30yr
- Down + closing
- —
- Monthly P&I
- —
- Monthly cashflow
- —
- DSCR
- —
- Eligible?
- —
Personal DTI + credit; lowest rate.
DSCR
20% down · 8.5% · 30yr
- Down + closing
- —
- Monthly P&I
- —
- Monthly cashflow
- —
- DSCR
- —
- Eligible?
- —
No personal income docs; deal must DSCR.
Hard money
10% down · 12.0% · 12mo
- Down + closing
- —
- Monthly P&I
- —
- Monthly cashflow
- —
- DSCR
- —
- Eligible?
- —
Short-term bridge; refi at stabilization.
Listing history 40 events
-
2026-06-17status $57,900 Pending 21 DOM
-
2026-06-16days on market $57,900 Active 21 DOM
-
2026-06-15days on market $57,900 Active 20 DOM
-
2026-06-14days on market $57,900 Active 18 DOM
-
2026-06-12days on market $57,900 Active 17 DOM
-
2026-06-09days on market $57,900 Active 14 DOM
-
2026-06-09price $57,900 Active 13 DOM
-
2026-06-08days on market $64,900 Active 13 DOM
-
2026-06-07days on market $64,900 Active 12 DOM
-
2026-06-05days on market $64,900 Active 9 DOM
-
2026-06-03days on market $64,900 Active 8 DOM
-
2026-06-02days on market $64,900 Active 7 DOM
-
2026-06-01days on market $64,900 Active 6 DOM
-
2026-05-31days on market $64,900 Active 5 DOM
-
2026-05-30days on market $64,900 Active 4 DOM
-
2026-05-26$64,900 Active
-
2019-12-02soldstatus $45,000 532-char remark
Show marketing remark (542 chars)
Charming Bay City Bungalow! This lovely 4 bedroom 2 bath home is just waiting for some finishing touches. Hardwood floors and original woodwork throughout! Large basement just waiting to be finished and a super long 180 foot yard make this home an entertainer’s dream. A large detached 2 car garage would also make an awesome man-cave, she-shed or workshop. .. So many possibilities! Located very close to beautiful Carroll Park and right around the corner from the rail-trail will keep you active and entertained all year!
-
2019-12-02soldstatus $45,000 542-char remark
Show marketing remark (542 chars)
Charming Bay City Bungalow! This lovely 4 bedroom 2 bath home is just waiting for some finishing touches. Hardwood floors and original woodwork throughout! Large basement just waiting to be finished and a super long 180 foot yard make this home an entertainer’s dream. A large detached 2 car garage would also make an awesome man-cave, she-shed or workshop. .. So many possibilities! Located very close to beautiful Carroll Park and right around the corner from the rail-trail will keep you active and entertained all year!
-
2019-11-06soldstatus $45,000
-
2019-11-04soldstatus $45,000
-
2019-04-25$49,000 532-char remark
Show marketing remark (542 chars)
Charming Bay City Bungalow! This lovely 4 bedroom 2 bath home is just waiting for some finishing touches. Hardwood floors and original woodwork throughout! Large basement just waiting to be finished and a super long 180 foot yard make this home an entertainer’s dream. A large detached 2 car garage would also make an awesome man-cave, she-shed or workshop. .. So many possibilities! Located very close to beautiful Carroll Park and right around the corner from the rail-trail will keep you active and entertained all year!
-
2019-04-25$49,000 542-char remark
Show marketing remark (542 chars)
Charming Bay City Bungalow! This lovely 4 bedroom 2 bath home is just waiting for some finishing touches. Hardwood floors and original woodwork throughout! Large basement just waiting to be finished and a super long 180 foot yard make this home an entertainer’s dream. A large detached 2 car garage would also make an awesome man-cave, she-shed or workshop. .. So many possibilities! Located very close to beautiful Carroll Park and right around the corner from the rail-trail will keep you active and entertained all year!
-
2019-04-23$49,000
-
2012-03-05soldstatus $17,900
-
2012-03-02soldstatus $17,900
-
2012-03-02soldstatus $17,900
-
2011-12-07$18,900
-
2011-12-07$18,900
-
2011-12-06$18,900
-
2008-01-11soldstatus $94,900
-
2007-08-02soldstatus $58,000
-
2007-06-26$54,500
-
2005-04-15soldstatus $80,560
-
2005-04-10soldstatus $80,560
-
2004-11-08$75,900
-
2004-10-20soldstatus $51,276
-
2004-10-20soldstatus $51,276
-
2004-07-30$54,000
-
2004-07-30$54,000
-
2002-05-15soldstatus $73,500
ⓘ Source: listings_history table (triggers on properties + properties_extension) + one-shot
backfill from property_details.listing_events for pre-trigger history.
Tax reassessment forecast MI · Partial reset (capped growth)
- Current annual tax
- $2,205 · $184/mo
- Projected year-2 tax
- $2,205 · $184/mo
- Expected delta
- $0/yr ($0/mo · 0.0%)
ⓘ Screening estimate from a state-policy table — verify with the county assessor before closing.
Climate risk First Street
- Flood 4/10 Moderate FEMA zone X (unshaded) · 22% chance over 30 yrs
- Wildfire 1/10 Low
- Heat 2/10 Low 7 d/yr ≥97°F today · 14 d/yr by 30 yrs out
- Wind 1/10 Low
- Air quality 2/10 Low 1 unhealthy d/yr today · 2 by 30 yrs out
Nearby sold comps map
Loading sold comps map…
Walkable amenities ~0.75 mi
Loading nearby amenities…
Taxation est. · year 1
- Rental income
- $17,335
- − Mortgage interest
- −$3,243
- − Property taxes
- −$2,205
- − Insurance
- −$290
- − Repairs & maintenance
- −$1,387
- − Management
- −$1,387
- − Depreciation
- −$1,684
- Taxable income
- $7,139
- Est. tax owed @ 24.0%
- −$1,713
- After-tax cash flow
- $5,843/yr
For passive investors: Depreciation is non-cash, so a rental often shows a tax loss while cash-flowing — sheltering income. Rental losses are passive: they offset passive income freely, and up to $25,000/yr can offset ordinary (W-2) income if you actively participate and your MAGI is under $100k (phasing out to $0 by $150k); unused losses carry forward. On sale, claimed depreciation is recaptured at up to 25%, and gains may owe capital-gains tax (a 1031 exchange can defer both). Figures are a year-1 estimate at your 24.0% rate — not tax advice; consult a CPA.
Schools (NCES district)
- District
- Bay City School District
- NCES district ID
- 2604260
- Math proficiency
- 27% ▼ -8.00%
- Reading proficiency
- 40% ▼ -4.00%
- Median HH income
- $43,833
- Composite
- 28.47/100
- National rank
- #6743
- State rank
- #317 of 540 in MI
Livability — Bay City
- Score
- 68/100
- State rank
- #360
- US rank
- #8912
Category grades
Schools grade is shown separately in the Schools card above.
Census & demographics
- Census place
- Bay City, MI
- County
- Bay County · 36,975 people
- City population
- 25,635
- Metro
- Bay City, MI
- Population (ZIP)
- 25,635
- Household income
- $50,518
- Rent vs Own
- Severe rent burden
- 528.0
Population outlook (Bay County) Hauer SSP2
- Today (2025)
- 101,476 people
- By 2030
- 98,152 · -3.3%
- By 2040
- 89,711 · -11.6%
- By 2050
- 80,614 · -20.6%
- By 2075
- 60,544 · -40.3%
- By 2100
- 41,603 · -59.0%
Race, ethnicity, and origin ACS 2023
- Neighborhood character
- Predominantly White (81%)
- Race & ethnicity
- White 81% Hispanic / Latino 11% Two or more races 10% Black 3%
- Hispanic origin (detail)
- Mexican 9%
- Common ancestry
- Romanian 17% Lithuanian 7% Slovak 2%
- Foreign-born
- 2% · Canada, South Korea
- Languages at home
- 96% English-only · Spanish 2% German/W. Germanic 1%
Political lean MEDSL · Bay
- 2024 margin
- R (+14.7) · D 42.0% · R 56.7% · Other 1.3%
- 2008→2024 swing
- -30.0pp toward R · 2008: 15.3pp · 2024: -14.7pp
- All cycles
- 2024: R+14.7 2020: R+11.6 2016: R+12.6 2012: D+6.0 2008: D+15.3
Not yet ingested
- Civics
- —
Market trends
- HPI YoY
- ▼ -82.21%
- Current HPI
- 183.5774
- Rent YoY
- —
- Metro
- Bay City, MI
- State GDP YoY
- ▲ 1.37%
- F500 in state
- 28
Industry mix (Fortune 500 HQ in MI)
| Industry | F500 HQs | Revenue |
|---|---|---|
| Automotive Parts | 3 | $48B |
|
||
| Automotive | 2 | $372B |
|
||
| Chemicals | 1 | $45B |
|
||
| Automotive Retail | 1 | $29B |
|
||
| Healthcare / Medical Devices | 1 | $23B |
|
||
| Automotive Technology | 1 | $20B |
|
||
Price history
-11.7% since first listed25 events — show timeline
- 2026-05-26 Listed $64,900 MiRealSource-MiMLS
- 2019-12-02 Sold (MLS) $45,000 MiRealSource-MiMLS
- 2019-12-02 Sold (MLS) $45,000 REALCOMP
- 2019-11-06 Sold (Public Records) $45,000 Public Records
- 2019-11-04 Sold (MLS) $45,000 MiRealSource-MiMLS
- 2019-04-25 Listed $49,000 MiRealSource-MiMLS
- 2019-04-25 Listed $49,000 REALCOMP
- 2019-04-23 Listed $49,000 MiRealSource-MiMLS
- 2012-03-05 Sold (MLS) $17,900 MiRealSource-MiMLS
- 2012-03-02 Sold (MLS) $17,900 MiRealSource-MiMLS
- 2012-03-02 Sold (MLS) $17,900 REALCOMP
- 2011-12-07 Listed $18,900 MiRealSource-MiMLS
- 2011-12-07 Listed $18,900 REALCOMP
- 2011-12-06 Listed $18,900 MiRealSource-MiMLS
- 2008-01-11 Sold (Public Records) $94,900 Public Records
- 2007-08-02 Sold (MLS) $58,000 MiRealSource-MiMLS
- 2007-06-26 Listed $54,500 MiRealSource-MiMLS
- 2005-04-15 Sold (Public Records) $80,560 Public Records
- 2005-04-10 Sold (MLS) $80,560 MiRealSource-MiMLS
- 2004-11-08 Listed $75,900 MiRealSource-MiMLS
- 2004-10-20 Sold (MLS) $51,276 MiRealSource-MiMLS
- 2004-10-20 Sold (MLS) $51,276 REALCOMP
- 2004-07-30 Listed $54,000 MiRealSource-MiMLS
- 2004-07-30 Listed $54,000 REALCOMP
- 2002-05-15 Sold (Public Records) $73,500 Public Records
Property tax history
-1.4%/yrLatest (2025): $2,205 · -10.1% YoY. Source: county tax records.
Cash-flow waterfall
monthlySold comps — $/sqft
last 12 mo · ≤1 miLoading sold comps…