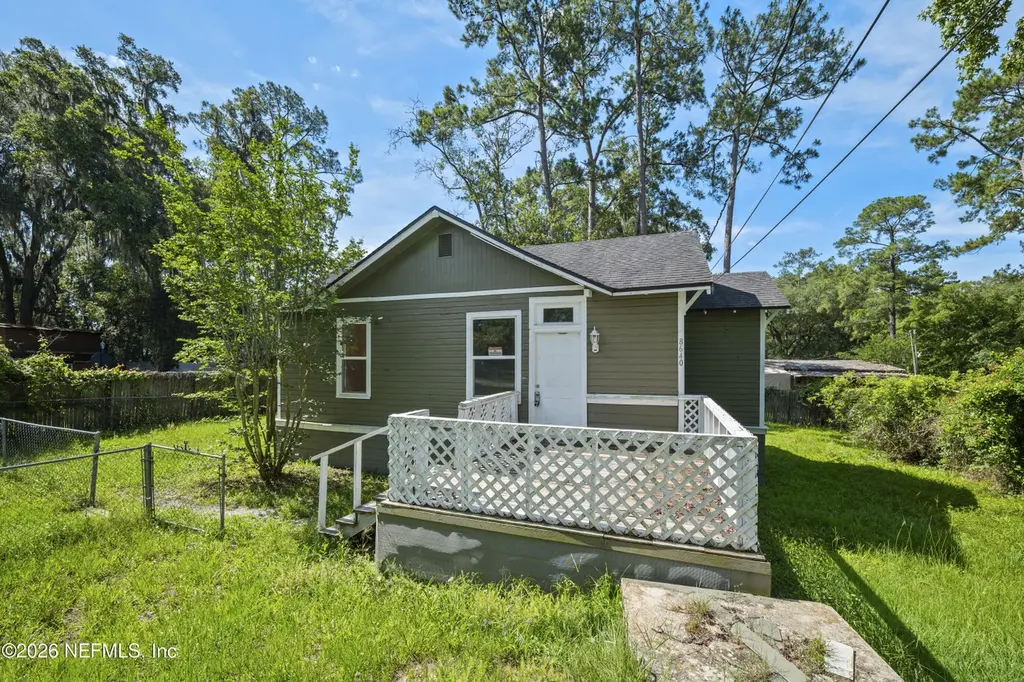
8640 Susie St · Jacksonville, FL
Flood risk 1/10 · Minimal
- FEMA flood zone
- X (unshaded)
- Chance of flooding over 30 yrs
- 0.0%
- Est. flood insurance / yr
- $507 – $1,088
Fire risk 3/10 · Minor
- Est. fire insurance / yr
- $947 – $1,759
Heat risk 8/10 · Major
- Hot days now (above 108°F)
- 7 days/yr
- Hot days in 30 yrs
- 19 days/yr
Wind risk 9/10 · Severe
- Chance of severe wind over 30 yrs
- 99.0%
Air-quality risk 5/10 · Moderate
- Unhealthy air days now
- 6 days/yr
- Unhealthy air days in 30 yrs
- 7 days/yr
Risk factors via First Street. Map © Google.
Why this score? — see what drove the D- grade
The composite is a weighted blend of 9 inputs, each scored 0–100. Each bar is that input's sub-score; the figure is the points it added to the 100-point composite (weight × sub-score).
- Cash flow +13.3/30.0
- ARV discount +4.5/15.0
- Livability +4.2/5.0
- 1% rule +4.0/10.0
- DSCR +4.0/10.0
- Schools +3.9/10.0
- Rent growth +3.0/5.0
- Condition / age +2.5/5.0
- Appreciation +0.0/10.0
$150,000
🖨 Deal sheet 📄 Offer letter ✓ Due diligence
Listing remarks MLS
Welcome to 8640 Susie Street, where 1920s charm meets modern convenience. This delightful 3-bedroom, 1-bathroom home exudes character while offering updated features for today's lifestyle. Step onto the oversized deck, a perfect spot to soak up Florida's year-round sunshine, savor your morning coffee, or enjoy an evening nightcap with friends. Inside, you'll find solid surface flooring throughout and generously sized bedrooms, offering both style and comfort. The heart of the home is the kitchen, boasting high-grade cabinets with ample storage to meet all your needs. It seamlessly flows into the living area, creating an inviting space for gatherings of any size. The convenience of an inside laundry room adds to the home's practicality. Outside, the fully fenced yard provides privacy and a safe space for pets & play. Capturing the perfect blend of historic charm and modern updates, it's ready for the next chapter. Make this historic Bungalow your next home in the heart of JAX. This home qualifies for a $10,000 grant (individuals must also qualify for the program) through Regions MortgageAssist to be used towards a down payment or closing costs.
Key facts
- 9,583 sq ft lot
- Built 1920
- Listed 10 days
Property features AI
Finance
- HOA & community: Not a senior community
Exterior
- Parking: Additional off-street parking
- Utilities: Septic tank; Cable available; Electricity available; Sewer available; Water available
- Home design: Single family residence; One story; Entry level 1; North-facing
- Construction: Wood siding construction; Shingle roof
- Exterior features: Deck; Front porch; Chain link fenced yard; City street frontage; Asphalt road surface
Interior
- Kitchen: Electric range; Refrigerator
- Bedrooms: 3 bedrooms
- Flooring: Carpet; Vinyl; Wood
- Bathrooms: 1 full bathroom
- Heating & cooling: Central heating (electric); Central air (electric)
- Interior features: Ceiling fans; Pantry; Primary bathroom with tub and shower
- Laundry & utility: In-unit laundry with washer hookup and electric dryer hookup; Electric water heater
Neighborhood map
What this means for you Summary
Snapshot
- This is a 3-bed/1.0-bath single-family listed at $150k.
Deal economics
- At list price, monthly cash flow is $0 ($1/yr) — positive.
- The deal already cash-flows at list — no discount required.
- To meet the 1% rule (rent ≥ 1% of price), the offer needs to be $136k (9.5% below list).
- Recommended offer: $136k (9.5% below list) — sets the bar for 1% rule.
- Cap rate 6.3% vs local median 4.0% in Jacksonville — top-decile yield for the area; either an underpriced asset or a hidden risk that comps aren't pricing in. Stress-test before assuming the spread holds.
Location & tenants
- Location reads 83/100 on livability (#50 in FL, #911 nationally) — a professional / high-income tenant draw. Strengths: amenities A+, commute A+, housing A+.
- Duval (urban): math 46% / reading 45% proficiency, ranked #48 of 73 in FL (top 66%) — families likely to look elsewhere, expect single-tenant / working-renter base with shorter leases.
- Zoned schools: Gregory Drive Elementary School (math 26% / reading 23%, grade F, #2,037 of 2,144 statewide, top 96%, 530 students, 76% FRL); Edward H. White High School (math 31% / reading 25%, grade F, #464 of 667 statewide, top 70%, 1,538 students, 64% FRL) — zoned schools average 70% FRL vs 49% district-wide (21 pts higher); higher-poverty schools than district average — tighter screening recommended.
- Zoned-school proficiency averages 26% at this address vs 46% district-wide (-19 pts) — the specific schools serving this property underperform the Duval average; the district grade overstates school quality for this exact location.
- Market conditions: Rents rising (+2.1%/yr); 441 active listings in the ZIP; 24 comparable units currently listed for rent nearby; rentals at typical pace (median 16d on market — plan ~3-4 weeks tenant-placement turnaround); 6,503 units permitted in Duval County in 2024 (1,131 in 5+ unit buildings).
Forward outlook
- Local home prices are declining (-3.0%/yr); year-one equity from $1k of loan paydown is wiped out by about $4k of value loss. Plan a longer hold.
- Duval County population projected at +19% by 2050 — long-run rental-demand tailwind backs the buy-and-hold thesis.
Negotiation context
- Only 10 days on market — expect competitive offers; lowballing is unlikely to land.
- 20 sale attempts since 18y ago with the ask held roughly flat each time — persistent listings suggest the price (not the market) is what's stuck; bring a comps-based counter.
- Current owner paid $94k; list at $150k implies a 59% gain — meaningful room to come down on a strong offer.
Risks & watch-outs
- Watch-outs: built in 1920 — expect roof / HVAC / electrical / plumbing capex.
- Climate carrying-cost: severe wind risk, 99% chance of damaging wind over 30y; extreme-heat days projected 7→19/yr by 2055 (HVAC capex compounding) — expect insurance premiums to compound above CPI over the hold.
Questions for the listing agent
- Built in 1920 — when were the roof, HVAC, electrical panel, plumbing, and water heater last replaced?
- Is there a deadline driving the sale (1031 exchange, divorce, estate, relocation)? That informs how much negotiation room exists.
- Schools are B-rated — typically a magnet for longer-tenancy family renters. What's the average tenant stay here, and is there a school-zone premium baked into asking?
- The area grade is low — what's the realistic commute time and amenity access for the typical tenant pool here? Any planned neighborhood developments (good or bad) we should know about?
- What's the average days-on-market for RENTAL listings here right now (not sales)? A rising rental-DOM trend means longer vacancies and softer asking-rent achievability than the comps imply.
- What's the recent tenant-quality profile in this submarket — average credit score on applications, eviction rate, late-payment / NSF rate, and stable-employment percentage? A property-management company in the area should have these aggregated.
- How much new for-sale + rental construction is in the pipeline within 1–3 miles? Heavy new supply typically softens prices + rents 12–24 months out; constrained supply supports both.
Investment metrics
- 1% rule
- 0.90% ✗
- Cap rate
- 6.29%
- Cash-on-cash
- 0.00%
- DSCR
- 1.00
- GRM
- 9.2
CMA / ARV
- ARV (on-the-fly)
- $140,700
- Comps found
- 6
Show comp detail 6 sales within ~0.75 mi
| Address | Dist | Beds/Ba | Sqft | Sold | Price | $/sf | Match |
|---|---|---|---|---|---|---|---|
| 8506 Susie St | 0.17mi | 3/1.0 | 968 (+3%) | 3mo | $135,000 | $139 | 84 |
| 8322 Mc Glothlin St | 0.42mi | 2/1.0 (-1) | 915 (-2%) | 5mo | $70,000 | $77 | 67 |
| 4914 Old Middleburg Rd N | 0.56mi | 2/1.5 (-1) | 920 (-2%) | 15mo | $138,000 | $150 | 51 |
| 8392 Fury Dr | 0.74mi | 3/2.0 | 960 (+2%) | 14mo | $210,000 | $219 | 46 |
| 8132 Buttercup St | 0.63mi | 2/1.0 (-1) | 864 (-8%) | 11mo | $105,000 | $122 | 43 |
| 5945 Camaro Dr W | 0.63mi | 3/2.0 | 1,040 (+11%) | 20mo | $227,000 | $218 | 32 |
Match score weights: distance 35% · size 25% · config 20% · recency 20%. Top-matched comps best support the ARV.
Projected returns pro-forma
-3.0% appreciation · 2.11% rent growth · sell at horizon
- IRR
- -17.3%
- Equity multiple
- 0.39×
- Total profit
- $-25,464
- Equity at exit
- $22,365
- IRR
- -11.0%
- Equity multiple
- 0.36×
- Total profit
- $-26,851
- Equity at exit
- $12,969
Cash invested: $42,000 (down + closing). Projections, not guarantees.
Landlord ↔ Tenant lean methodology
- Overall (STATE)
- 87 Strongly Landlord-Friendly
- State Florida
- 87 Strongly Landlord-Friendly · R+3
- County
- — inherits STATE
- City
- — inherits STATE
ZIP-level market 32210
- Rents YoY
- 2.1%
- Active inventory
- 441
- Price-to-rent
- 9.2×
Monthly cashflow live
- Estimated rent
- $1,357 high interval (Pro) →
- Mortgage (P&I)
- −$787
- Tax from tax record
- −$223 /mo · $2,673/yr
- Insurance
- −$62
- HOA
- −$0
- Vacancy / Maint / Mgmt
- −$285
- Net cashflow
- $0
Break-even live
UW: 25.0% down · 7.5% · 30yr · 1.5% tax · 5.0% vac · 8.0% maint · 8.0% mgmt
Financing live
Cash to close
- Down payment
- $37,500
- Closing costs
- $4,500
- Reserves months
- —
- Total cash needed
- —
Loan-product check · same deal, 3 products live
Conventional
25% down · 7.5% · 30yr
- Down + closing
- —
- Monthly P&I
- —
- Monthly cashflow
- —
- DSCR
- —
- Eligible?
- —
Personal DTI + credit; lowest rate.
DSCR
20% down · 8.5% · 30yr
- Down + closing
- —
- Monthly P&I
- —
- Monthly cashflow
- —
- DSCR
- —
- Eligible?
- —
No personal income docs; deal must DSCR.
Hard money
10% down · 12.0% · 12mo
- Down + closing
- —
- Monthly P&I
- —
- Monthly cashflow
- —
- DSCR
- —
- Eligible?
- —
Short-term bridge; refi at stabilization.
Rent comps 24 comps
| Address | Beds | Baths | Sqft | Rent | $/sqft | DOM | Units | Dist |
|---|---|---|---|---|---|---|---|---|
| 5770 Brannon Ave Unit 2 Jacksonville, FL | 2.0 | 2.0 | 800 | $1,095 | $1.37 | 7d | 1 | 0.59mi |
| 5937 Camaro Dr W Jacksonville, FL | 3.0 | 1.5 | 1052 | $1,595 | $1.52 | 23d | 1 | 0.61mi |
| 8050 103rd St Jacksonville, FL | 1.0–3.0 | 1.0–2.0 | 1025 | $1,575 | $1.54 | 1d | 11 | 0.79mi |
| 9359 103rd St Jacksonville, FL | 1.0–3.0 | 1.0–2.0 | 848 | $1,479 | $1.74 | 1d | 1 | 0.88mi |
| 7978 Renault Dr Jacksonville, FL | 3.0 | 2.0 | 1080 | $1,850 | $1.71 | 23d | 1 | 0.95mi |
| 5150 Playpen Dr #4 Jacksonville, FL | 2.0 | 2.0 | 1118 | $1,200 | $1.07 | 21d | 1 | 0.97mi |
| 9455 103rd St Jacksonville, FL | 1.0–4.0 | 1.0–2.0 | 1090 | $1,570 | $1.44 | 1d | 18 | 1.02mi |
| 8368 Geoffrey Ct Jacksonville, FL | 3.0 | 1.5 | 1104 | $1,730 | $1.57 | 23d | 1 | 1.11mi |
| 5224 Westchase Ct #3 Jacksonville, FL | 2.0 | 1.0 | 776 | $896 | $1.15 | 19d | 1 | 1.14mi |
| 9541 103rd St Jacksonville, FL | 1.0–3.0 | 1.0–2.0 | 1040 | $1,668 | $1.60 | 1d | 21 | 1.14mi |
| 5144 Westchase Ct Unit 1 Jacksonville, FL | 2.0 | 1.0 | 750 | $800 | $1.07 | 23d | 1 | 1.14mi |
| 5324 Westchase Ct Jacksonville, FL | 2.0 | 1.0 | 729 | $995 | $1.36 | 3d | 1 | 1.14mi |
| 5332 Westchase Ct Unit 1 Jacksonville, FL | 2.0 | 1.0 | 900 | $1,450 | $1.61 | 13d | 1 | 1.14mi |
| 5136 Westchase Ct Unit 2 Jacksonville, FL | 2.0 | 1.0 | 729 | $950 | $1.30 | 23d | 1 | 1.14mi |
| 5120 Westchase Ct #1 Jacksonville, FL | 2.0 | 1.5 | 729 | $945 | $1.30 | 23d | 1 | 1.14mi |
| 5018 Westchase Ct Unit 3 Jacksonville, FL | 2.0 | 1.0 | 729 | $995 | $1.36 | 23d | 1 | 1.15mi |
| 5327 Westchase Ct Unit 2 Jacksonville, FL | 2.0 | 1.0 | 728 | $1,150 | $1.58 | 14d | 1 | 1.18mi |
| 5147 Westchase Ct Apt 1 Jacksonville, FL | 2.0 | 1.0 | 729 | $950 | $1.30 | 23d | 1 | 1.18mi |
| 5035 Westchase Ct Apt 2 Jacksonville, FL | 2.0 | 1.0 | 800 | $1,195 | $1.49 | 7d | 1 | 1.18mi |
| 5128 Indian Lakes Ct Jacksonville, FL | 2.0 | 2.0 | 926 | $995 | $1.07 | 12d | 1 | 1.22mi |
| 5143 Indian Lakes Ct Jacksonville, FL | 2.0 | 2.0 | 920 | $995 | $1.08 | 12d | 1 | 1.26mi |
| 5122 Ricker Rd Unit 2 Jacksonville, FL | 2.0 | 2.0 | 926 | $995 | $1.07 | 23d | 1 | 1.29mi |
| 7607 Indian Lakes Dr #1 Jacksonville, FL | 2.0 | 2.0 | 926 | $986 | $1.06 | 16d | 1 | 1.30mi |
| 5521 Ricker Rd Jacksonville, FL | 1.0–2.0 | 1.0 | 700 | $1,200 | $1.71 | 4d | 13 | 1.38mi |
Listing history 8 events
-
2026-06-18days on market $150,000 Active 10 DOM
-
2026-06-17days on market $150,000 Active 9 DOM
-
2026-06-16days on market $150,000 Active 8 DOM
-
2026-06-15days on market $150,000 Active 7 DOM
-
2026-06-13days on market $150,000 Active 5 DOM
-
2026-06-13days on market $150,000 Active 4 DOM
-
2026-06-08remarks 699-char remark
-
2026-06-08$150,000 Active 1 DOM
ⓘ Source: listings_history table (triggers on properties + properties_extension) + one-shot
backfill from property_details.listing_events for pre-trigger history.
Tax reassessment forecast FL · Resets to sale price
- Current annual tax
- $2,673 · $223/mo
- Projected year-2 tax
- $2,673 · $223/mo
- Expected delta
- $0/yr ($0/mo · 0.0%)
ⓘ Screening estimate from a state-policy table — verify with the county assessor before closing.
Climate risk First Street
- Flood 1/10 Low FEMA zone X (unshaded) · 0% chance over 30 yrs
- Wildfire 3/10 Moderate
- Heat 8/10 Severe 7 d/yr ≥108°F today · 19 d/yr by 30 yrs out
- Wind 9/10 Extreme 99% chance of damaging wind over 30 yrs
- Air quality 5/10 Major 6 unhealthy d/yr today · 7 by 30 yrs out
Nearby sold comps map
Loading sold comps map…
Walkable amenities ~0.75 mi
Loading nearby amenities…
Taxation est. · year 1
- Rental income
- $16,282
- − Mortgage interest
- −$8,402
- − Property taxes
- −$2,673
- − Insurance
- −$750
- − Repairs & maintenance
- −$1,303
- − Management
- −$1,303
- − Depreciation
- −$4,364
- Taxable loss
- −$2,512
- Est. tax savings @ 24.0%
- +$603
- After-tax cash flow
- $604/yr
For passive investors: Depreciation is non-cash, so a rental often shows a tax loss while cash-flowing — sheltering income. Rental losses are passive: they offset passive income freely, and up to $25,000/yr can offset ordinary (W-2) income if you actively participate and your MAGI is under $100k (phasing out to $0 by $150k); unused losses carry forward. On sale, claimed depreciation is recaptured at up to 25%, and gains may owe capital-gains tax (a 1031 exchange can defer both). Figures are a year-1 estimate at your 24.0% rate — not tax advice; consult a CPA.
Schools (NCES district)
- District
- Duval
- NCES district ID
- 1200480
- Math proficiency
- 46% ▼ -11.00%
- Reading proficiency
- 45% ▼ -4.00%
- Median HH income
- $48,987
- Composite
- 38.97/100
- National rank
- #4076
- State rank
- #48 of 73 in FL
Livability — Jacksonville
- Score
- 83/100
- State rank
- #50
- US rank
- #911
Category grades
Schools grade is shown separately in the Schools card above.
Census & demographics
- Census place
- Jacksonville, FL
- County
- Duval County · 1,015,274 people
- City population
- 979,034
- Metro
- Jacksonville, FL
- Population (ZIP)
- 65,729
- Household income
- $61,050
- Rent vs Own
- Severe rent burden
- 3605.0
Population outlook (Duval County) Hauer SSP2
- Today (2025)
- 1,013,010 people
- By 2030
- 1,059,228 · +4.6%
- By 2040
- 1,141,439 · +12.7%
- By 2050
- 1,205,258 · +19.0%
- By 2075
- 1,324,282 · +30.7%
- By 2100
- 1,319,620 · +30.3%
Race, ethnicity, and origin ACS 2023
- Neighborhood character
- Diverse neighborhood (Simpson 0.65)
- Race & ethnicity
- White 43% Black 38% Hispanic / Latino 10% Two or more races 7% Asian 3%
- Hispanic origin (detail)
- Mexican 3% Puerto Rican 3%
- Common ancestry
- Slovak 2% Hispanic 2% Italian 1%
- Foreign-born
- 10% · Canada, Vietnam, China
- Languages at home
- 86% English-only · Spanish 7% French/Haitian/Cajun 2% Tagalog/Filipino 1%
Political lean MEDSL · Duval
- 2024 margin
- Toss-up / Even · D 48.7% · R 50.1% · Other 1.2%
- 2008→2024 swing
- +0.4pp no change · 2008: -1.9pp · 2024: -1.5pp
- All cycles
- 2024: R+1.5 2020: D+3.8 2016: R+1.5 2012: R+3.6 2008: R+1.9
Not yet ingested
- Civics
- —
Market trends
- HPI YoY
- ▼ -314.81%
- Current HPI
- 281.2688
- Rent YoY
- ▲ 2.11%
- Metro
- Jacksonville, FL
- State GDP YoY
- ▲ 3.28%
- F500 in state
- 36
Industry mix (Fortune 500 HQ in FL)
| Industry | F500 HQs | Revenue |
|---|---|---|
| Industrial Technology | 2 | $29B |
|
||
| Insurance | 2 | $17B |
|
||
| Retail | 1 | $60B |
|
||
| Technology Distribution | 1 | $58B |
|
||
| Homebuilding | 1 | $35B |
|
||
| Technology Manufacturing | 1 | $35B |
|
||
Price history
+131.1% since first listed64 events — show timeline
- 2026-06-08 Listed $150,000 realMLS
- 2025-04-25 Listing Removed — realMLS
- 2025-04-23 Price Changed $150,000 realMLS
- 2025-04-12 Relisted — realMLS
- 2025-04-10 Contingent — realMLS
- 2025-03-13 Price Changed $155,000 realMLS
- 2025-02-17 Relisted — realMLS
- 2025-02-17 Rental Removed $1,318 SHOWMOJO
- 2025-02-15 Rental Removed $1,318 RENT.
- 2025-02-08 Contingent — realMLS
- 2025-02-01 Listed for Rent $1,318 RENT.
- 2025-01-31 Listed for Rent $1,318 SHOWMOJO
- 2024-12-20 Listed $165,000 realMLS
- 2024-11-22 Rental Removed $1,318 SHOWMOJO
- 2024-11-20 Rental Removed $1,318 RENT.
- 2024-11-16 Listed for Rent $1,318 RENT.
- 2024-11-16 Listed for Rent $1,318 SHOWMOJO
- 2020-10-27 Sold (MLS) $94,050 realMLS
- 2020-10-27 Sold (MLS) $94,050 realMLS
- 2020-09-28 Pending — realMLS
- 2020-09-28 Pending — realMLS
- 2020-08-27 Contingent — realMLS
- 2020-08-27 Contingent — realMLS
- 2020-08-20 Relisted — realMLS
- 2020-08-20 Relisted — realMLS
- 2020-08-13 Contingent — realMLS
- 2020-08-13 Contingent — realMLS
- 2020-07-01 Price Changed $99,000 realMLS
- 2020-07-01 Price Changed $99,000 realMLS
- 2020-06-18 Price Changed $109,000 realMLS
- 2020-06-18 Price Changed $109,000 realMLS
- 2020-05-28 Price Changed $119,000 realMLS
- 2020-05-28 Price Changed $119,000 realMLS
- 2020-05-18 Listed $124,000 realMLS
- 2020-05-12 Listed $124,000 realMLS
- 2020-05-06 Listing Removed — realMLS
- 2020-04-13 Price Changed $124,000 realMLS
- 2020-03-26 Price Changed $127,000 realMLS
- 2020-03-21 Price Changed $129,900 realMLS
- 2020-03-06 Price Changed $134,900 realMLS
- 2020-02-25 Listed $149,900 realMLS
- 2016-08-11 Listing Removed — realMLS
- 2016-05-03 Listed $45,500 realMLS
- 2016-05-03 Price Changed $45,400 realMLS
- 2016-05-03 Price Changed $39,900 realMLS
- 2016-05-03 Price Changed $30,000 realMLS
- 2016-05-03 Price Changed $32,000 realMLS
- 2016-05-03 Price Changed $43,900 realMLS
- 2015-03-18 Sold (Public Records) $40,000 Public Records
- 2015-03-02 Sold (MLS) $19,999 realMLS
- 2015-01-28 Pending — realMLS
- 2015-01-16 Relisted — realMLS
- 2015-01-15 Price Changed $19,999 realMLS
- 2014-12-08 Listing Removed — realMLS
- 2014-09-07 Listed $28,900 realMLS
- 2014-06-15 Listed $28,900 realMLS
- 2012-07-30 Listing Removed — realMLS
- 2012-06-04 Listed $49,900 realMLS
- 2010-01-28 Sold (Public Records) $32,800 Public Records
- 2010-01-21 Listing Removed — realMLS
- 2010-01-20 Sold (MLS) $32,729 realMLS
- 2009-07-02 Listed $44,900 realMLS
- 2009-06-04 Listing Removed — realMLS
- 2008-12-17 Listed $64,900 realMLS
Property tax history
+13.1%/yrLatest (2025): $2,673 · +13.0% YoY. Source: county tax records.
Cash-flow waterfall
monthlySold comps — $/sqft
last 12 mo · ≤1 miLoading sold comps…