25 Log St · Manchester, NH
Flood risk 9/10 · Severe
- FEMA flood zone
- X (unshaded)
- Chance of flooding over 30 yrs
- 0.99%
- Est. flood insurance / yr
- $507 – $1,088
Fire risk 1/10 · Minimal
- Est. fire insurance / yr
- $507 – $941
Heat risk 4/10 · Minor
- Hot days now (above 95°F)
- 7 days/yr
- Hot days in 30 yrs
- 16 days/yr
Wind risk 4/10 · Minor
- Chance of severe wind over 30 yrs
- 22.0%
Air-quality risk 2/10 · Minimal
- Unhealthy air days now
- 1 days/yr
- Unhealthy air days in 30 yrs
- 2 days/yr
Risk factors via First Street. Map © Google.
Why this score? — see what drove the D grade
The composite is a weighted blend of 9 inputs, each scored 0–100. Each bar is that input's sub-score; the figure is the points it added to the 100-point composite (weight × sub-score).
- Cash flow +13.2/30.0
- ARV discount +7.5/15.0
- 1% rule +6.5/10.0
- Livability +4.2/5.0
- DSCR +4.0/10.0
- Rent growth +3.2/5.0
- Condition / age +2.5/5.0
- Schools +1.9/10.0
- Appreciation +0.0/10.0
$169,000
🖨 Deal sheet 📄 Offer letter ✓ Due diligence
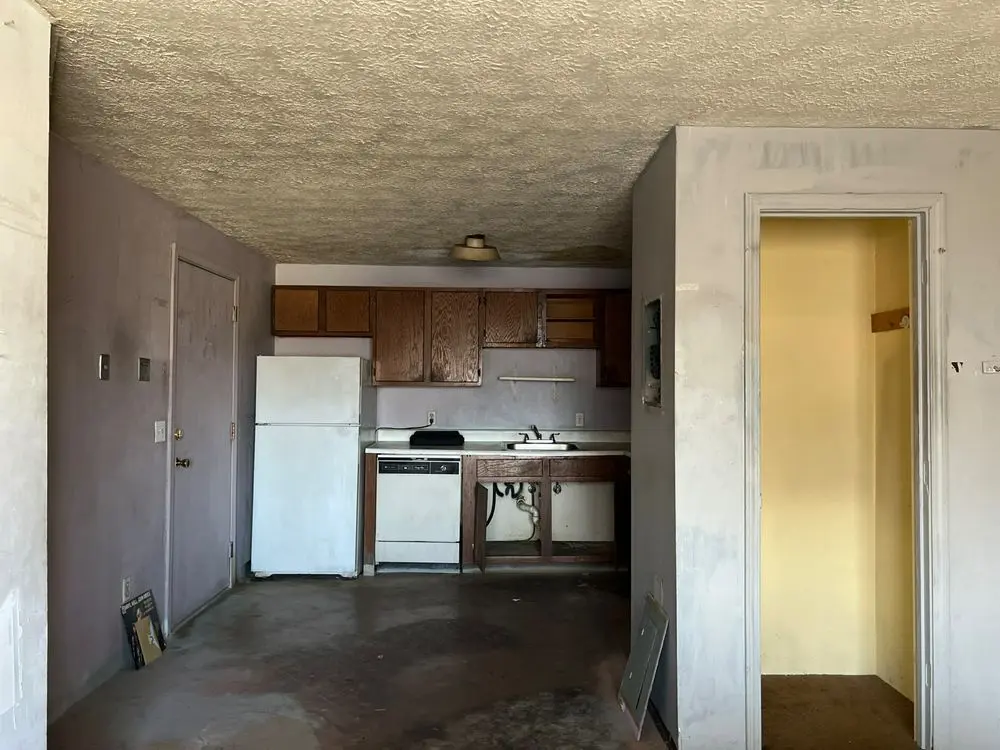
Listing remarks MLS
Affordable way to own your own home! This 2nd floor, corner unit has been recently painted and offers Berber carpet, aapplianced, eat in kitchen, 2 bedrooms, up to 2 car parking, ipool and play area, more. All pets must be approved by condo assoc.
Key facts
- Built 1980
- Listed 13 days
Neighborhood map
What this means for you Summary
Snapshot
- This is a 2-bed/1.0-bath condo listed at $169k.
Deal economics
- At list price, monthly cash flow is $-68 ($-820/yr) — negative.
- The deal already cash-flows at list — no discount required.
- Meets the 1% rule at list price ($2k rent vs $169k).
- Cap rate 6.3% vs local median 3.1% in Manchester — top-decile yield for the area; either an underpriced asset or a hidden risk that comps aren't pricing in. Stress-test before assuming the spread holds.
Location & tenants
- Location reads 83/100 on livability (#10 in NH, #879 nationally) — a professional / high-income tenant draw. Strengths: amenities A+, commute A+, housing A+.
- Manchester School District (urban): math 14% / reading 27% proficiency, ranked #96 of 98 in NH (top 98%) — low school quality limits family demand, transient renter base, plan for 1-2y turnover.
- Market conditions: Rents rising (+3.0%/yr); 71 active listings in the ZIP; 38 comparable units currently listed for rent nearby; rentals lingering (median 44d on market — plan ~5-8 weeks vacancy on turnover, expect pricing pressure); 53% of comp listings sitting > 30 days — soft ceiling on asking rent; 981 units permitted in Hillsborough County in 2024 (381 in 5+ unit buildings).
- This rent runs 31% of the median local income ($74k/yr) — at the standard rent-burdened threshold; future hikes will face affordability resistance.
Forward outlook
- Local home prices are declining (-3.0%/yr); year-one equity from $1k of loan paydown is wiped out by about $5k of value loss. Plan a longer hold.
- Hillsborough County population projected to shrink 8% by 2050 — rents likely to lag national; underwrite the cash flow, not the appreciation.
Negotiation context
- Only 14 days on market — expect competitive offers; lowballing is unlikely to land.
- 26 sale attempts since 23y ago with the ask held roughly flat each time — persistent listings suggest the price (not the market) is what's stuck; bring a comps-based counter.
- Current owner paid $85k; list at $169k implies a 99% gain — meaningful room to come down on a strong offer.
Risks & watch-outs
- Watch-outs: flood insurance adds $66/mo; HOA is 21% of rent.
- Climate carrying-cost: severe flood risk — expect insurance premiums to compound above CPI over the hold.
Questions for the listing agent
- What do current leases actually rent for vs. the listed asking? Can we see a recent rent roll and the last 12 months of T-12 income?
- What's the actual annual flood-insurance premium (NFIP or private), and is the property in a SFHA with mandatory coverage?
- What does the HOA fee cover, when was the last increase, and are there any pending special assessments or reserve-fund shortfalls?
- Any open or pending special assessments — roof, HVAC, plumbing, elevator, façade? What's the per-unit balance and payoff schedule, and is the seller paying it off at close or rolling it to the buyer?
- Is there a deadline driving the sale (1031 exchange, divorce, estate, relocation)? That informs how much negotiation room exists.
- The area grade is low — what's the realistic commute time and amenity access for the typical tenant pool here? Any planned neighborhood developments (good or bad) we should know about?
- What's the average days-on-market for RENTAL listings here right now (not sales)? A rising rental-DOM trend means longer vacancies and softer asking-rent achievability than the comps imply.
- What's the recent tenant-quality profile in this submarket — average credit score on applications, eviction rate, late-payment / NSF rate, and stable-employment percentage? A property-management company in the area should have these aggregated.
- How much new apartment / multifamily construction is in the pipeline within 1–3 miles? Heavy new supply (>2% of stock underway) typically softens rents 12–24 months out; light construction supports rent growth.
Investment metrics
- 1% rule
- 1.15% ✓
- Cap rate
- 6.28%
- Cash-on-cash
- -0.05%
- DSCR
- 1.00
- GRM
- 7.3
CMA / ARV
No comps found within radius.
Projected returns pro-forma
-3.0% appreciation · 2.96% rent growth · sell at horizon
- IRR
- -19.0%
- Equity multiple
- 0.33×
- Total profit
- $-31,524
- Equity at exit
- $25,198
- IRR
- -11.3%
- Equity multiple
- 0.32×
- Total profit
- $-32,186
- Equity at exit
- $14,612
Cash invested: $47,320 (down + closing). Projections, not guarantees.
Landlord ↔ Tenant lean methodology
- Overall (STATE)
- 56 Moderately Landlord-Leaning
- State New Hampshire
- 56 Moderately Landlord-Leaning · D+1
- County
- — inherits STATE
- City
- — inherits STATE
ZIP-level market 03102
- Home prices YoY
- -16.2%
- Rents YoY
- 3.0%
- Active inventory
- 71
- Price-to-rent
- 7.3×
Monthly cashflow live
- Estimated rent
- $1,935 high interval (Pro) →
- Mortgage (P&I)
- −$886
- Tax from tax record
- −$170 /mo · $2,042/yr
- Insurance
- −$70
- Flood insurance flood zone
- −$66 /mo · $798/yr
- HOA est. from 2 same-building comps
- −$404
- Vacancy / Maint / Mgmt
- −$406
- Net cashflow
- $-68
Break-even live
UW: 25.0% down · 7.5% · 30yr · 1.5% tax · 5.0% vac · 8.0% maint · 8.0% mgmt
Financing live
Cash to close
- Down payment
- $42,250
- Closing costs
- $5,070
- Reserves months
- —
- Total cash needed
- —
Loan-product check · same deal, 3 products live
Conventional
25% down · 7.5% · 30yr
- Down + closing
- —
- Monthly P&I
- —
- Monthly cashflow
- —
- DSCR
- —
- Eligible?
- —
Personal DTI + credit; lowest rate.
DSCR
20% down · 8.5% · 30yr
- Down + closing
- —
- Monthly P&I
- —
- Monthly cashflow
- —
- DSCR
- —
- Eligible?
- —
No personal income docs; deal must DSCR.
Hard money
10% down · 12.0% · 12mo
- Down + closing
- —
- Monthly P&I
- —
- Monthly cashflow
- —
- DSCR
- —
- Eligible?
- —
Short-term bridge; refi at stabilization.
Rent comps 38 comps
| Address | Beds | Baths | Sqft | Rent | $/sqft | DOM | Units | Dist |
|---|---|---|---|---|---|---|---|---|
| 143 Second St Unit 1 Manchester, NH | 2.0 | 1.0 | 660 | $1,674 | $2.54 | 43d | 1 | 0.26mi |
| 211 Douglas St Unit 211-6 Manchester, NH | 2.0 | 1.0 | 747 | $1,800 | $2.41 | 43d | 1 | 0.33mi |
| 553 South Commercial St Manchester, NH | 2.0 | 1.0–2.0 | 761 | $2,600 | $3.42 | 13d | 9 | 0.47mi |
| 3 Sundial Ave Manchester, NH | 2.0 | 1.0–2.0 | 762 | $2,435 | $3.19 | 13d | 12 | 0.65mi |
| 112 Brown Ave Unit 112 Manchester, NH | 2.0 | 1.0 | 720 | $1,849 | $2.57 | 43d | 1 | 0.66mi |
| 75 Canal St Manchester, NH | 3.0 | 1.0–2.0 | 842 | $3,435 | $4.08 | 13d | 26 | 0.67mi |
| 36 Brown Ave Unit 36 Manchester, NH | 2.0 | 1.0 | 720 | $1,809 | $2.51 | 43d | 1 | 0.67mi |
| 113 Brown Ave Unit 113 Manchester, NH | 1.0 | 1.0 | 468 | $1,799 | $3.84 | 43d | 1 | 0.72mi |
| 154 Sylvester St Unit 2 Manchester, NH | 2.0 | 1.0 | 650 | $1,750 | $2.69 | 43d | 1 | 0.74mi |
| 65 S Elm St Unit 2 Manchester, NH | 1.0 | 1.0 | 600 | $1,999 | $3.33 | 43d | 1 | 0.87mi |
| 21 Central St Manchester, NH | 1.0–2.0 | 1.0 | 764 | $2,800 | $3.66 | 21d | 1 | 0.88mi |
| 67 Central St Manchester, NH | 1.0 | 1.0 | 700 | $2,000 | $2.86 | 13d | 1 | 0.93mi |
| 251 Pine St Unit 201 Manchester, NH | 1.0 | 1.0 | 504 | $1,395 | $2.77 | 21d | 1 | 0.97mi |
| 251 Pine St Unit 304 Manchester, NH | 1.0 | 1.0 | 475 | $1,450 | $3.05 | 21d | 1 | 0.97mi |
| 251 Pine St Apt 303 Manchester, NH | 1.0 | 1.0 | 391 | $1,350 | $3.45 | 43d | 1 | 0.97mi |
| 221 Calef Rd Unit 3 Manchester, NH | 1.0 | 1.0 | 550 | $1,450 | $2.64 | 43d | 1 | 0.98mi |
| 526 Hevey St Unit 4 Manchester, NH | 1.0 | 1.0 | 600 | $2,250 | $3.75 | 43d | 1 | 1.05mi |
| 40 Hanover St Manchester, NH | 1.0 | 1.0 | 680 | $1,613 | $2.37 | 43d | 1 | 1.05mi |
| 99 Beech St Apt 3W Manchester, NH | 1.0 | 1.0 | 450 | $1,500 | $3.33 | 43d | 1 | 1.09mi |
| 25 Laval St Manchester, NH | 1.0 | 1.0 | 595 | $1,400 | $2.35 | 13d | 2 | 1.09mi |
| 25 Lowell St Ste 306 Manchester, NH | 1.0 | 1.0 | 575 | $1,850 | $3.22 | 43d | 1 | 1.16mi |
| 25 Lowell St Unit 106 Manchester, NH | 1.0 | 1.0 | 594 | $2,700 | $4.55 | 43d | 1 | 1.16mi |
| 80 Lowell St Manchester, NH | 2.0 | 1.0 | 500 | $1,700 | $3.40 | 21d | 1 | 1.23mi |
| 1200 Elm St Manchester, NH | 1.0–2.0 | 1.0–2.0 | 947 | $2,960 | $3.12 | 13d | 9 | 1.23mi |
| 293 Central St Unit 7 Manchester, NH | 2.0 | 1.0 | 400 | $1,495 | $3.74 | 21d | 1 | 1.25mi |
| 470 Silver St #309 Manchester, NH | 1.0 | 1.0 | 603 | $1,725 | $2.86 | 43d | 1 | 1.27mi |
| 1297 Elm St Unit 1297-20 Elm Manchester, NH | 1.0 | 1.0 | 653 | $1,625 | $2.49 | 43d | 1 | 1.32mi |
| 345 Lake Ave Apt 3 Manchester, NH | 1.0 | 1.0 | 700 | $1,595 | $2.28 | 13d | 1 | 1.36mi |
| 492 Pine St Unit 2 Manchester, NH | 1.0 | 1.0 | 675 | $1,500 | $2.22 | 43d | 1 | 1.36mi |
| 494 Pine St Manchester, NH | 1.0 | 1.0 | 425 | $1,500 | $3.53 | 21d | 1 | 1.36mi |
| 1361 Elm St Unit DLX+1BR Manchester, NH | 1.0 | 1.0 | 550 | $2,099 | $3.82 | 13d | 1 | 1.37mi |
| 274 Amherst St Manchester, NH | 1.0 | 1.0 | 550 | $1,495 | $2.72 | 13d | 1 | 1.38mi |
| 274 Amherst St Unit C2 Manchester, NH | 1.0 | 1.0 | 550 | $1,495 | $2.72 | 43d | 1 | 1.38mi |
| 325 Amherst St Unit 2F Manchester, NH | 2.0 | 1.0 | 609 | $1,495 | $2.45 | 43d | 1 | 1.40mi |
| 610 Union St Unit 403 Manchester, NH | 1.0 | 1.0 | 644 | $1,558 | $2.42 | 21d | 1 | 1.41mi |
| 124 Orange St #202 Manchester, NH | 1.0 | 1.0 | 570 | $1,508 | $2.65 | 43d | 1 | 1.45mi |
| 581 Chestnut St Manchester, NH | 1.0 | 1.0 | 650 | $1,395 | $2.15 | 21d | 1 | 1.45mi |
| 285 Concord St Unit 7 Manchester, NH | 1.0 | 1.0 | 390 | $1,550 | $3.97 | 13d | 1 | 1.50mi |
HOA detail condo
- Monthly dues
- $0 · $0/yr
- Likely covers
- pool
- Assessments
- None detected in remarks — confirm with the listing agent.
Listing history 11 events
-
2026-06-18days on market $169,000 Active 14 DOM
-
2026-06-17days on market $169,000 Active 13 DOM
-
2026-06-16days on market $169,000 Active 12 DOM
-
2026-06-15days on market $169,000 Active 11 DOM
-
2026-06-14days on market $169,000 Active 9 DOM
-
2026-06-13days on market $169,000 Active 8 DOM
-
2026-06-10days on market $169,000 Active 6 DOM
-
2026-06-09days on market $169,000 Active 5 DOM
-
2026-06-08days on market $169,000 Active 4 DOM
-
2026-06-07remarks 476-char remark
-
2026-06-07$169,000 Active 3 DOM
ⓘ Source: listings_history table (triggers on properties + properties_extension) + one-shot
backfill from property_details.listing_events for pre-trigger history.
Tax reassessment forecast NH · Partial reset (capped growth)
- Current annual tax
- $2,042 · $170/mo
- Projected year-2 tax
- $2,863 · $239/mo
- Expected delta
- +$821/yr (+$68/mo · 40.2%)
ⓘ Screening estimate from a state-policy table — verify with the county assessor before closing.
Climate risk First Street
- Flood 9/10 Extreme FEMA zone X (unshaded) · 99% chance over 30 yrs
- Wildfire 1/10 Low
- Heat 4/10 Moderate 7 d/yr ≥95°F today · 16 d/yr by 30 yrs out
- Wind 4/10 Moderate 22% chance of damaging wind over 30 yrs
- Air quality 2/10 Low 1 unhealthy d/yr today · 2 by 30 yrs out
Nearby sold comps map
Loading sold comps map…
Walkable amenities ~0.75 mi
Loading nearby amenities…
Taxation est. · year 1
- Rental income
- $23,224
- − Mortgage interest
- −$9,467
- − Property taxes
- −$2,042
- − Insurance
- −$1,642
- − Repairs & maintenance
- −$1,858
- − Management
- −$1,858
- − HOA
- −$4,848
- − Depreciation
- −$4,916
- Taxable loss
- −$3,407
- Est. tax savings @ 24.0%
- +$818
- After-tax cash flow
- $-3/yr
For passive investors: Depreciation is non-cash, so a rental often shows a tax loss while cash-flowing — sheltering income. Rental losses are passive: they offset passive income freely, and up to $25,000/yr can offset ordinary (W-2) income if you actively participate and your MAGI is under $100k (phasing out to $0 by $150k); unused losses carry forward. On sale, claimed depreciation is recaptured at up to 25%, and gains may owe capital-gains tax (a 1031 exchange can defer both). Figures are a year-1 estimate at your 24.0% rate — not tax advice; consult a CPA.
Schools (NCES district)
- District
- Manchester School District
- NCES district ID
- 3304590
- Math proficiency
- 14% ▼ -10.00%
- Reading proficiency
- 27% ▼ -6.00%
- Median HH income
- $54,096
- Composite
- 18.67/100
- National rank
- #8886
- State rank
- #96 of 98 in NH
Livability — Manchester
- Score
- 83/100
- State rank
- #10
- US rank
- #879
Category grades
Schools grade is shown separately in the Schools card above.
Census & demographics
- Census place
- Manchester, NH
- County
- Hillsborough County · 309,362 people
- City population
- 110,172
- Metro
- Manchester-Nashua, NH
- Population (ZIP)
- 33,959
- Household income
- $74,327
- Rent vs Own
- Severe rent burden
- 1368.0
Population outlook (Hillsborough County) Hauer SSP2
- Today (2025)
- 412,771 people
- By 2030
- 410,974 · -0.4%
- By 2040
- 399,959 · -3.1%
- By 2050
- 381,542 · -7.6%
- By 2075
- 339,855 · -17.7%
- By 2100
- 289,270 · -29.9%
Race, ethnicity, and origin ACS 2023
- Neighborhood character
- Predominantly White (75%)
- Race & ethnicity
- White 75% Hispanic / Latino 9% Two or more races 8% Black 6% Asian 5%
- Hispanic origin (detail)
- Mexican 1% Puerto Rican 3% Dominican 2%
- Common ancestry
- Lithuanian 11% Romanian 3% Slovak 3%
- Foreign-born
- 14% · Canada, China, India
- Languages at home
- 81% English-only · Spanish 5% French/Haitian/Cajun 5% Other Indo-European 3%
Political lean MEDSL · Hillsborough
- 2024 margin
- Toss-up / Even · D 50.9% · R 48.0% · Other 1.0%
- 2008→2024 swing
- -0.9pp no change · 2008: 3.8pp · 2024: 2.9pp
- All cycles
- 2024: D+2.9 2020: D+7.7 2016: R+0.2 2012: D+1.7 2008: D+3.8
Not yet ingested
- Civics
- —
Market trends
- HPI YoY
- ▼ -68.62%
- Current HPI
- 355.9606
- Rent YoY
- ▲ 2.96%
- Metro
- Manchester-Nashua, NH
- State GDP YoY
- —
- F500 in state
- 0
Price history
+125.3% since first listed73 events — show timeline
- 2026-06-04 Listed $169,000 ForSaleByOwner.com
- 2006-06-22 Sold (Public Records) $85,000 Public Records
- 2006-06-20 Sold (MLS) $85,000 PrimeMLS
- 2006-05-25 Listed $89,900 PrimeMLS
- 2004-10-04 Sold (MLS) $87,400 PrimeMLS
- 2004-09-30 Sold (MLS) $88,500 PrimeMLS
- 2004-08-14 Listed $89,900 PrimeMLS
- 2004-08-14 Listed $89,900 PrimeMLS
- 2004-04-28 Sold (MLS) $64,166 PrimeMLS
- 2004-04-08 Delisted — PrimeMLS
- 2004-03-22 Sold (MLS) $65,000 PrimeMLS
- 2004-03-12 Sold (MLS) $75,000 PrimeMLS
- 2004-03-10 Listed $65,000 PrimeMLS
- 2004-03-01 Delisted — PrimeMLS
- 2004-01-20 Delisted — PrimeMLS
- 2004-01-06 Sold (MLS) $80,000 PrimeMLS
- 2003-12-16 Sold (MLS) $65,000 PrimeMLS
- 2003-12-15 Sold (MLS) $85,000 PrimeMLS
- 2003-12-10 Delisted — PrimeMLS
- 2003-12-09 Listed $88,900 PrimeMLS
- 2003-12-04 Sold (MLS) $65,000 PrimeMLS
- 2003-12-03 Sold (MLS) $80,000 PrimeMLS
- 2003-12-03 Sold (MLS) $43,000 PrimeMLS
- 2003-11-20 Delisted — PrimeMLS
- 2003-11-17 Delisted — PrimeMLS
- 2003-11-07 Delisted — PrimeMLS
- 2003-10-31 Sold (MLS) $65,000 PrimeMLS
- 2003-10-29 Delisted — PrimeMLS
- 2003-10-29 Delisted — PrimeMLS
- 2003-10-24 Sold (MLS) $75,000 PrimeMLS
- 2003-10-08 Delisted — PrimeMLS
- 2003-10-03 Sold (MLS) $85,000 PrimeMLS
- 2003-09-29 Delisted — PrimeMLS
- 2003-09-25 Sold (MLS) $65,000 PrimeMLS
- 2003-09-22 Sold (MLS) $75,000 PrimeMLS
- 2003-09-15 Sold (MLS) $75,000 PrimeMLS
- 2003-09-12 Sold (MLS) $75,000 PrimeMLS
- 2003-09-12 Sold (MLS) $75,000 PrimeMLS
- 2003-09-12 Sold (MLS) $75,000 PrimeMLS
- 2003-09-12 Sold (MLS) $75,000 PrimeMLS
- 2003-09-03 Delisted — PrimeMLS
- 2003-09-03 Delisted — PrimeMLS
- 2003-09-02 Listed $75,000 PrimeMLS
- 2003-09-02 Listed $75,000 PrimeMLS
- 2003-08-31 Listed $80,000 PrimeMLS
- 2003-08-31 Listed $65,000 PrimeMLS
- 2003-08-31 Listed $80,000 PrimeMLS
- 2003-08-31 Listed $55,000 PrimeMLS
- 2003-08-31 Listed $80,000 PrimeMLS
- 2003-08-31 Listed $85,000 PrimeMLS
- 2003-08-31 Listed $65,000 PrimeMLS
- 2003-08-28 Sold (MLS) $65,000 PrimeMLS
- 2003-08-26 Delisted — PrimeMLS
- 2003-08-26 Listed $75,000 PrimeMLS
- 2003-08-21 Delisted — PrimeMLS
- 2003-08-13 Delisted — PrimeMLS
- 2003-08-12 Delisted — PrimeMLS
- 2003-08-12 Listed $65,000 PrimeMLS
- 2003-08-12 Listed $75,000 PrimeMLS
- 2003-08-11 Sold (MLS) $65,000 PrimeMLS
- 2003-08-08 Listed $75,000 PrimeMLS
- 2003-08-08 Delisted — PrimeMLS
- 2003-08-01 Delisted — PrimeMLS
- 2003-08-01 Delisted — PrimeMLS
- 2003-07-25 Listed $75,000 PrimeMLS
- 2003-07-25 Listed $65,000 PrimeMLS
- 2003-07-25 Listed $65,000 PrimeMLS
- 2003-07-24 Listed $65,000 PrimeMLS
- 2003-07-23 Listed $75,000 PrimeMLS
- 2003-07-15 Sold (MLS) $75,000 PrimeMLS
- 2003-07-07 Delisted — PrimeMLS
- 2003-06-18 Listed $65,000 PrimeMLS
- 2003-05-27 Listed $75,000 PrimeMLS
Property tax history
+2.3%/yrLatest (2024): $2,042 · +3.8% YoY. Source: county tax records.
Cash-flow waterfall
monthlySold comps — $/sqft
last 12 mo · ≤1 miLoading sold comps…