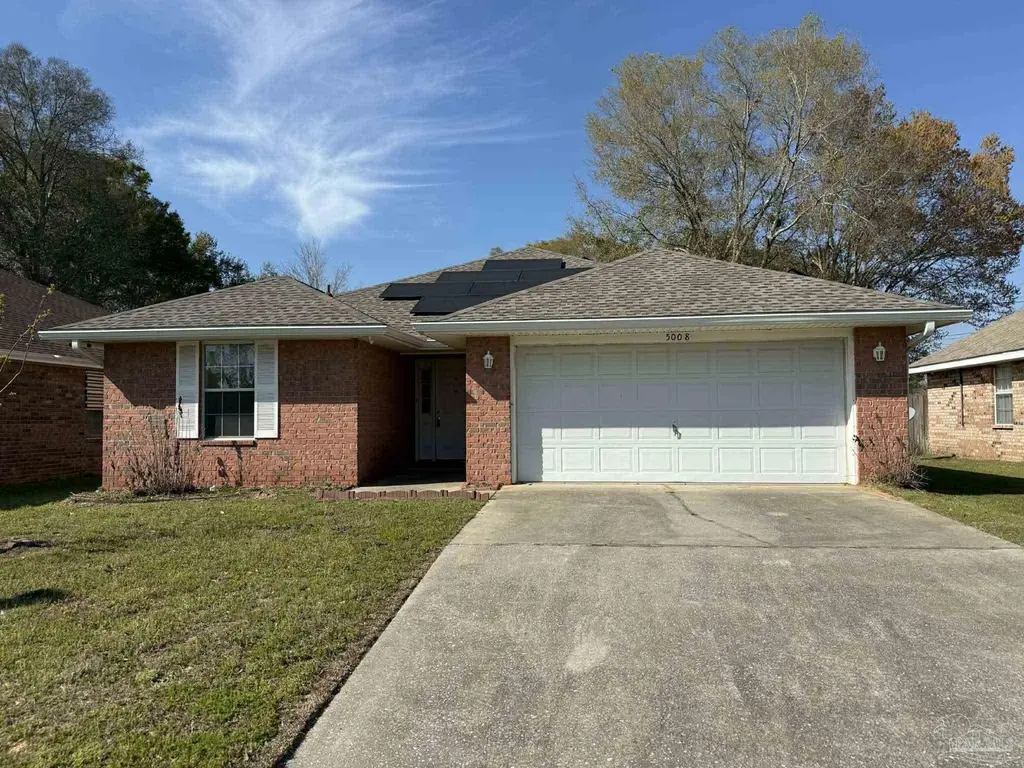
5008 Orlando Ct · Bellview, FL
Flood risk 1/10 · Minimal
- FEMA flood zone
- X (unshaded)
- Chance of flooding over 30 yrs
- 0.0%
- Est. flood insurance / yr
- $507 – $1,088
Fire risk 4/10 · Minor
- Est. fire insurance / yr
- $947 – $1,759
Heat risk 10/10 · Severe
- Hot days now (above 105°F)
- 7 days/yr
- Hot days in 30 yrs
- 23 days/yr
Wind risk 9/10 · Severe
- Chance of severe wind over 30 yrs
- 99.0%
Air-quality risk 1/10 · Minimal
- Unhealthy air days now
- 0 days/yr
- Unhealthy air days in 30 yrs
- 0 days/yr
Risk factors via First Street. Map © Google.
Why this score? — see what drove the D grade
The composite is a weighted blend of 9 inputs, each scored 0–100. Each bar is that input's sub-score; the figure is the points it added to the 100-point composite (weight × sub-score).
- Cash flow +12.6/30.0
- ARV discount +9.0/15.0
- DSCR +3.8/10.0
- 1% rule +3.7/10.0
- Rent growth +3.6/5.0
- Schools +3.6/10.0
- Livability +3.4/5.0
- Condition / age +2.5/5.0
- Appreciation +0.0/10.0
$235,500
🖨 Deal sheet (PDF) 📄 Offer letter ✓ Due diligence
Listing remarks MLS
Welcome to 5008 Orlando Ct—an excellent opportunity for first-time homebuyers looking for comfort, convenience, and affordability! Tucked away on a quiet cul-de-sac in Pensacola, this home offers a welcoming setting with easy access to everything you need. Inside, you’ll find a functional layout with comfortable living spaces, great natural light, and room to make it your own. The kitchen and living area provide a cozy space for everyday living, while the bedrooms offer flexibility for guests, a home office, or growing needs. The low-maintenance backyard is perfect for buyers who want outdoor space without the hassle of heavy upkeep—ideal for busy lifestyles or those new to homeownership. Conveniently located near shopping, dining, schools, and major roadways, this home makes daily life simple and accessible. If you’ve been waiting for an affordable place to call your own, this is your chance—schedule your showing today to make this your Next Home!
Key facts
- Quiet cul-de-sac
- 4,791 sq ft lot
- 2 garage spots
Tags
Neighborhood map
What this means for you Summary
Snapshot
- This is a 3-bed/3.0-bath single-family listed at $236k.
Deal economics
- At list price, monthly cash flow is $-29 ($-346/yr) — negative.
- To cash-flow at today's rent, offer at most $230k (2.2% below list).
- To meet the 1% rule (rent ≥ 1% of price), the offer needs to be $205k (12.9% below list).
- Recommended offer: $205k (12.9% below list) — sets the bar for 1% rule.
Location & tenants
- Location reads 67/100 on livability (#561 in FL) — a middle-class / working-renter tenant base. Strengths: cost of living A+, housing A+; Watch: amenities F, commute F, health & safety F.
- Escambia (suburban): math 40% / reading 45% proficiency, ranked #56 of 73 in FL (top 77%) — families likely to look elsewhere, expect single-tenant / working-renter base with shorter leases.
- Zoned schools: Bellview Elementary School (math 28% / reading 34%, grade F, #1,854 of 2,144 statewide, top 87%, 545 students, 75% FRL); Bellview Middle School (math 17% / reading 23%, grade F, #558 of 571 statewide, top 98%, 992 students, 76% FRL); Pine Forest High School (math 20% / reading 32%, grade F, #494 of 667 statewide, top 75%, 1,870 students, 62% FRL).
- Zoned-school proficiency averages 26% at this address vs 42% district-wide (-17 pts) — the specific schools serving this property underperform the Escambia average; the district grade overstates school quality for this exact location.
- Market conditions: Rents rising fast (+4.4%/yr); 421 active listings in the ZIP; 17 comparable units currently listed for rent nearby; rentals at typical pace (median 26d on market — plan ~3-4 weeks tenant-placement turnaround); solid renter incomes; 1,479 units permitted in Escambia County in 2024 (0 in 5+ unit buildings).
- This rent runs 33% of the median local income ($75k/yr) — at the standard rent-burdened threshold; future hikes will face affordability resistance.
Forward outlook
- Local home prices are declining (-3.0%/yr); year-one equity from $2k of loan paydown is wiped out by about $7k of value loss. Plan a longer hold.
- Escambia County population projected at +13% by 2050 — modest demand growth; plan on rents tracking national, not racing it.
Negotiation context
- It's been on market 43 days — a 3% lower offer ($228k) is reasonable based on typical stale-listing flexibility.
- 5 sale attempts since 21y ago; this cycle's ask has dropped $26k (10%) from the opening price — seller is motivated, your offer sets the floor, not the list.
Risks & watch-outs
- Climate carrying-cost: severe wind risk, 99% chance of damaging wind over 30y; extreme-heat days projected 7→23/yr by 2055 (HVAC capex compounding) — expect insurance premiums to compound above CPI over the hold.
Questions for the listing agent
- What do current leases actually rent for vs. the listed asking? Can we see a recent rent roll and the last 12 months of T-12 income?
- It's been on market 43 days. Have you received any prior offers? Is the seller open to a 13% concession, seller financing, or rate buy-down credit?
- What does the HOA fee cover, when was the last increase, and are there any pending special assessments or reserve-fund shortfalls?
- Is there a deadline driving the sale (1031 exchange, divorce, estate, relocation)? That informs how much negotiation room exists.
- Schools are D-rated, which usually means shorter tenancies and higher turnover. Who's the typical renter profile here, and what's been the actual vacancy rate?
- The area grade is low — what's the realistic commute time and amenity access for the typical tenant pool here? Any planned neighborhood developments (good or bad) we should know about?
- What's the average days-on-market for RENTAL listings here right now (not sales)? A rising rental-DOM trend means longer vacancies and softer asking-rent achievability than the comps imply.
- What's the recent tenant-quality profile in this submarket — average credit score on applications, eviction rate, late-payment / NSF rate, and stable-employment percentage? A property-management company in the area should have these aggregated.
- How much new for-sale + rental construction is in the pipeline within 1–3 miles? Heavy new supply typically softens prices + rents 12–24 months out; constrained supply supports both.
Investment metrics
- 1% rule
- 0.87% ✗
- Cap rate
- 6.15%
- Cash-on-cash
- -0.52%
- DSCR
- 0.98
- GRM
- 9.6
CMA / ARV
- ARV (median comp)
- $243,533
- List price
- $235,500
- Delta
- -3.30%
- Verdict
- FAIR
- Comps
- 20 within 1.0 mi
Show comp detail 12 sales within ~0.75 mi
| Address | Dist | Beds/Ba | Sqft | Sold | Price | $/sf | Match |
|---|---|---|---|---|---|---|---|
| 6336 Apple Ridge Cir | 0.44mi | 3/2.0 | 1,597 (+2%) | 2mo | $305,000 | $191 | 70 |
| 5165 Zachary Blvd | 0.55mi | 3/2.0 | 1,577 (+1%) | 3mo | $245,000 | $155 | 66 |
| 5146 Cocoa Dr | 0.16mi | 3/2.0 | 1,378 (-12%) | 6mo | $170,000 | $123 | 64 |
| 5127 Cocoa Dr | 0.19mi | 3/2.0 | 1,381 (-12%) | 7mo | $245,000 | $177 | 62 |
| 5196 Zachary Blvd | 0.48mi | 3/2.0 | 1,634 (+5%) | 7mo | $260,000 | $159 | 60 |
| 6357 Buckland Dr | 0.59mi | 3/2.0 | 1,534 (-2%) | 9mo | $240,000 | $156 | 59 |
| 5053 Quarter Deck St | 0.43mi | 3/2.0 | 1,425 (-9%) | 4mo | $288,000 | $202 | 58 |
| 6860 Cedar Ridge Dr | 0.28mi | 3/2.0 | 1,730 (+11%) | 9mo | $267,000 | $154 | 57 |
| 5205 Bankhead Dr | 0.43mi | 3/2.0 | 1,724 (+10%) | 7mo | $563,000 | $327 | 52 |
| 5018 Quarter Deck St | 0.44mi | 3/2.0 | 1,425 (-9%) | 11mo | $300,000 | $211 | 52 |
| 6646 Boatswain Rd | 0.56mi | 3/2.0 | 1,438 (-8%) | 6mo | $299,900 | $209 | 51 |
| 6265 Blue Angel Pkwy | 0.51mi | 3/2.0 | 1,779 (+14%) | 4mo | $165,000 | $93 | 45 |
Match score weights: distance 35% · size 25% · config 20% · recency 20%. Top-matched comps best support the ARV.
Projected returns pro-forma
-3.0% appreciation · 4.42% rent growth · sell at horizon
- IRR
- -15.5%
- Equity multiple
- 0.44×
- Total profit
- $-36,982
- Equity at exit
- $35,114
- IRR
- -4.7%
- Equity multiple
- 0.67×
- Total profit
- $-21,838
- Equity at exit
- $20,362
Cash invested: $65,940 (down + closing). Projections, not guarantees.
Landlord ↔ Tenant lean methodology
- Overall (STATE)
- 87 Strongly Landlord-Friendly
- State Florida
- 87 Strongly Landlord-Friendly · R+3
- County
- — inherits STATE
- City
- — inherits STATE
ZIP-level market 32526
- Home prices YoY
- -28.3%
- Rents YoY
- 4.4%
- Active inventory
- 421
- Price-to-rent
- 9.6×
Monthly cashflow live
- Estimated rent
- $2,051 high interval (Pro) →
- Mortgage (P&I)
- −$1,235
- Tax from tax record
- −$295 /mo · $3,537/yr
- Insurance
- −$98
- HOA
- −$21
- Vacancy / Maint / Mgmt
- −$431
- Net cashflow
- $-29
Break-even live
Sensitivity live
| Price | -10% $104 | -5% $38 | +0% $-29 | +5% $-95 | +10% $-162 |
|---|---|---|---|---|---|
| Rent | -10% $-191 | -5% $-110 | +0% $-29 | +5% $52 | +10% $133 |
| Rate | -1.0pp $90 | -0.5pp $31 | base $-29 | +0.5pp $-90 | +1.0pp $-152 |
UW: 25.0% down · 7.5% · 30yr · 1.5% tax · 5.0% vac · 8.0% maint · 8.0% mgmt
Financing live
Cash to close
- Down payment
- $58,875
- Closing costs
- $7,065
- Reserves months
- —
- Total cash needed
- —
Loan-product check · same deal, 3 products live
Conventional
25% down · 7.5% · 30yr
- Down + closing
- —
- Monthly P&I
- —
- Monthly cashflow
- —
- DSCR
- —
- Eligible?
- —
Personal DTI + credit; lowest rate.
DSCR
20% down · 8.5% · 30yr
- Down + closing
- —
- Monthly P&I
- —
- Monthly cashflow
- —
- DSCR
- —
- Eligible?
- —
No personal income docs; deal must DSCR.
Hard money
10% down · 12.0% · 12mo
- Down + closing
- —
- Monthly P&I
- —
- Monthly cashflow
- —
- DSCR
- —
- Eligible?
- —
Short-term bridge; refi at stabilization.
Rent comps 17 comps
| Address | Beds | Baths | Sqft | Rent | $/sqft | DOM | Units | Dist |
|---|---|---|---|---|---|---|---|---|
| 5079 Cocoa Dr Pensacola, FL | 3.0 | 2.0 | 2129 | $2,075 | $0.97 | 15d | 1 | 0.14mi |
| 3001 Flintlock Dr Pensacola, FL | 3.0 | 2.0 | 1750 | $1,895 | $1.08 | 15d | 1 | 0.20mi |
| 3115 Flintlock Dr Pensacola, FL | 3.0 | 2.0 | 1200 | $1,700 | $1.42 | 25d | 1 | 0.32mi |
| 5049 Quarter Deck St Pensacola, FL | 4.0 | 2.0 | 1820 | $2,300 | $1.26 | 15d | 1 | 0.44mi |
| 5031 Firstmate Way Pensacola, FL | 3.0 | 2.0 | 1425 | $2,100 | $1.47 | 25d | 1 | 0.49mi |
| 5172 Zachary Blvd Pensacola, FL | 3.0 | 2.0 | 1803 | $1,900 | $1.05 | 25d | 1 | 0.49mi |
| 6617 Boatswain Rd Pensacola, FL | 4.0 | 2.5 | 2052 | $2,295 | $1.12 | 15d | 1 | 0.52mi |
| 6787 Rickwood Dr Pensacola, FL | 3.0 | 2.0 | 1931 | $2,100 | $1.09 | 15d | 1 | 0.83mi |
| 7111 N Blue Angel Pkwy Pensacola, FL | 1.0–2.0 | 1.0–2.0 | 989 | $1,555 | $1.57 | 15d | 1 | 0.84mi |
| 7095 N Blue Angel Pkwy Pensacola, FL | 3.0 | 2.0–2.5 | 2168 | $1,875 | $0.86 | 25d | 2 | 0.87mi |
| 5519 Lexlee Blvd Pensacola, FL | 3.0 | 2.5 | 1543 | $1,850 | $1.20 | 25d | 1 | 0.99mi |
| 7137 N Blue Angel Pkwy Pensacola, FL | 2.0 | 2.0–2.5 | 1387 | $2,036 | $1.47 | 25d | 14 | 1.01mi |
| 5217 Saufley Field Rd Pensacola, FL | 4.0 | 2.5 | 1817 | $1,895 | $1.04 | 25d | 1 | 1.26mi |
| 2821 Hillcrest Ave Unit 8 Pensacola, FL | 2.0 | 2.0 | 1100 | $1,050 | $0.95 | 25d | 1 | 1.27mi |
| 5184 Regalo Dr Pensacola, FL | 3.0 | 2.0 | 1504 | $1,900 | $1.26 | 25d | 1 | 1.28mi |
| 7045 Pine Forest Rd Pensacola, FL | 1.0–3.0 | 1.0–2.0 | 1011 | $2,174 | $2.15 | 15d | 27 | 1.40mi |
| 6225 Mobile Hwy Pensacola, FL | 1.0–3.0 | 1.0–2.0 | 1036 | $2,595 | $2.50 | 15d | 15 | 1.48mi |
HOA detail
- Monthly dues
- $21 · $252/yr
Listing history 17 events
-
2026-05-12price $235,500 996-char remark
Show marketing remark (996 chars)
Welcome to 5008 Orlando Ct—an excellent opportunity for first-time homebuyers looking for comfort, convenience, and affordability! Tucked away on a quiet cul-de-sac in Pensacola, this home offers a welcoming setting with easy access to everything you need. Inside, you’ll find a functional layout with comfortable living spaces, great natural light, and room to make it your own. The kitchen and living area provide a cozy space for everyday living, while the bedrooms offer flexibility for guests, a home office, or growing needs. The low-maintenance backyard is perfect for buyers who want outdoor space without the hassle of heavy upkeep—ideal for busy lifestyles or those new to homeownership. Conveniently located near shopping, dining, schools, and major roadways, this home makes daily life simple and accessible. If you’ve been waiting for an affordable place to call your own, this is your chance—schedule your showing today to make this your Next Home!
-
2026-04-09$261,450 Active 996-char remark
Show marketing remark (996 chars)
Welcome to 5008 Orlando Ct—an excellent opportunity for first-time homebuyers looking for comfort, convenience, and affordability! Tucked away on a quiet cul-de-sac in Pensacola, this home offers a welcoming setting with easy access to everything you need. Inside, you’ll find a functional layout with comfortable living spaces, great natural light, and room to make it your own. The kitchen and living area provide a cozy space for everyday living, while the bedrooms offer flexibility for guests, a home office, or growing needs. The low-maintenance backyard is perfect for buyers who want outdoor space without the hassle of heavy upkeep—ideal for busy lifestyles or those new to homeownership. Conveniently located near shopping, dining, schools, and major roadways, this home makes daily life simple and accessible. If you’ve been waiting for an affordable place to call your own, this is your chance—schedule your showing today to make this your Next Home!
-
2024-10-04historical
-
2024-07-19price $279,000
-
2024-04-17price $289,000
-
2024-03-26$299,000 Active
-
2021-12-30soldstatus $224,857
-
2021-12-29soldstatus $224,900 Sold
-
2021-12-27status Pending
-
2021-11-27historical Contingent
-
2021-11-22$224,900 Active
-
2019-12-03soldstatus $175,000
-
2019-12-02soldstatus $175,000
-
2019-10-01$180,000
-
2006-03-27soldstatus $179,625
-
2005-09-21$179,875
-
2005-08-23soldstatus $841,000
ⓘ Source: listings_history table (triggers on properties + properties_extension) + one-shot
backfill from property_details.listing_events for pre-trigger history.
Tax reassessment forecast FL · Resets to sale price
- Current annual tax
- $3,537 · $295/mo
- Projected year-2 tax
- $3,537 · $295/mo
- Expected delta
- $0/yr ($0/mo · 0.0%)
ⓘ Screening estimate from a state-policy table — verify with the county assessor before closing.
Climate risk First Street
- Flood 1/10 Low FEMA zone X (unshaded) · 0% chance over 30 yrs
- Wildfire 4/10 Moderate
- Heat 10/10 Extreme 7 d/yr ≥105°F today · 23 d/yr by 30 yrs out
- Wind 9/10 Extreme 99% chance of damaging wind over 30 yrs
- Air quality 1/10 Low 0 unhealthy d/yr today · 0 by 30 yrs out
Nearby sold comps map
Loading sold comps map…
Walkable amenities ~0.75 mi
Loading nearby amenities…
Taxation est. · year 1
- Rental income
- $24,608
- − Mortgage interest
- −$13,192
- − Property taxes
- −$3,537
- − Insurance
- −$1,178
- − Repairs & maintenance
- −$1,969
- − Management
- −$1,969
- − HOA
- −$252
- − Depreciation
- −$6,851
- Taxable loss
- −$4,338
- Est. tax savings @ 24.0%
- +$1,041
- After-tax cash flow
- $695/yr
For passive investors: Depreciation is non-cash, so a rental often shows a tax loss while cash-flowing — sheltering income. Rental losses are passive: they offset passive income freely, and up to $25,000/yr can offset ordinary (W-2) income if you actively participate and your MAGI is under $100k (phasing out to $0 by $150k); unused losses carry forward. On sale, claimed depreciation is recaptured at up to 25%, and gains may owe capital-gains tax (a 1031 exchange can defer both). Figures are a year-1 estimate at your 24.0% rate — not tax advice; consult a CPA.
Schools (NCES district)
- District
- Escambia
- NCES district ID
- 1200510
- Math proficiency
- 40% ▼ -9.00%
- Reading proficiency
- 45% ▼ -4.00%
- Median HH income
- $44,649
- Composite
- 36.04/100
- National rank
- #4773
- State rank
- #56 of 73 in FL
Livability — Bellview
- Score
- 67/100
- State rank
- #561
- US rank
- #10731
Category grades
Schools grade is shown separately in the Schools card above.
Census & demographics
- Census place
- Bellview, FL
- County
- Escambia County · 301,722 people
- Metro
- Pensacola-Ferry Pass-Brent, FL
- Population (ZIP)
- 44,680
- Household income
- $75,098
- Rent vs Own
- Severe rent burden
- 1166.0
Population outlook (Escambia County) Hauer SSP2
- Today (2025)
- 334,637 people
- By 2030
- 345,779 · +3.3%
- By 2040
- 364,828 · +9.0%
- By 2050
- 378,514 · +13.1%
- By 2075
- 403,220 · +20.5%
- By 2100
- 386,125 · +15.4%
Race, ethnicity, and origin ACS 2023
- Neighborhood character
- Predominantly White (66%)
- Race & ethnicity
- White 66% Black 19% Two or more races 8% Hispanic / Latino 5% Asian 3%
- Common ancestry
- Lithuanian 2% Slovak 2% Serbian 2%
- Foreign-born
- 5% · Canada, China
- Languages at home
- 94% English-only · Spanish 2% Tagalog/Filipino 1% Other Indo-European 1%
Political lean MEDSL · Escambia
- 2024 margin
- R (+19.5) · D 39.7% · R 59.2% · Other 1.1%
- 2008→2024 swing
- -0.2pp no change · 2008: -19.3pp · 2024: -19.5pp
- All cycles
- 2024: R+19.5 2020: R+15.1 2016: R+20.6 2012: R+20.6 2008: R+19.3
Not yet ingested
- Civics
- —
Market trends
- HPI YoY
- ▼ -99.68%
- Current HPI
- 252.6406
- Rent YoY
- ▲ 4.42%
- Metro
- Pensacola-Ferry Pass-Brent, FL
- State GDP YoY
- ▲ 3.28%
- F500 in state
- 36
Industry mix (Fortune 500 HQ in FL)
| Industry | F500 HQs | Revenue |
|---|---|---|
| Industrial Technology | 2 | $29B |
|
||
| Insurance | 2 | $17B |
|
||
| Retail | 1 | $60B |
|
||
| Technology Distribution | 1 | $58B |
|
||
| Homebuilding | 1 | $35B |
|
||
| Technology Manufacturing | 1 | $35B |
|
||
Price history
-72.0% since first listed17 events — show timeline
- 2026-05-12 Price Changed $235,500 PARMLS
- 2026-04-09 Listed $261,450 PARMLS
- 2024-10-04 Listing Removed — PARMLS
- 2024-07-19 Price Changed $279,000 PARMLS
- 2024-04-17 Price Changed $289,000 PARMLS
- 2024-03-26 Listed $299,000 PARMLS
- 2021-12-30 Sold (Public Records) $224,857 Public Records
- 2021-12-29 Sold (MLS) $224,900 PARMLS
- 2021-12-27 Pending — PARMLS
- 2021-11-27 Contingent — PARMLS
- 2021-11-22 Listed $224,900 PARMLS
- 2019-12-03 Sold (Public Records) $175,000 Public Records
- 2019-12-02 Sold (MLS) $175,000 PARMLS
- 2019-10-01 Listed $180,000 PARMLS
- 2006-03-27 Sold (MLS) $179,625 PARMLS
- 2005-09-21 Listed $179,875 PARMLS
- 2005-08-23 Sold (Public Records) $841,000 Public Records
Property tax history
+10.5%/yrLatest (2025): $3,537 · +71.4% YoY. Source: county tax records.
Cash-flow waterfall
monthlySold comps — $/sqft
last 12 mo · ≤1 miLoading sold comps…