 🏢 Co-op
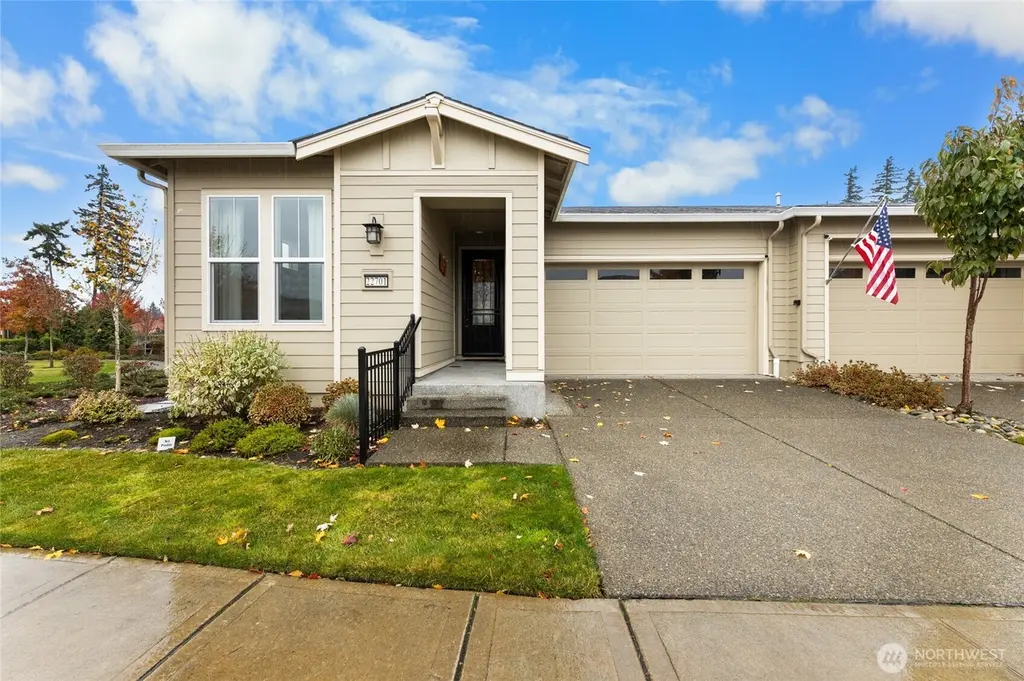
22701 SE 237th Pl · Maple Valley, WA
Flood risk 1/10 · Minimal
- FEMA flood zone
- X (unshaded)
- Chance of flooding over 30 yrs
- 0.0%
- Est. flood insurance / yr
- $507 – $1,088
Fire risk 1/10 · Minimal
- Est. fire insurance / yr
- $604 – $1,122
Heat risk 2/10 · Minimal
- Hot days now (above 87°F)
- 7 days/yr
- Hot days in 30 yrs
- 15 days/yr
Wind risk 1/10 · Minimal
- Chance of severe wind over 30 yrs
- —
Air-quality risk 7/10 · Major
- Unhealthy air days now
- 11 days/yr
- Unhealthy air days in 30 yrs
- 16 days/yr
Risk factors via First Street. Map © Google.
Why this score? — see what drove the D- grade
The composite is a weighted blend of 9 inputs, each scored 0–100. Each bar is that input's sub-score; the figure is the points it added to the 100-point composite (weight × sub-score).
- ARV discount +11.0/15.0
- Cash flow +7.4/30.0
- Schools +6.6/10.0
- Livability +4.2/5.0
- Rent growth +3.2/5.0
- 1% rule +2.5/10.0
- Condition / age +2.5/5.0
- DSCR +1.6/10.0
- Appreciation +0.0/10.0
$522,499
🖨 Deal sheet (PDF) 📄 Offer letter ✓ Due diligence
Listing remarks
Exquisite Maple Valley Home Offering a Perfect Blend of Sophistication & Comfort. One Level Living Nestled in the Desirable Meadow Ridge 55+ Community (under 55 may reside with board approval). This Stunning Home is a Rare Find! Spacious Living with a Beautifully Appointed Chef's Kitchen Equipped with a Large Island, Stainless Appliances & Modern Stove with Air Fry Option. Quartz Counters & Luxury Vinyl Floors Add Elegance Throughout. Light & Bright with Soaring 10' Ceilings & Expansive Windows to let the Sun Shine Throughout. Primary with Spacious EnSuite & Walk-in Closet. Relax on the Large Covered Back Patio with Small Turf Area. The Covered Back Patio
Key facts
- Quartz counters
- Stainless appliances
- Large island
Tags
Neighborhood map
What this means for you Summary
Snapshot
- This is a 2-bed/2.0-bath townhouse listed at $522k.
Deal economics
- At list price, monthly cash flow is $-669 ($-8k/yr) — negative.
- To cash-flow at today's rent, offer at most $404k (22.6% below list).
- To meet the 1% rule (rent ≥ 1% of price), the offer needs to be $393k (24.8% below list).
- Recommended offer: $393k (24.8% below list) — sets the bar for 1% rule.
- Cap rate 4.8% vs local median 3.2% in Maple Valley — top-decile yield for the area; either an underpriced asset or a hidden risk that comps aren't pricing in. Stress-test before assuming the spread holds.
Location & tenants
- Location reads 85/100 on livability (#24 in WA, #461 nationally) — a professional / high-income tenant draw. Strengths: schools A+, employment A+, housing A+; Watch: cost of living F.
- Tahoma School District (suburban): math 68% / reading 76% proficiency, ranked #10 of 291 in WA (top 3%) — strong family-tenant draw, lease renewals of 3-5y typical; only 11% free/reduced lunch — higher-income household profile.
- Market conditions: Rents rising (+2.8%/yr); 226 active listings in the ZIP; 6 comparable units currently listed for rent nearby; rentals at typical pace (median 26d on market — plan ~3-4 weeks tenant-placement turnaround); high-income renter base; 10,555 units permitted in King County in 2024 (7,119 in 5+ unit buildings).
- This rent runs 31% of the median local income ($152k/yr) — at the standard rent-burdened threshold; future hikes will face affordability resistance.
Forward outlook
- Local home prices are declining (-3.0%/yr); year-one equity from $4k of loan paydown is wiped out by about $16k of value loss. Plan a longer hold.
- King County population projected at +44% by 2050 — long-run rental-demand tailwind backs the buy-and-hold thesis.
Negotiation context
- It's been on market 16 days — a 2% lower offer ($515k) is reasonable based on typical stale-listing flexibility.
Questions for the listing agent
- What do current leases actually rent for vs. the listed asking? Can we see a recent rent roll and the last 12 months of T-12 income?
- What does the HOA fee cover, when was the last increase, and are there any pending special assessments or reserve-fund shortfalls?
- Is there a deadline driving the sale (1031 exchange, divorce, estate, relocation)? That informs how much negotiation room exists.
- Schools are A-rated — typically a magnet for longer-tenancy family renters. What's the average tenant stay here, and is there a school-zone premium baked into asking?
- The area grade is low — what's the realistic commute time and amenity access for the typical tenant pool here? Any planned neighborhood developments (good or bad) we should know about?
- What's the average days-on-market for RENTAL listings here right now (not sales)? A rising rental-DOM trend means longer vacancies and softer asking-rent achievability than the comps imply.
- What's the recent tenant-quality profile in this submarket — average credit score on applications, eviction rate, late-payment / NSF rate, and stable-employment percentage? A property-management company in the area should have these aggregated.
- How much new for-sale + rental construction is in the pipeline within 1–3 miles? Heavy new supply typically softens prices + rents 12–24 months out; constrained supply supports both.
Investment metrics
- 1% rule
- 0.75% ✗
- Cap rate
- 4.76%
- Cash-on-cash
- -5.49%
- DSCR
- 0.76
- GRM
- 11.1
CMA / ARV
- ARV (median comp)
- $566,702
- List price
- $522,499
- Delta
- -7.80%
- Verdict
- FAIR
- Comps
- 20 within 1.0 mi
Show comp detail 4 sales within ~0.75 mi
| Address | Dist | Beds/Ba | Sqft | Sold | Price | $/sf | Match |
|---|---|---|---|---|---|---|---|
| 22754 SE 242nd St | 0.30mi | 3/2.5 (+1) | 1,340 (+2%) | 2mo | $539,950 | $403 | 74 |
| 24053 223rd Ln SE | 0.38mi | 2/2.0 | 1,392 (+6%) | 9mo | $492,500 | $354 | 64 |
| 24031 223rd Pl SE #120 | 0.34mi | 3/2.0 (+1) | 1,170 (-11%) | 8mo | $451,000 | $385 | 54 |
| 22311 SE 242nd Pl #130 | 0.42mi | 3/2.0 (+1) | 1,450 (+11%) | 12mo | $565,000 | $390 | 48 |
Match score weights: distance 35% · size 25% · config 20% · recency 20%. Top-matched comps best support the ARV.
Projected returns pro-forma
-3.0% appreciation · 2.76% rent growth · sell at horizon
- IRR
- -25.9%
- Equity multiple
- 0.12×
- Total profit
- $-128,066
- Equity at exit
- $77,906
- IRR
- -23.3%
- Equity multiple
- -0.16×
- Total profit
- $-169,606
- Equity at exit
- $45,176
Cash invested: $146,300 (down + closing). Projections, not guarantees.
Landlord ↔ Tenant lean methodology
- Overall (STATE)
- 28 Tenant-Leaning
- State Washington
- 28 Tenant-Leaning · D+8
- County
- — inherits STATE
- City
- — inherits STATE
ZIP-level market 98038
- Rents YoY
- 2.8%
- Active inventory
- 226
- Price-to-rent
- 11.1×
Monthly cashflow live
- Estimated rent
- $3,929 high interval (Pro) →
- Mortgage (P&I)
- −$2,740
- Tax from tax record
- −$585 /mo · $7,015/yr
- Insurance
- −$218
- HOA
- −$231
- Vacancy / Maint / Mgmt
- −$825
- Net cashflow
- $-669
Break-even live
Sensitivity live
| Price | -10% $-373 | -5% $-521 | +0% $-669 | +5% $-817 | +10% $-965 |
|---|---|---|---|---|---|
| Rent | -10% $-979 | -5% $-824 | +0% $-669 | +5% $-514 | +10% $-359 |
| Rate | -1.0pp $-406 | -0.5pp $-536 | base $-669 | +0.5pp $-804 | +1.0pp $-942 |
UW: 25.0% down · 7.5% · 30yr · 1.5% tax · 5.0% vac · 8.0% maint · 8.0% mgmt
Financing live
Cash to close
- Down payment
- $130,625
- Closing costs
- $15,675
- Reserves months
- —
- Total cash needed
- —
Loan-product check · same deal, 3 products live
Conventional
25% down · 7.5% · 30yr
- Down + closing
- —
- Monthly P&I
- —
- Monthly cashflow
- —
- DSCR
- —
- Eligible?
- —
Personal DTI + credit; lowest rate.
DSCR
20% down · 8.5% · 30yr
- Down + closing
- —
- Monthly P&I
- —
- Monthly cashflow
- —
- DSCR
- —
- Eligible?
- —
No personal income docs; deal must DSCR.
Hard money
10% down · 12.0% · 12mo
- Down + closing
- —
- Monthly P&I
- —
- Monthly cashflow
- —
- DSCR
- —
- Eligible?
- —
Short-term bridge; refi at stabilization.
Rent comps 6 comps
| Address | Beds | Baths | Sqft | Rent | $/sqft | DOM | Units | Dist |
|---|---|---|---|---|---|---|---|---|
| 22435 SE 240th St Maple Valley, WA | 1.0–2.0 | 1.0–2.0 | 859 | $2,375 | $2.76 | 0d | 6 | 0.24mi |
| 24202 224th Ave SE Unit 3 Maple Valley, WA | 2.0 | 2.0 | 1320 | $5,400 | $4.09 | 44d | 1 | 0.26mi |
| 24212 224th Ave SE Unit 4 Maple Valley, WA | 2.0 | 2.0 | 1320 | $5,400 | $4.09 | 44d | 1 | 0.27mi |
| 24116 235th Ave SE Maple Valley, WA | 3.0 | 3.0 | 1680 | $3,272 | $1.95 | 25d | 1 | 0.52mi |
| 21900 SE Wax Rd Maple Valley, WA | 1.0–3.0 | 1.0–2.0 | 808 | $2,052 | $2.54 | 2d | 12 | 0.60mi |
| 24527 250th Ave SE Maple Valley, WA | 1.0 | 1.0 | 930 | $4,000 | $4.30 | 19d | 1 | 1.50mi |
HOA detail
- Monthly dues
- $231 · $2,772/yr
Listing history 2 events
-
2026-05-03status Pending
-
2026-04-16$522,499 Active
ⓘ Source: listings_history table (triggers on properties + properties_extension) + one-shot
backfill from property_details.listing_events for pre-trigger history.
Tax reassessment forecast WA · Resets to sale price
- Current annual tax
- $7,015 · $585/mo
- Projected year-2 tax
- $7,015 · $585/mo
- Expected delta
- $0/yr ($0/mo · 0.0%)
ⓘ Screening estimate from a state-policy table — verify with the county assessor before closing.
Climate risk First Street
- Flood 1/10 Low FEMA zone X (unshaded) · 0% chance over 30 yrs
- Wildfire 1/10 Low
- Heat 2/10 Low 7 d/yr ≥87°F today · 15 d/yr by 30 yrs out
- Wind 1/10 Low
- Air quality 7/10 Severe 11 unhealthy d/yr today · 16 by 30 yrs out
Nearby sold comps map
Loading sold comps map…
Walkable amenities ~0.75 mi
Loading nearby amenities…
Taxation est. · year 1
- Rental income
- $47,154
- − Mortgage interest
- −$29,268
- − Property taxes
- −$7,015
- − Insurance
- −$2,612
- − Repairs & maintenance
- −$3,772
- − Management
- −$3,772
- − HOA
- −$2,772
- − Depreciation
- −$15,200
- Taxable loss
- −$17,258
- Est. tax savings @ 24.0%
- +$4,142
- After-tax cash flow
- $-3,886/yr
For passive investors: Depreciation is non-cash, so a rental often shows a tax loss while cash-flowing — sheltering income. Rental losses are passive: they offset passive income freely, and up to $25,000/yr can offset ordinary (W-2) income if you actively participate and your MAGI is under $100k (phasing out to $0 by $150k); unused losses carry forward. On sale, claimed depreciation is recaptured at up to 25%, and gains may owe capital-gains tax (a 1031 exchange can defer both). Figures are a year-1 estimate at your 24.0% rate — not tax advice; consult a CPA.
Schools (NCES district)
- District
- Tahoma School District
- NCES district ID
- 5308760
- Math proficiency
- 68% ▬ 0.00%
- Reading proficiency
- 76% ▬ 0.00%
- Median HH income
- $94,834
- Composite
- 66.41/100
- National rank
- #925
- State rank
- #10 of 291 in WA
Livability — Maple Valley
- Score
- 85/100
- State rank
- #24
- US rank
- #461
Category grades
Schools grade is shown separately in the Schools card above.
Census & demographics
- Census place
- Maple Valley, WA
- County
- King County · 2,251,916 people
- City population
- 37,324
- Metro
- Seattle-Tacoma-Bellevue, WA
- Population (ZIP)
- 37,324
- Household income
- $152,261
- Rent vs Own
- Severe rent burden
- 580.0
Population outlook (King County) Hauer SSP2
- Today (2025)
- 2,576,485 people
- By 2030
- 2,803,316 · +8.8%
- By 2040
- 3,255,921 · +26.4%
- By 2050
- 3,706,444 · +43.9%
- By 2075
- 4,746,063 · +84.2%
- By 2100
- 5,407,730 · +109.9%
Race, ethnicity, and origin ACS 2023
- Neighborhood character
- Predominantly White (73%)
- Race & ethnicity
- White 73% Asian 10% Two or more races 9% Hispanic / Latino 6% Black 2%
- Hispanic origin (detail)
- Mexican 3%
- Common ancestry
- Portuguese 5% Italian 4% Romanian 3%
- Foreign-born
- 13% · Canada, China, South Korea
- Languages at home
- 86% English-only · Other Asian/Pacific 4% Russian/Polish/Slavic 3% Other Indo-European 2%
Political lean MEDSL · King
- 2024 margin
- Solid D (+51.7) · D 74.2% · R 22.5% · Other 3.4%
- 2008→2024 swing
- +9.6pp toward D · 2008: 42.1pp · 2024: 51.7pp
- All cycles
- 2024: D+51.7 2020: D+52.7 2016: D+50.4 2012: D+39.9 2008: D+42.1
Not yet ingested
- Civics
- —
Market trends
- HPI YoY
- ▼ -588.79%
- Current HPI
- 310.7428
- Rent YoY
- ▲ 2.76%
- Metro
- Seattle-Tacoma-Bellevue, WA
- State GDP YoY
- ▲ 4.65%
- F500 in state
- 22
Industry mix (Fortune 500 HQ in WA)
| Industry | F500 HQs | Revenue |
|---|---|---|
| Retail | 2 | $269B |
|
||
| Technology / Retail | 1 | $638B |
|
||
| Technology | 1 | $245B |
|
||
| Telecommunications | 1 | $38B |
|
||
| Food / Beverage | 1 | $36B |
|
||
| Automotive / Trucks | 1 | $34B |
|
||
Price history
2 events — show timeline
- 2026-05-03 Pending — NWMLS as Distributed by MLS Grid
- 2026-04-16 Listed $522,499 NWMLS as Distributed by MLS Grid
Property tax history
+9.1%/yrLatest (2025): $7,015 · +8.7% YoY. Source: county tax records.
Cash-flow waterfall
monthlySold comps — $/sqft
last 12 mo · ≤1 miLoading sold comps…