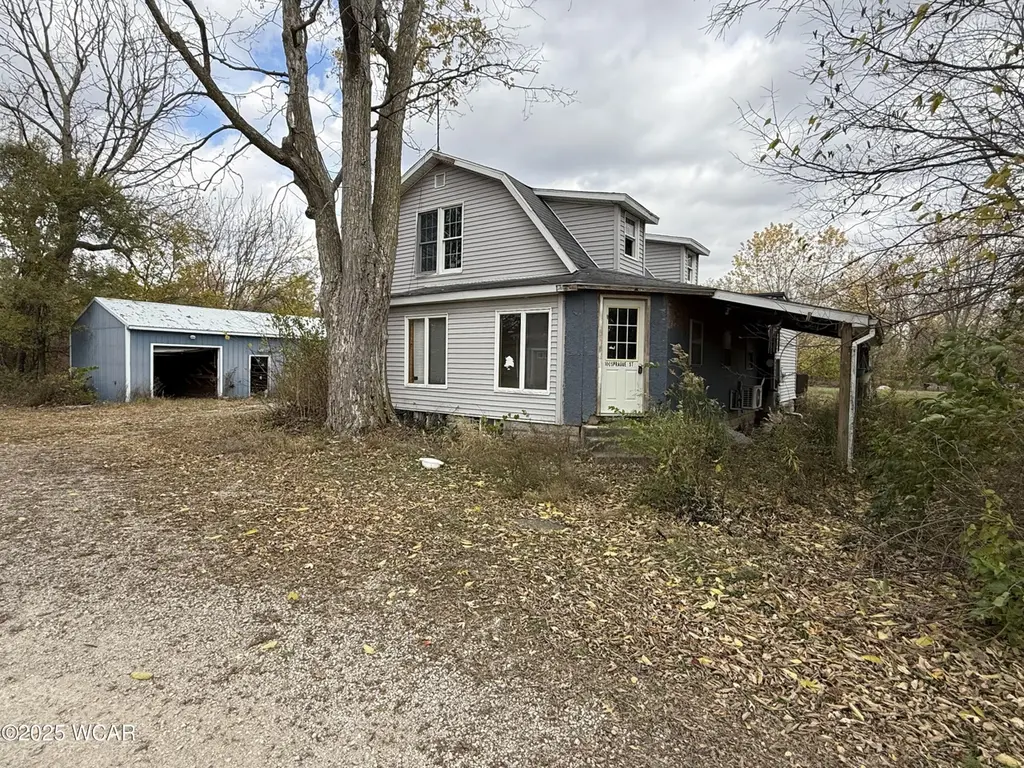
100 Sprague St · Willshire, OH
Flood risk 1/10 · Minimal
- FEMA flood zone
- A
- Chance of flooding over 30 yrs
- 0.0%
- Est. flood insurance / yr
- $946 – $6,584
Fire risk 1/10 · Minimal
- Est. fire insurance / yr
- $713 – $1,323
Heat risk 3/10 · Minor
- Hot days now (above 100°F)
- 7 days/yr
- Hot days in 30 yrs
- 18 days/yr
Wind risk 2/10 · Minimal
- Chance of severe wind over 30 yrs
- —
Air-quality risk 2/10 · Minimal
- Unhealthy air days now
- 1 days/yr
- Unhealthy air days in 30 yrs
- 2 days/yr
Risk factors via First Street. Map © Google.
Why this score? — see what drove the A- grade
The composite is a weighted blend of 9 inputs, each scored 0–100. Each bar is that input's sub-score; the figure is the points it added to the 100-point composite (weight × sub-score).
- Cash flow +27.4/30.0
- ARV discount +15.0/15.0
- DSCR +9.6/10.0
- Appreciation +8.1/10.0
- 1% rule +7.3/10.0
- Schools +6.4/10.0
- Livability +2.8/5.0
- Rent growth +2.5/5.0
- Condition / age +2.5/5.0
$74,900
🖨 Deal sheet 📄 Offer letter ✓ Due diligence
Listing remarks MLS
Looking for a fixer upper, this is an investors dream sitting on 0.51 acres cleaned out inside and ready to finish. Also a building that had an HVAC business in it, and a one car garage attached. The lot the home sits on is a very private area fells like being in the country come check it out!!!!!!!!!!!! THIS HOME IS NOT A FORECLOSURE !!!!!!!
Key facts
- One car garage
- Private area
- Garage
Tags
Neighborhood map
What this means for you Summary
Snapshot
- This is a 2-bed/1.0-bath single-family listed at $75k.
Deal economics
- At list price, monthly cash flow is $-94 ($-1k/yr) — negative.
- To cash-flow at today's rent, offer at most $58k (22.2% below list).
- Meets the 1% rule at list price ($920 rent vs $75k).
- Recommended offer: $58k (22.2% below list) — sets the bar for cash-flow.
Location & tenants
- Location reads 56/100 on livability (#1,110 in OH) — a working-class tenant base; expect higher turnover. Strengths: cost of living A+, housing A+; Watch: employment D+, schools F, crime D-.
- Parkway Local (rural): math 76% / reading 76% proficiency, ranked #96 of 656 in OH (top 15%) — strong family-tenant draw, lease renewals of 3-5y typical.
- Market conditions: 4 active listings in the ZIP; 44 units permitted in Van Wert County in 2024 (0 in 5+ unit buildings).
Forward outlook
- In year one you build about $5k of equity ($518 loan paydown + $5k appreciation (6.2% local appreciation)).
- Van Wert County population projected at -11% by 2050 — secular population decline; favor cash flow + early exit over multi-decade hold.
- By year 7, paydown + projected appreciation supports a ~$34k cash-out refi (75% LTV) — recoverable capital for the next deal without selling this one.
Negotiation context
- It's been on market 225 days — a 12% lower offer ($66k) is reasonable based on typical stale-listing flexibility.
Risks & watch-outs
- Watch-outs: flood insurance adds $314/mo; built in 1862 — expect roof / HVAC / electrical / plumbing capex.
- Climate carrying-cost: in FEMA flood zone A (mandatory federal flood insurance) — expect insurance premiums to compound above CPI over the hold.
Questions for the listing agent
- What do current leases actually rent for vs. the listed asking? Can we see a recent rent roll and the last 12 months of T-12 income?
- It's been on market 225 days. Have you received any prior offers? Is the seller open to a 22% concession, seller financing, or rate buy-down credit?
- Built in 1862 — when were the roof, HVAC, electrical panel, plumbing, and water heater last replaced?
- What's the actual annual flood-insurance premium (NFIP or private), and is the property in a SFHA with mandatory coverage?
- Why hasn't it sold? Are there any deal-killer items the seller is aware of (foundation, flood, title, zoning, code violations)?
- Is there a deadline driving the sale (1031 exchange, divorce, estate, relocation)? That informs how much negotiation room exists.
- Schools are F-rated, which usually means shorter tenancies and higher turnover. Who's the typical renter profile here, and what's been the actual vacancy rate?
- Crime grade is D in this area — have there been break-ins, vandalism, or insurance claims at this property in the last 3 years? What carrier currently insures it and at what premium?
- What's the average days-on-market for RENTAL listings here right now (not sales)? A rising rental-DOM trend means longer vacancies and softer asking-rent achievability than the comps imply.
- What's the recent tenant-quality profile in this submarket — average credit score on applications, eviction rate, late-payment / NSF rate, and stable-employment percentage? A property-management company in the area should have these aggregated.
- How much new for-sale + rental construction is in the pipeline within 1–3 miles? Heavy new supply typically softens prices + rents 12–24 months out; constrained supply supports both.
Investment metrics
- 1% rule
- 1.23% ✓
- Cap rate
- 9.81%
- Cash-on-cash
- 12.56%
- DSCR
- 1.56
- GRM
- 6.8
CMA / ARV
- ARV (median comp)
- $137,535
- List price
- $74,900
- Delta
- -45.54%
- Verdict
- UNDERPRICED
- Comps
- 19 within 1.0 mi
Show comp detail 3 sales within ~0.75 mi
| Address | Dist | Beds/Ba | Sqft | Sold | Price | $/sf | Match |
|---|---|---|---|---|---|---|---|
| 505 South St | 0.43mi | 3/1.0 (+1) | 1,000 (+2%) | 8mo | $75,000 | $75 | 66 |
| 610 Fort Recovery Rd | 0.37mi | 3/1.0 (+1) | 1,078 (+10%) | 1mo | $145,000 | $135 | 61 |
| 622 Rockford Rd | 0.48mi | 3/1.0 (+1) | 1,040 (+6%) | 13mo | $125,000 | $120 | 52 |
Match score weights: distance 35% · size 25% · config 20% · recency 20%. Top-matched comps best support the ARV.
Projected returns pro-forma
6.18% appreciation · 3.0% rent growth · sell at horizon
- IRR
- 11.6%
- Equity multiple
- 1.79×
- Total profit
- $16,627
- Equity at exit
- $47,941
- IRR
- 12.5%
- Equity multiple
- 3.57×
- Total profit
- $53,800
- Equity at exit
- $87,687
Cash invested: $20,972 (down + closing). Projections, not guarantees.
Landlord ↔ Tenant lean methodology
- Overall (STATE)
- 73 Landlord-Friendly
- State Ohio
- 73 Landlord-Friendly · R+6
- County
- — inherits STATE
- City
- — inherits STATE
ZIP-level market 45898
- Home prices YoY
- 2.3%
- Active inventory
- 4
- Price-to-rent
- 6.8×
Monthly cashflow live
- Estimated rent
- $920 medium interval (Pro) →
- Mortgage (P&I)
- −$393
- Tax from tax record
- −$83 /mo · $999/yr
- Insurance
- −$31
- Flood insurance flood zone
- −$314 /mo · $3,765/yr
- HOA
- −$0
- Vacancy / Maint / Mgmt
- −$193
- Net cashflow
- $-94
Break-even live
UW: 25.0% down · 7.5% · 30yr · 1.5% tax · 5.0% vac · 8.0% maint · 8.0% mgmt
Financing live
Cash to close
- Down payment
- $18,725
- Closing costs
- $2,247
- Reserves months
- —
- Total cash needed
- —
Loan-product check · same deal, 3 products live
Conventional
25% down · 7.5% · 30yr
- Down + closing
- —
- Monthly P&I
- —
- Monthly cashflow
- —
- DSCR
- —
- Eligible?
- —
Personal DTI + credit; lowest rate.
DSCR
20% down · 8.5% · 30yr
- Down + closing
- —
- Monthly P&I
- —
- Monthly cashflow
- —
- DSCR
- —
- Eligible?
- —
No personal income docs; deal must DSCR.
Hard money
10% down · 12.0% · 12mo
- Down + closing
- —
- Monthly P&I
- —
- Monthly cashflow
- —
- DSCR
- —
- Eligible?
- —
Short-term bridge; refi at stabilization.
Listing history 19 events
-
2026-06-18days on market $74,900 Active 225 DOM
-
2026-06-18price $74,900 Active 224 DOM
-
2026-06-17days on market $79,900 Active 224 DOM
-
2026-06-16days on market $79,900 Active 223 DOM
-
2026-06-15days on market $79,900 Active 222 DOM
-
2026-06-13days on market $79,900 Active 220 DOM
-
2026-06-12days on market $79,900 Active 219 DOM
-
2026-06-09days on market $79,900 Active 216 DOM
-
2026-06-08days on market $79,900 Active 215 DOM
-
2026-06-08days on market $79,900 Active 214 DOM
-
2026-06-05days on market $79,900 Active 212 DOM
-
2026-06-04days on market $79,900 Active 210 DOM
-
2026-06-02days on market $79,900 Active 209 DOM
-
2026-06-01days on market $79,900 Active 208 DOM
-
2026-05-31days on market $79,900 Active 207 DOM
-
2026-02-02price $84,900 344-char remark
Show marketing remark (344 chars)
Looking for a fixer upper, this is an investors dream sitting on 0.51 acres cleaned out inside and ready to finish. Also a building that had an HVAC business in it, and a one car garage attached. The lot the home sits on is a very private area fells like being in the country come check it out!!!!!!!!!!!! THIS HOME IS NOT A FORECLOSURE !!!!!!!
-
2025-12-18price $89,900 344-char remark
Show marketing remark (344 chars)
Looking for a fixer upper, this is an investors dream sitting on 0.51 acres cleaned out inside and ready to finish. Also a building that had an HVAC business in it, and a one car garage attached. The lot the home sits on is a very private area fells like being in the country come check it out!!!!!!!!!!!! THIS HOME IS NOT A FORECLOSURE !!!!!!!
-
2025-11-26price $94,000 344-char remark
Show marketing remark (344 chars)
Looking for a fixer upper, this is an investors dream sitting on 0.51 acres cleaned out inside and ready to finish. Also a building that had an HVAC business in it, and a one car garage attached. The lot the home sits on is a very private area fells like being in the country come check it out!!!!!!!!!!!! THIS HOME IS NOT A FORECLOSURE !!!!!!!
-
2025-11-05$99,000 Active 344-char remark
Show marketing remark (344 chars)
Looking for a fixer upper, this is an investors dream sitting on 0.51 acres cleaned out inside and ready to finish. Also a building that had an HVAC business in it, and a one car garage attached. The lot the home sits on is a very private area fells like being in the country come check it out!!!!!!!!!!!! THIS HOME IS NOT A FORECLOSURE !!!!!!!
ⓘ Source: listings_history table (triggers on properties + properties_extension) + one-shot
backfill from property_details.listing_events for pre-trigger history.
Tax reassessment forecast OH · Partial reset (capped growth)
- Current annual tax
- $999 · $83/mo
- Projected year-2 tax
- $1,084 · $90/mo
- Expected delta
- +$85/yr (+$7/mo · 8.5%)
ⓘ Screening estimate from a state-policy table — verify with the county assessor before closing.
Climate risk First Street
- Flood 1/10 Low FEMA zone A · 0% chance over 30 yrs
- Wildfire 1/10 Low
- Heat 3/10 Moderate 7 d/yr ≥100°F today · 18 d/yr by 30 yrs out
- Wind 2/10 Low
- Air quality 2/10 Low 1 unhealthy d/yr today · 2 by 30 yrs out
Nearby sold comps map
Loading sold comps map…
Walkable amenities ~0.75 mi
Loading nearby amenities…
Taxation est. · year 1
- Rental income
- $11,040
- − Mortgage interest
- −$4,196
- − Property taxes
- −$999
- − Insurance
- −$4,140
- − Repairs & maintenance
- −$883
- − Management
- −$883
- − Depreciation
- −$2,179
- Taxable loss
- −$2,240
- Est. tax savings @ 24.0%
- +$538
- After-tax cash flow
- $-593/yr
For passive investors: Depreciation is non-cash, so a rental often shows a tax loss while cash-flowing — sheltering income. Rental losses are passive: they offset passive income freely, and up to $25,000/yr can offset ordinary (W-2) income if you actively participate and your MAGI is under $100k (phasing out to $0 by $150k); unused losses carry forward. On sale, claimed depreciation is recaptured at up to 25%, and gains may owe capital-gains tax (a 1031 exchange can defer both). Figures are a year-1 estimate at your 24.0% rate — not tax advice; consult a CPA.
Schools (NCES district)
- District
- Parkway Local
- NCES district ID
- 3904857
- Math proficiency
- 76% ▼ -7.00%
- Reading proficiency
- 76% ▼ -2.00%
- Median HH income
- $47,796
- Composite
- 64.14/100
- National rank
- #569
- State rank
- #96 of 656 in OH
Livability — Willshire
- Score
- 56/100
- State rank
- #1110
- US rank
- #22631
Category grades
Schools grade is shown separately in the Schools card above.
Census & demographics
- Census place
- Willshire, OH
- County
- Van Wert · 34,605 people
- Population (ZIP)
- 908
- Household income
- $54,063
- Rent vs Own
Population outlook (Van Wert County) Hauer SSP2
- Today (2025)
- 28,235 people
- By 2030
- 27,793 · -1.6%
- By 2040
- 26,650 · -5.6%
- By 2050
- 25,251 · -10.6%
- By 2075
- 22,247 · -21.2%
- By 2100
- 18,559 · -34.3%
Race, ethnicity, and origin ACS 2023
- Neighborhood character
- Predominantly White (96%)
- Race & ethnicity
- White 96% Two or more races 3% Hispanic / Latino 1%
- Common ancestry
- Italian 3% Slovak 1% Iranian 1%
- Foreign-born
- 1%
Political lean MEDSL · Van Wert
- 2024 margin
- Solid R (+58.5) · D 20.4% · R 78.9%
- 2008→2024 swing
- -31.3pp toward R · 2008: -27.2pp · 2024: -58.5pp
- All cycles
- 2024: R+58.5 2020: R+57.4 2016: R+56.4 2012: R+40.5 2008: R+27.2
Not yet ingested
- Civics
- —
Market trends
- HPI YoY
- ▲ 6.18%
- Current HPI
- 272.2168
- Rent YoY
- —
- Metro
- —
- State GDP YoY
- ▲ 1.98%
- F500 in state
- 48
Industry mix (Fortune 500 HQ in OH)
| Industry | F500 HQs | Revenue |
|---|---|---|
| Insurance | 3 | $145B |
|
||
| Industrial Machinery | 3 | $49B |
|
||
| Financial Services | 3 | $24B |
|
||
| Consumer Goods | 2 | $93B |
|
||
| Aerospace / Defense | 2 | $47B |
|
||
| Utilities | 2 | $33B |
|
||
Price history
-14.2% since first listed4 events — show timeline
- 2026-02-02 Price Changed $84,900 WCARE
- 2025-12-18 Price Changed $89,900 WCARE
- 2025-11-26 Price Changed $94,000 WCARE
- 2025-11-05 Listed $99,000 WCARE
Property tax history
-0.5%/yrLatest (2025): $999 · +0.6% YoY. Source: county tax records.
Cash-flow waterfall
monthlySold comps — $/sqft
last 12 mo · ≤1 miLoading sold comps…